1. Learn how Prometheus Stack on Kubernetes provides monitoring and alerting for clusters, nodes, and applications.
2. Understand Grafana’s role in transforming Prometheus metrics into actionable insights.
3. Follow a step-by-step guide to deploy CRDs, kube-prometheus-stack, and connect it to Devtron.
4. Enable application-level metrics to track resource usage, latency, and throughput.
5. Discover how Devtron simplifies Prometheus + Grafana integration for centralized observability.
What is Kubernetes Monitoring and Why It Matters?
Kubernetes has emerged as the de facto platform for orchestrating and scaling containerized applications. While it empowers DevOps and SRE teams with automation and agility, Kubernetes also introduces operational complexity. Its highly dynamic, distributed nature means multiple workloads, pods, and services are constantly being created, modified, and terminated, making real-time visibility essential.
Kubernetes Monitoring involves collecting, analyzing, and visualizing metrics across clusters, nodes, and workloads to ensure application health and performance. Without an effective monitoring stack, teams risk missing early signals of system failures, degraded performance, or inefficient resource usage.
What is Prometheus Stack on Kubernetes?
Prometheus and Grafana form the Prometheus Stack, which is the industry-standard observability solution for Kubernetes.
Prometheus handles:
- Metrics collection and time-series storage
- Alerting through Alertmanager
- Automatic target discovery in dynamic environments like Kubernetes
Grafana provides:
- Custom dashboards and visualizations
- Alerts and anomaly detection
- Multi-source data aggregation, including Prometheus, Loki, and SQL databases
Together, they give DevOps teams complete observability of Kubernetes environments.
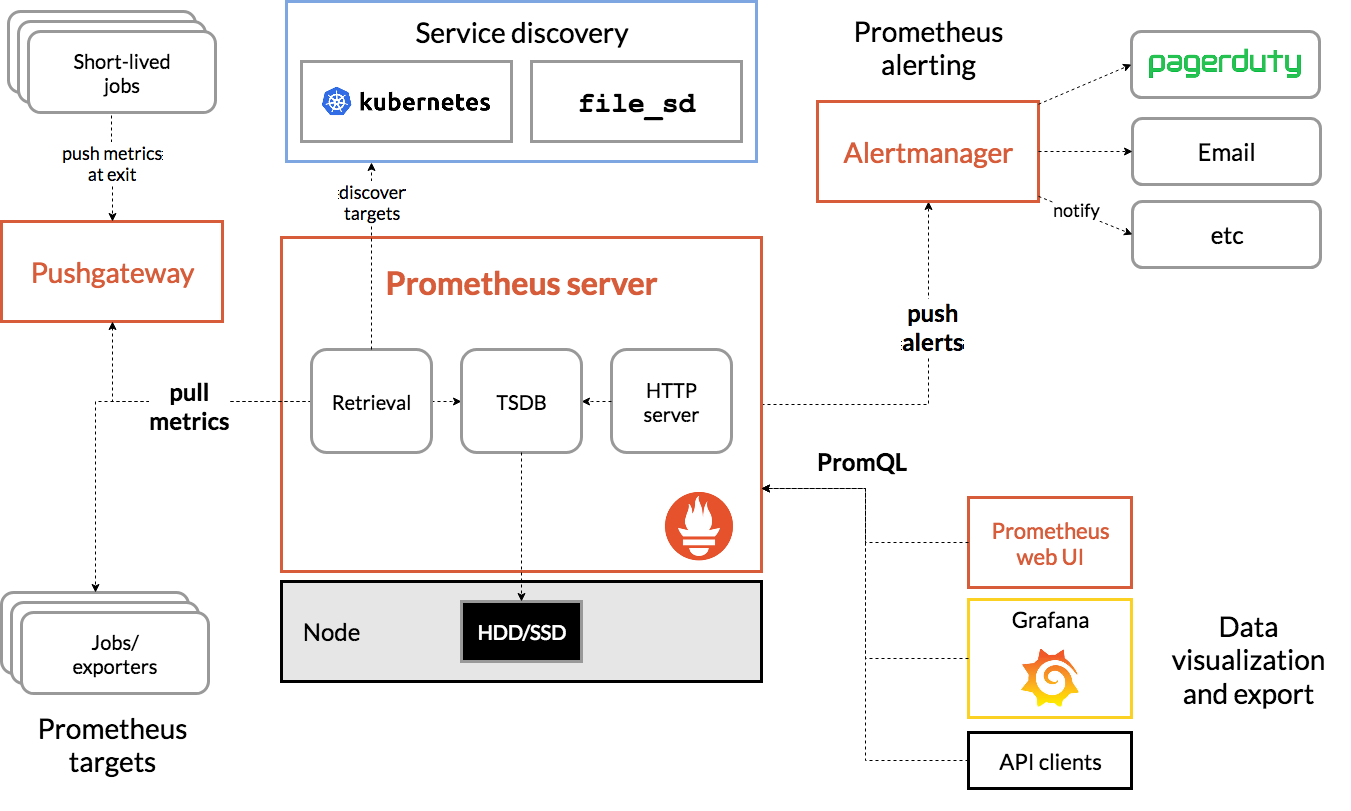
The key components of Prometheus are:
Prometheus Server
Prometheus Server is the core component of Prometheus that handles metric collection, storage, and serving of time-series data. It pulls metrics from configured targets at specified intervals, stores them locally or remotely, and provides a powerful query language (PromQL) for data analysis. Think of it as the central brain that manages all your monitoring data.
Prometheus Alertmanager
Prometheus Alertmanager manages alerts sent by the Prometheus server. It handles alert grouping, deduplication, silencing, and routing notifications to various services like email, Slack, or PagerDuty. When specified alert conditions are met, Alertmanager ensures the right people are notified through their preferred channels.
Prometheus Targets
Prometheus Targets represent the endpoints that Prometheus monitors. These could be your applications, services, or infrastructure components that expose metrics at an HTTP endpoint (usually /metrics). Each target provides metrics in the Prometheus format that the server scrapes at regular intervals.
Pushgateway
Pushgateway is a component that allows you to push metrics to Prometheus, rather than having them pulled. It's particularly useful for short-lived jobs or batch processes that may not exist long enough for Prometheus to scrape them. Think of it as a metrics buffer that accepts pushed data and holds it until Prometheus pulls it.
Service Discovery
Service Discovery helps Prometheus automatically find and monitor new targets in dynamic environments like Kubernetes. Instead of manually configuring each target, service discovery can automatically detect new services, pods, or instances and update Prometheus's scrape configurations accordingly. This is crucial in cloud-native environments where services come and go frequently.
Prometheus Exporter
Prometheus Exporters are specialized components that convert metrics from existing systems (that don't natively expose Prometheus metrics) into a format Prometheus can understand. For example, the Node Exporter converts system metrics (CPU, memory, disk usage) into Prometheus metrics, while the MySQL Exporter does the same for MySQL database metrics. Exporters act as bridges between your existing systems and Prometheus.
What is Grafana?
Grafana is an open-source interactive and data-visualization platform developed by Grafana Labs. Grafana helps users to query, visualize, explore metrics, and monitor data no matter where they are stored with the help of insightful and customized dashboards and visualizations. You can connect Grafana dashboards with any data sources like Prometheus, MySQL, Influx DB, ElasticSearch, PostgreSQL, etc. Some key features of Grafana are:
Custom Dashboards
The Grafana dashboard is a set of one or multiple panels, organized into a single pane of glass, which provides an at-a-glance view of all key metrics. These panels are customizable, and users can create them using components that query and transform raw metrics data from data sources into charts, graphs, and other visualizations.
Alerts
Grafa allows users to set up alerts that notify them of the specific conditions or anomalies in their data i.e. in logs and metrics.
Data Source Compatibility
Grafana supports a wide variety of data sources users can store their raw metrics data in time series databases like Prometheus and CloudWatch, logging tools like Loki and Elasticsearch, NoSQL/SQL databases like Postgres, CI/CD tooling like GitHub, and many more.
Monitoring Stack with Devtron
Devtron has been built in a modular fashion, where you can install different integrations as per your requirements. For monitoring, the default integration is Grafana, as mentioned above. Once Grafana has been installed, we can set up a metrics collector, which would scrape all the metrics and act as a data source for Grafana. In this tutorial, we will set up Prometheus as the metrics collector and add it to the Devtron dashboard for fetching application metrics.
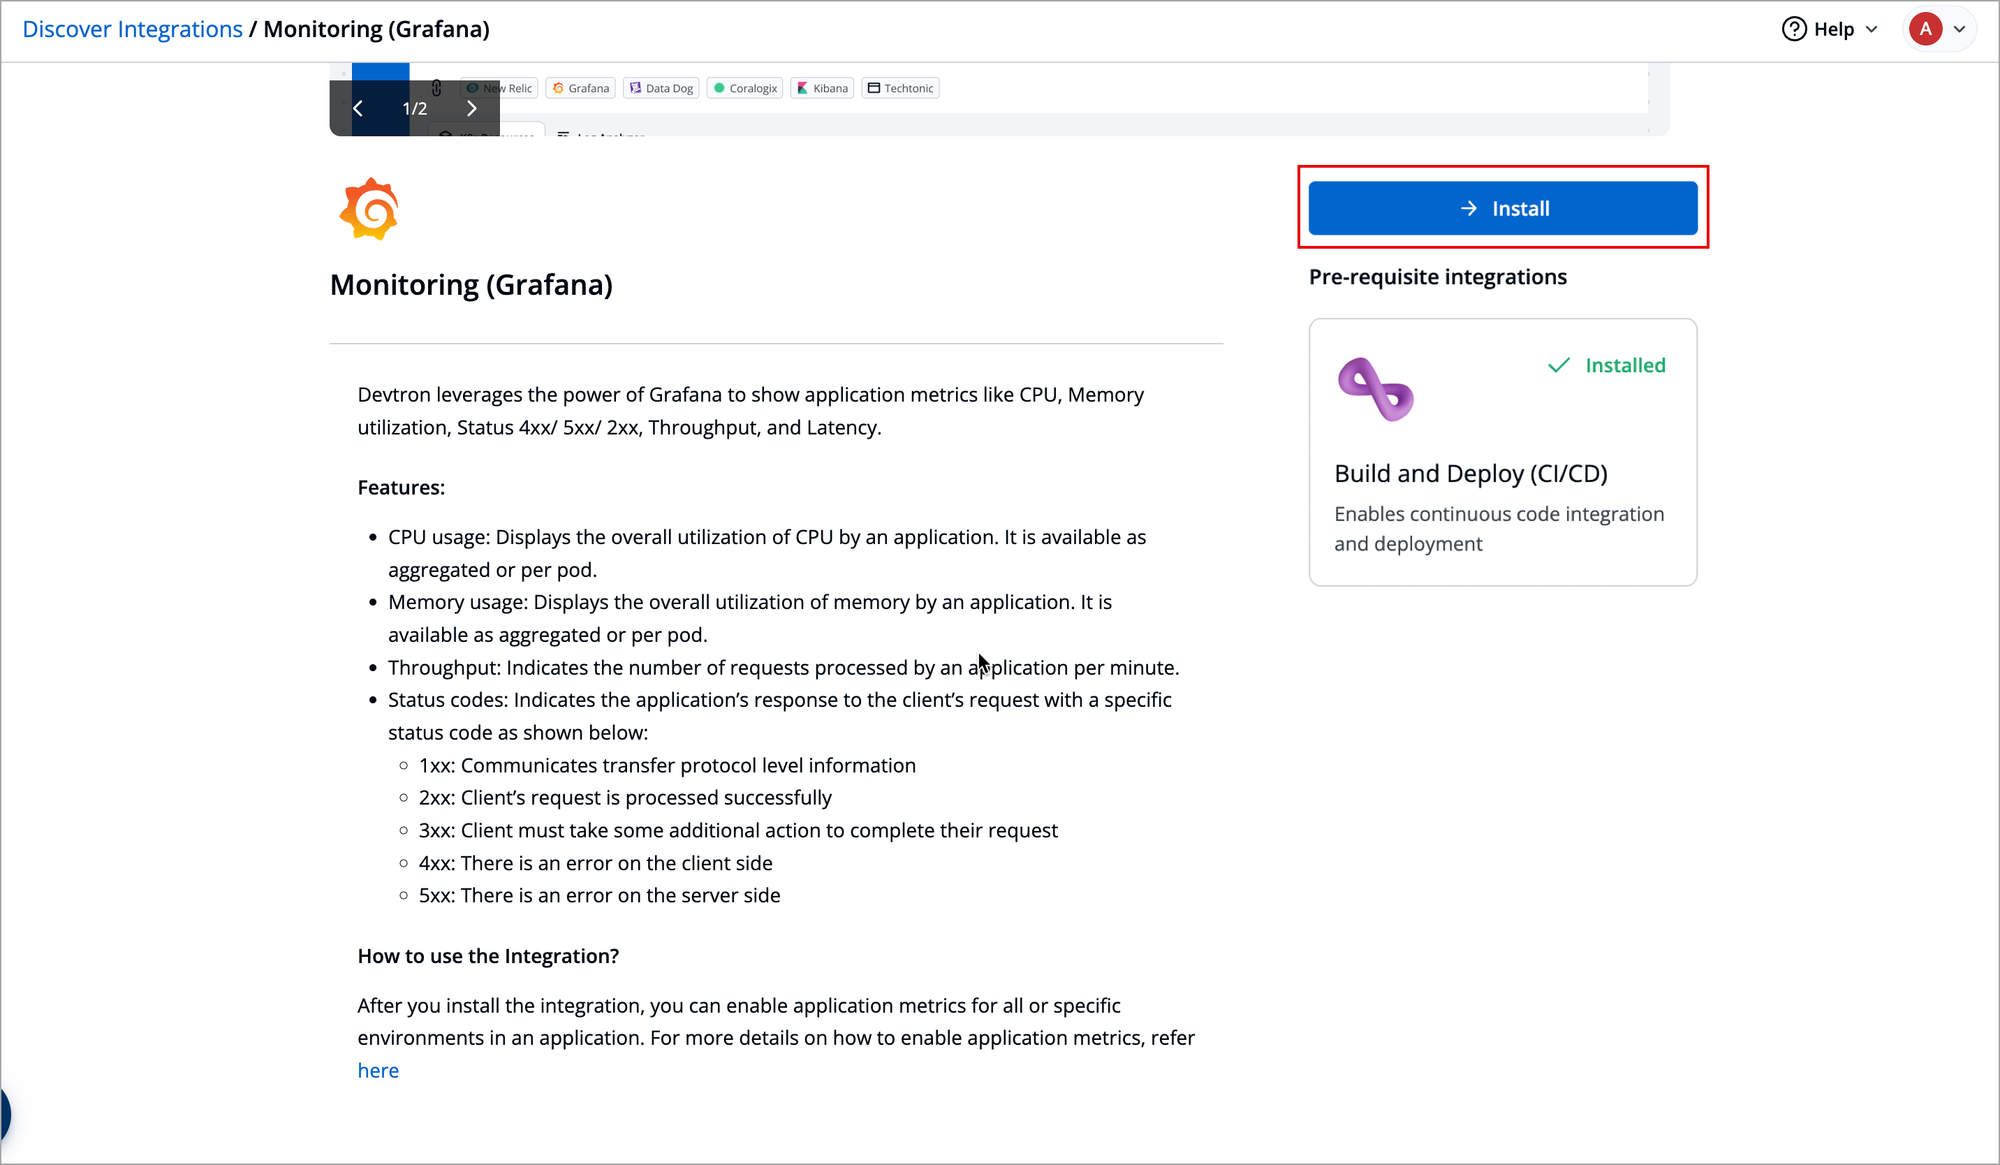
Installing Monitoring (Grafana) Integration
To use Grafana, you need to first install the integration from the Devtron Stack Manager. The beauty of integrations that Devtron brings in is that users don't have to worry about the different tools and their complexities. Devtron carries out all the heavy lifting; users just need to interact with the Devtron dashboard.
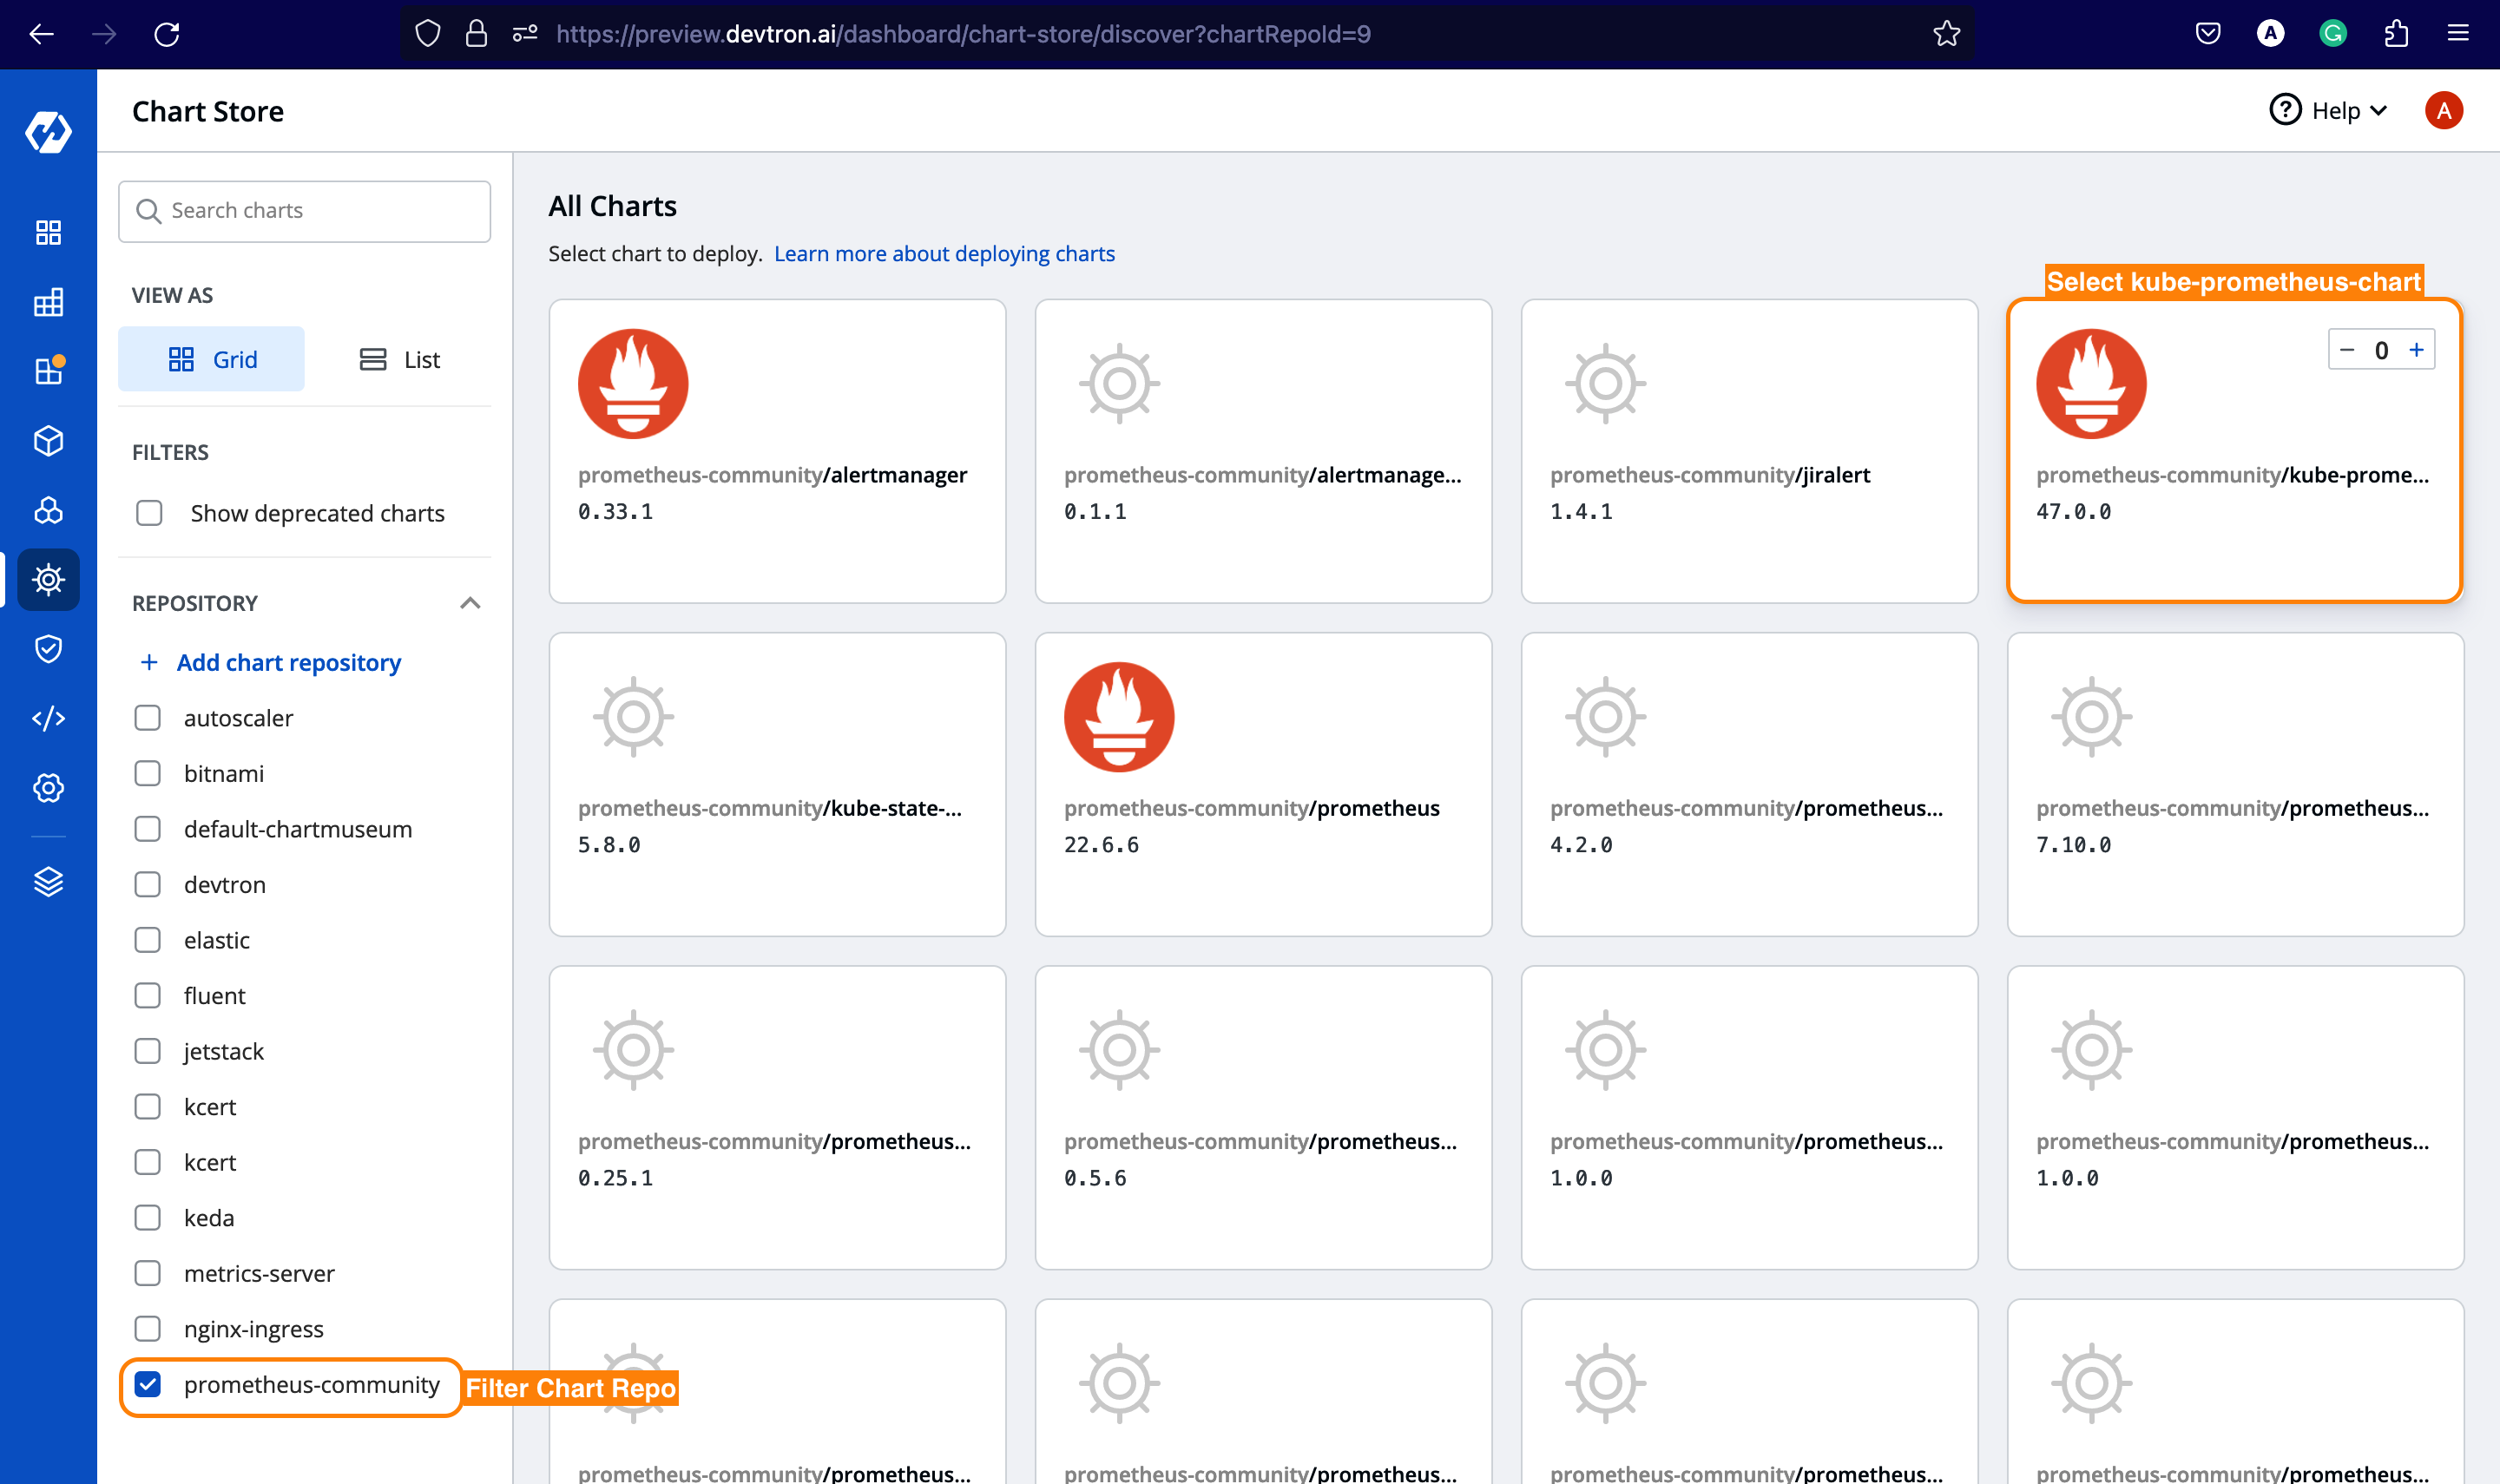
Installing Prometheus
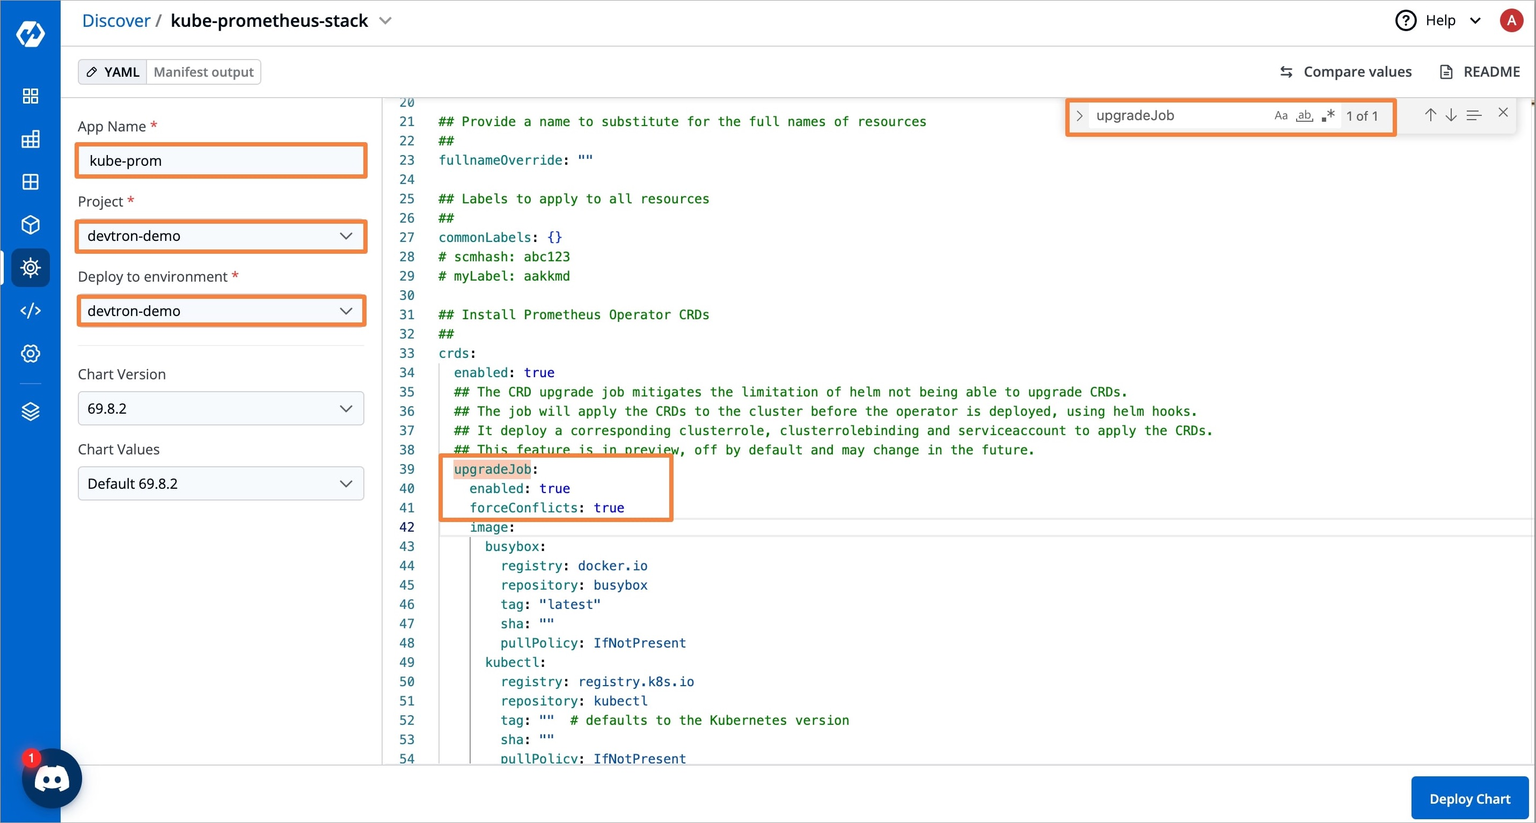
Go to the chart store and search for Prometheus. Use the Prometheus community's kube-prometheus-stack chart to deploy Prometheus. To learn more about this chart, check out the official chart page.
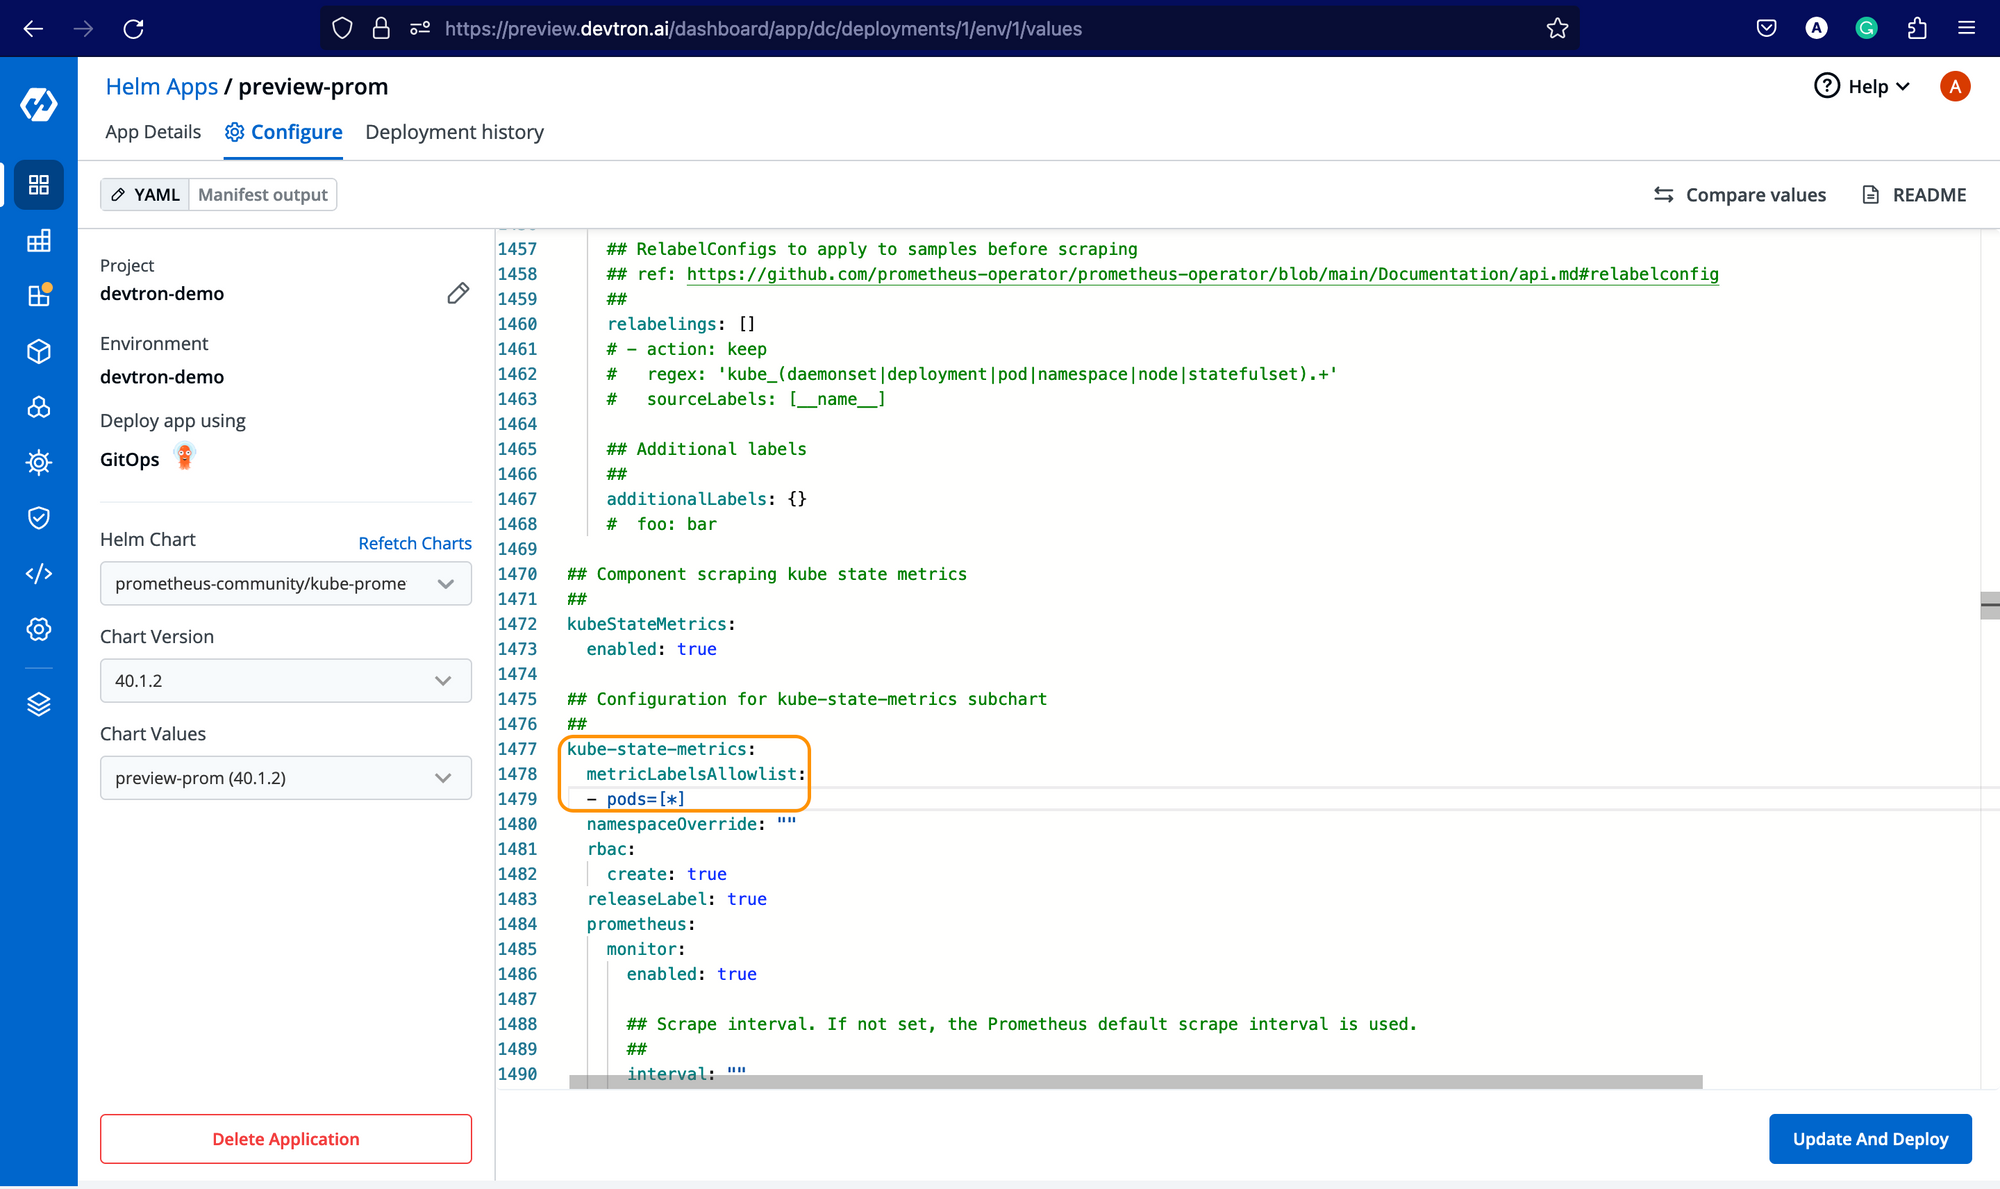
Once you select a chart, you must configure these values before deploying. So, let's make the following changes.
kube-state-metrics:
metricLabelsAllowlist:
- pods=[*]
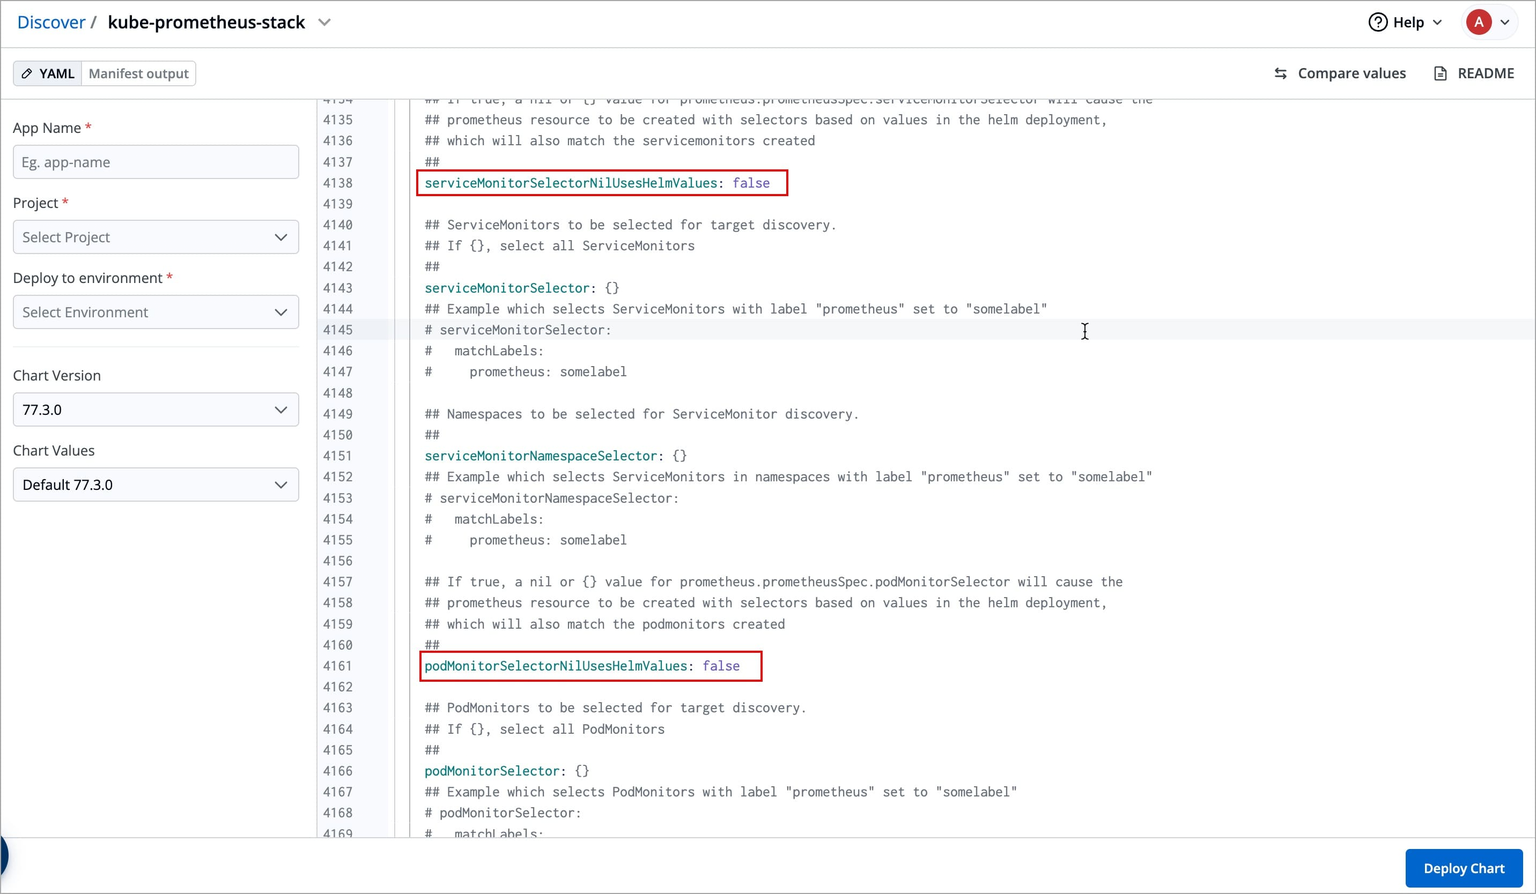
serviceMonitorSelectorNilUsesHelmValues: false
podMonitorSelectorNilUsesHelmValues: false
upgradeJob:
enabled: true
forceConflicts: trueSearch for the above parameters and set these values as defined above. Additionally, if you want to expose the Prometheus dashboard via ingress, you can enable the ingress and provide the hostname for it, and likewise for Grafana, which is being bundled with kube-prometheus-chart
After configuring the above parameters, deploy the kube-prometheus-stack chart.
⚠️ Facing Deployment Timeout due to Failed CRDs
While deploying kube-prometheus-stack chart, the deployment status may show as Timed out, and some CustomResourceDefinitions (CRDs) may appear as Failed.
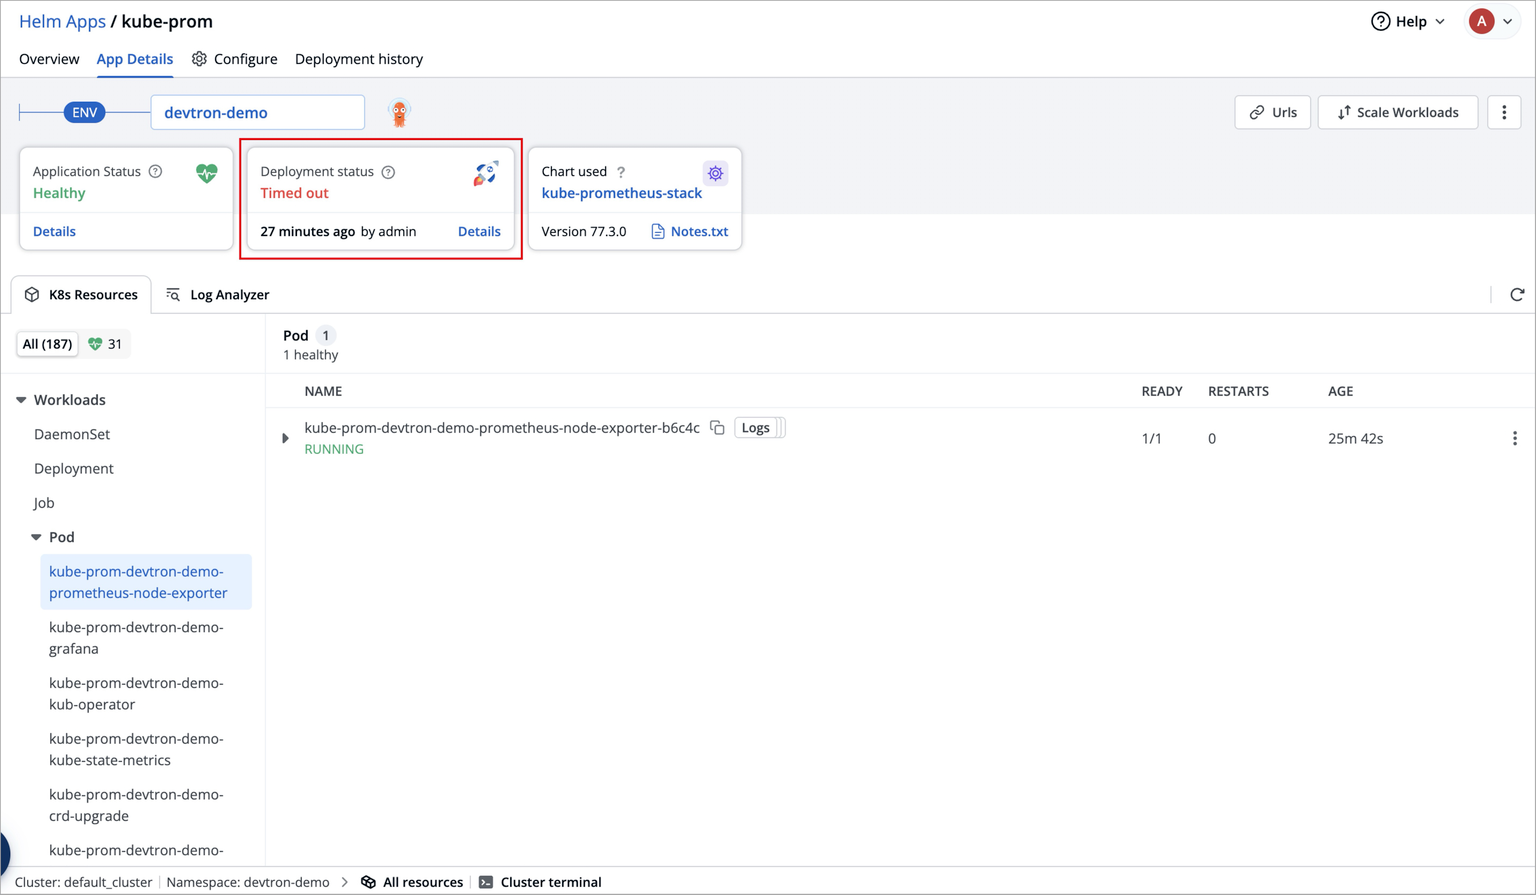
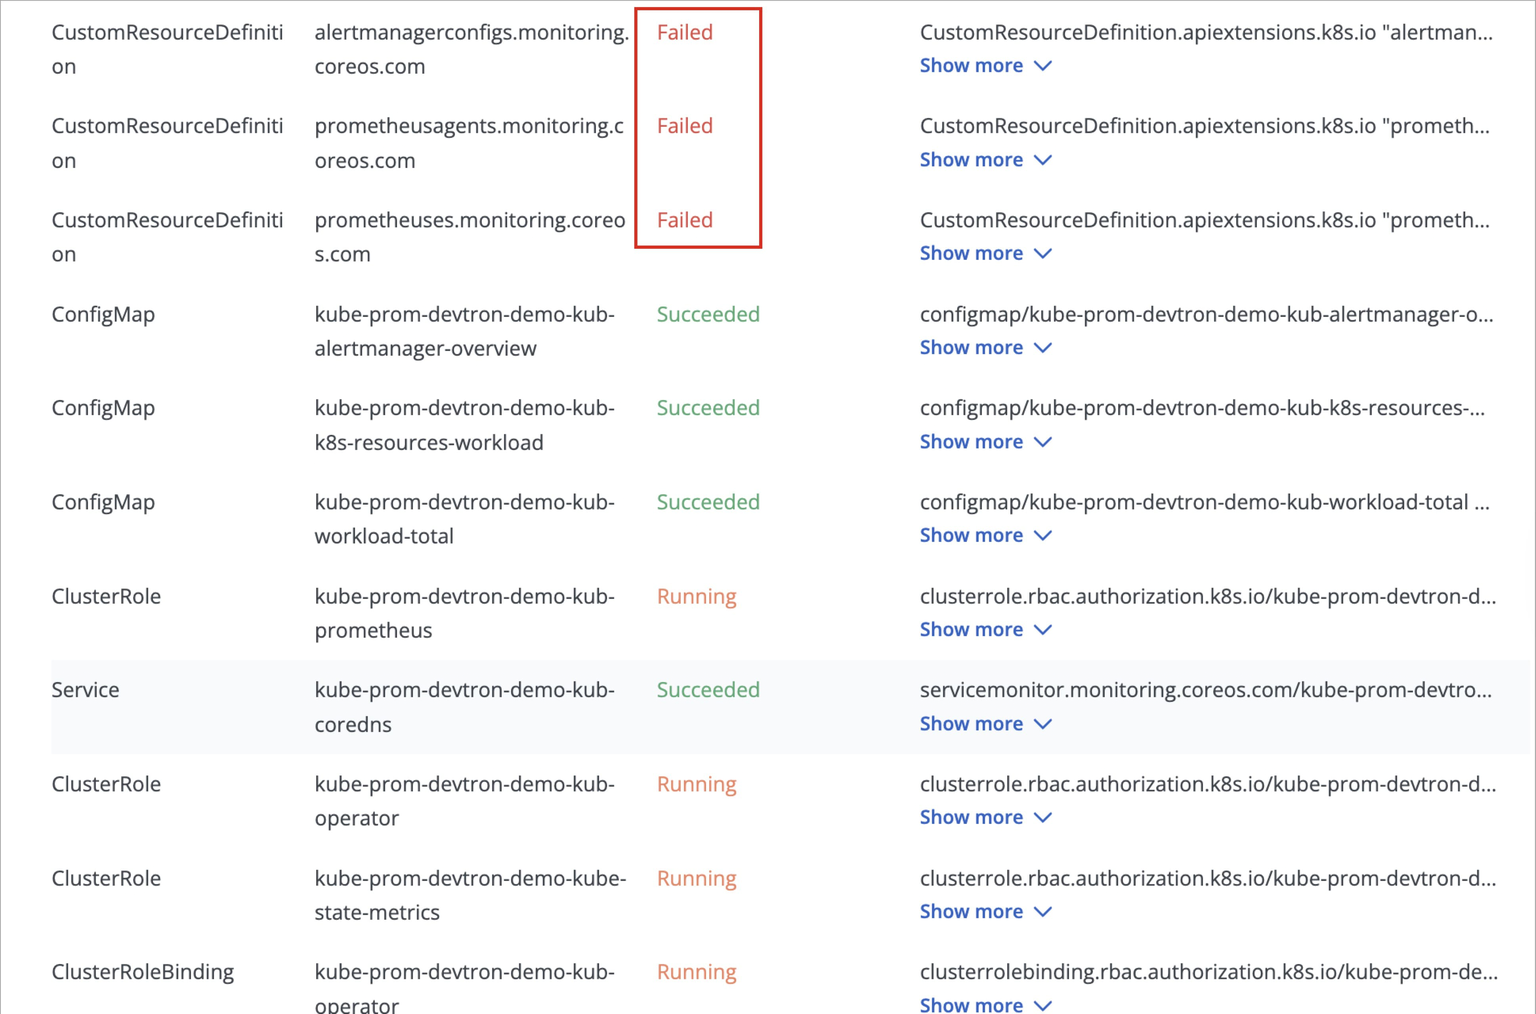
This behavior is expected and does not require any action from you.
This occurs because certain Prometheus CRDs are large in size, which can lead to temporary sync issues during deployment, but this does not impact the functionality of the Prometheus components.
ArgoCD handles such cases automatically, and the kube-prometheus-stack will continue to function as expected.
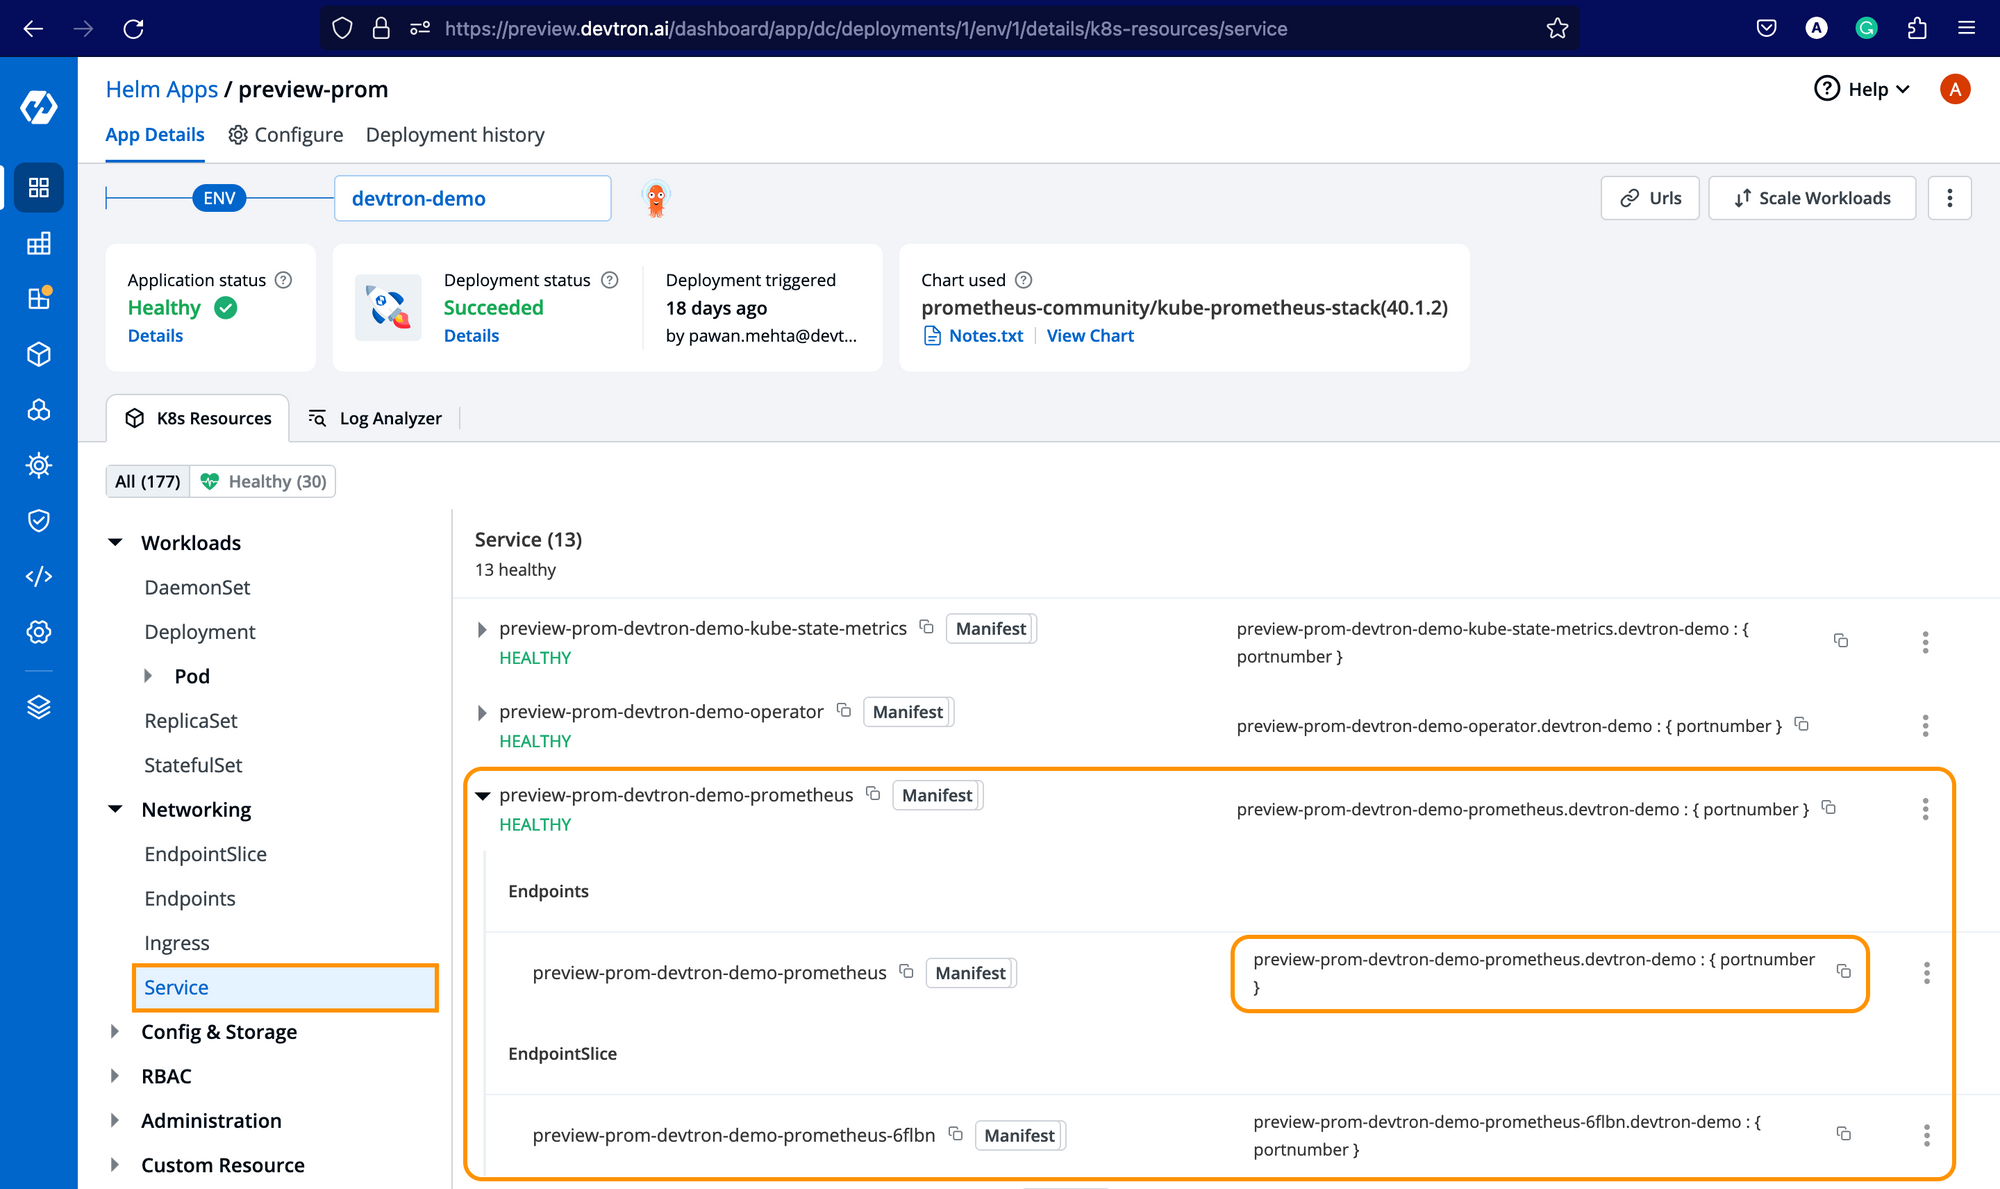
Getting Prometheus Endpoint
Now, after installing Prometheus, you need to get the endpoint of the Prometheus server. For every Helm chart or application deployed at Devtron, you get a resource-grouped view for all Kubernetes resources deployed along with it. To get the endpoint, under Networking → service → Expand the Prometheus server service, and you should be able to see the Endpoints along with EndpointSlice as shown below.
Enabling Application Metrics
Not to use Prometheus as a data source for Grafana, go to Global Configurations -> Clusters & Environments and for the respective cluster where you have installed the Prometheus chart, add the endpoint (followed by http://) as mentioned below, and click on Update Cluster.
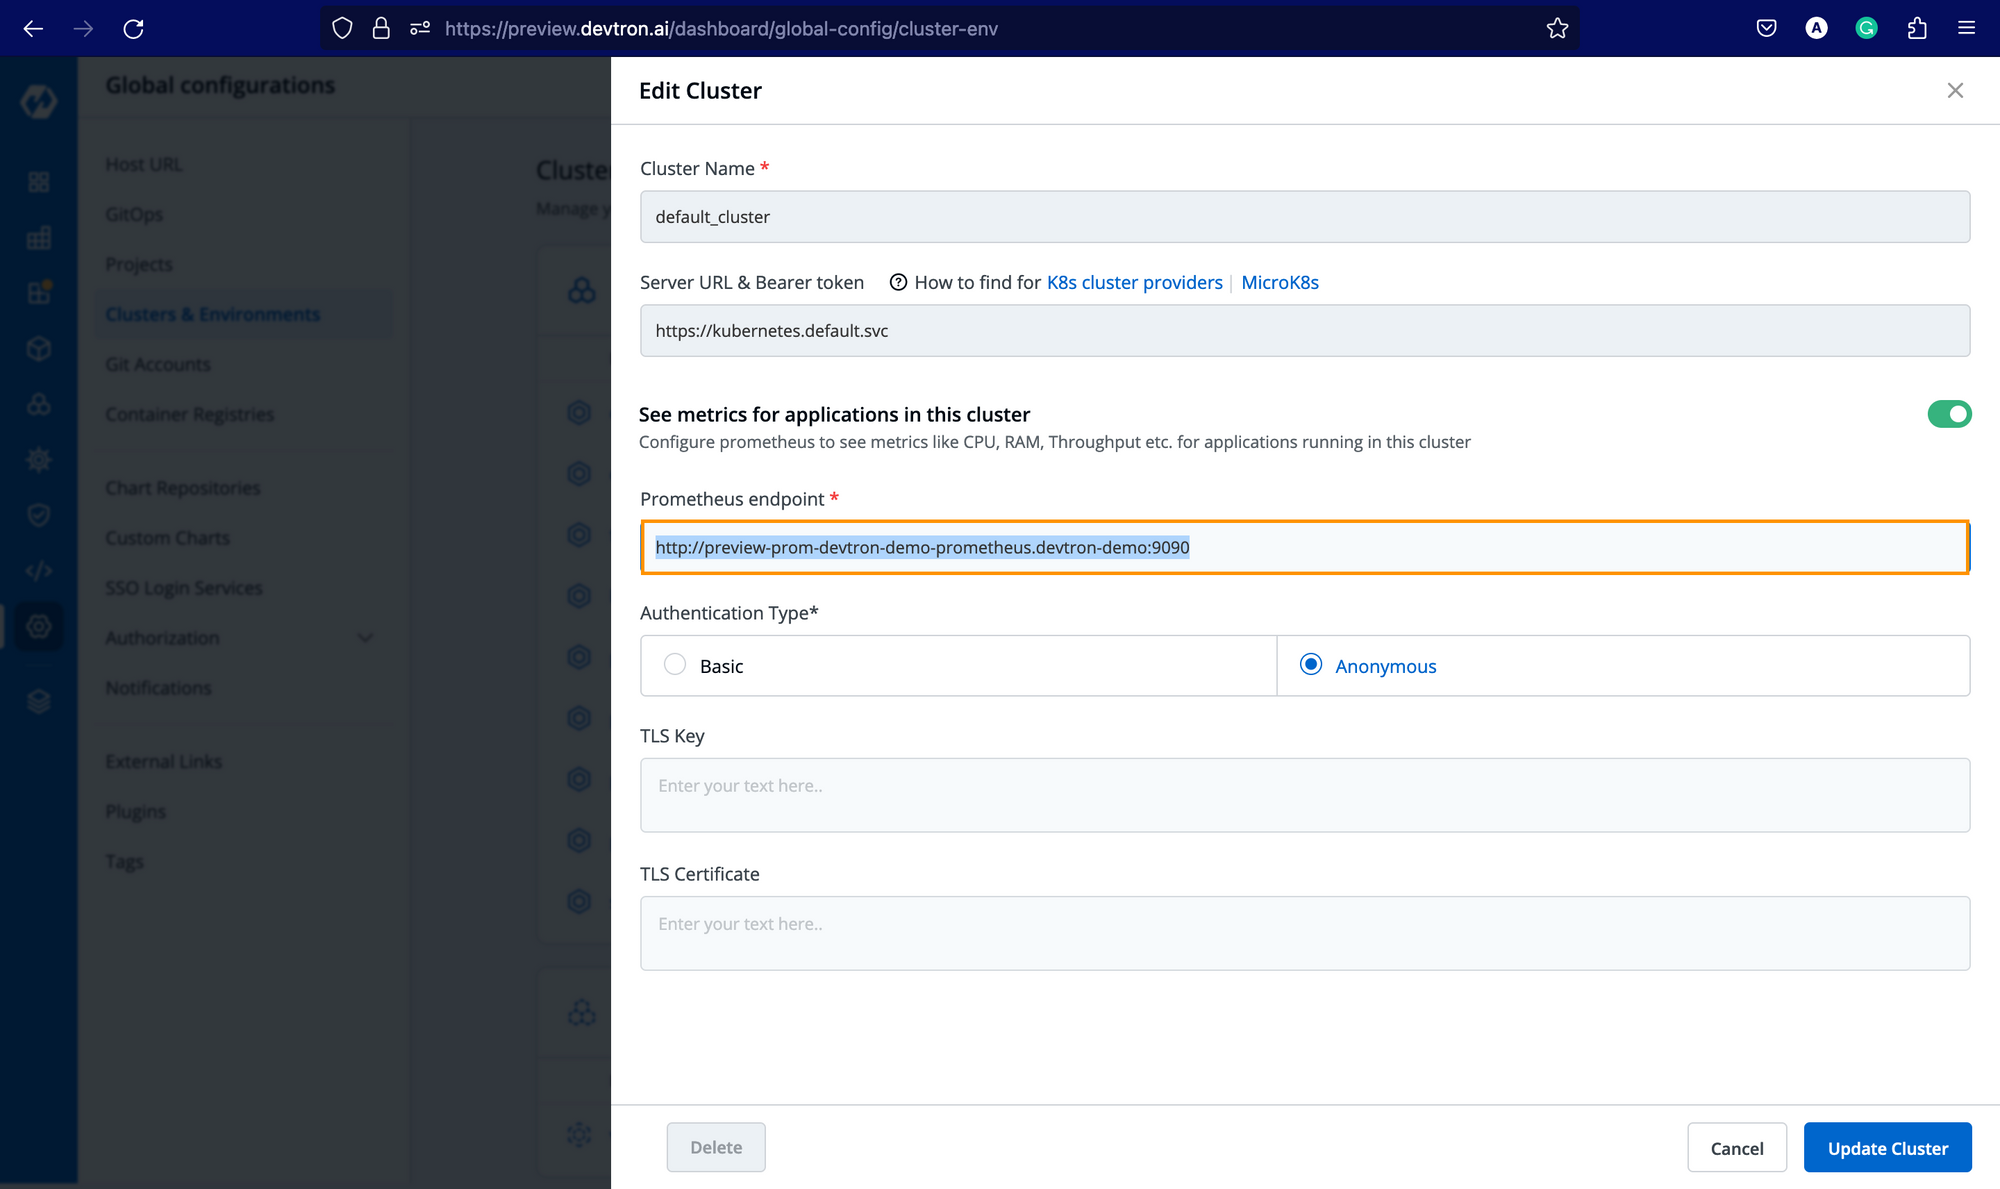
Once you add the endpoint, you will be able to see the application metrics (CPU Usage & Memory Usage) in the Devtron dashboard for all the applications deployed in the respective cluster, irrespective of the environment(s) in which it is being deployed.
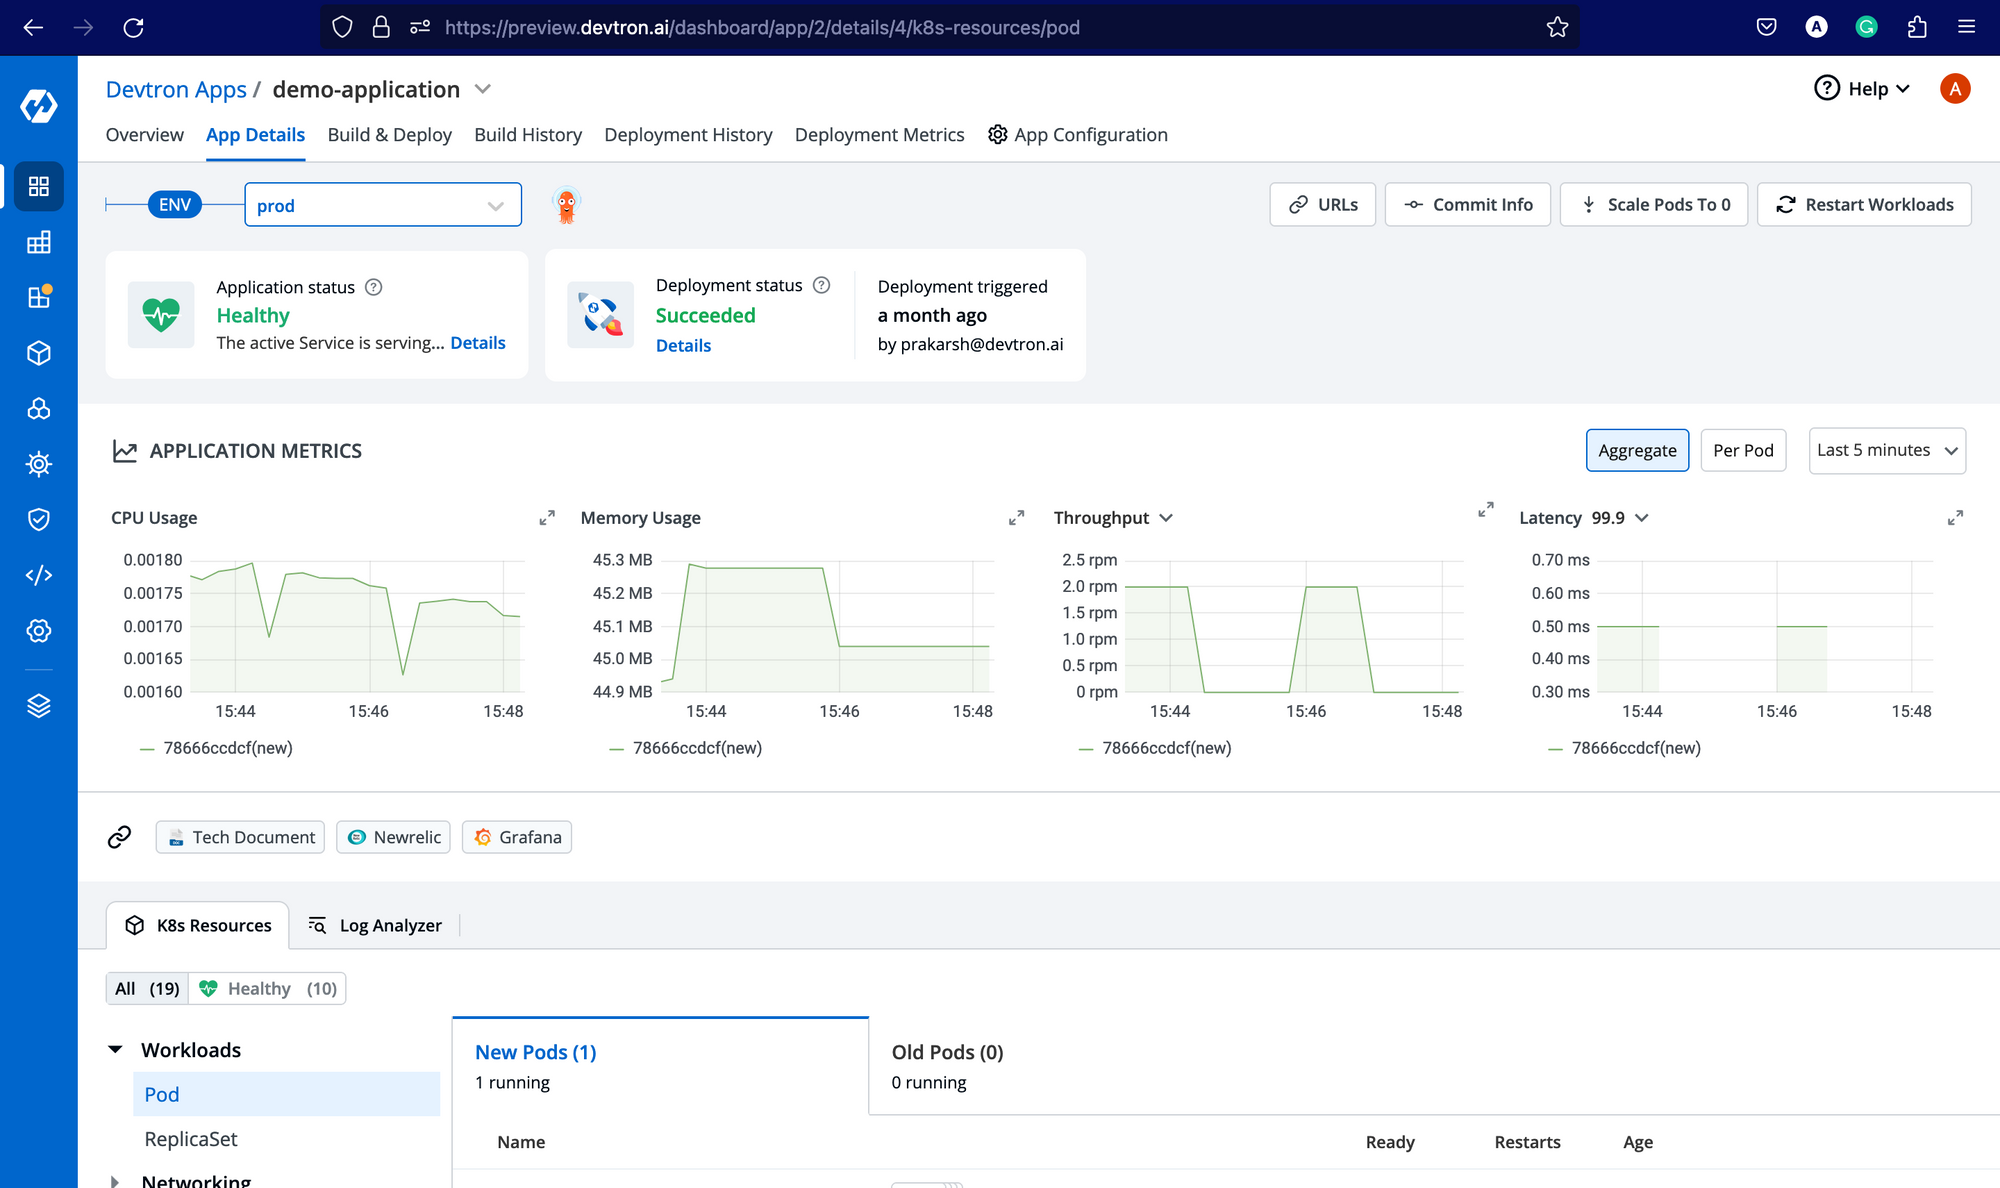
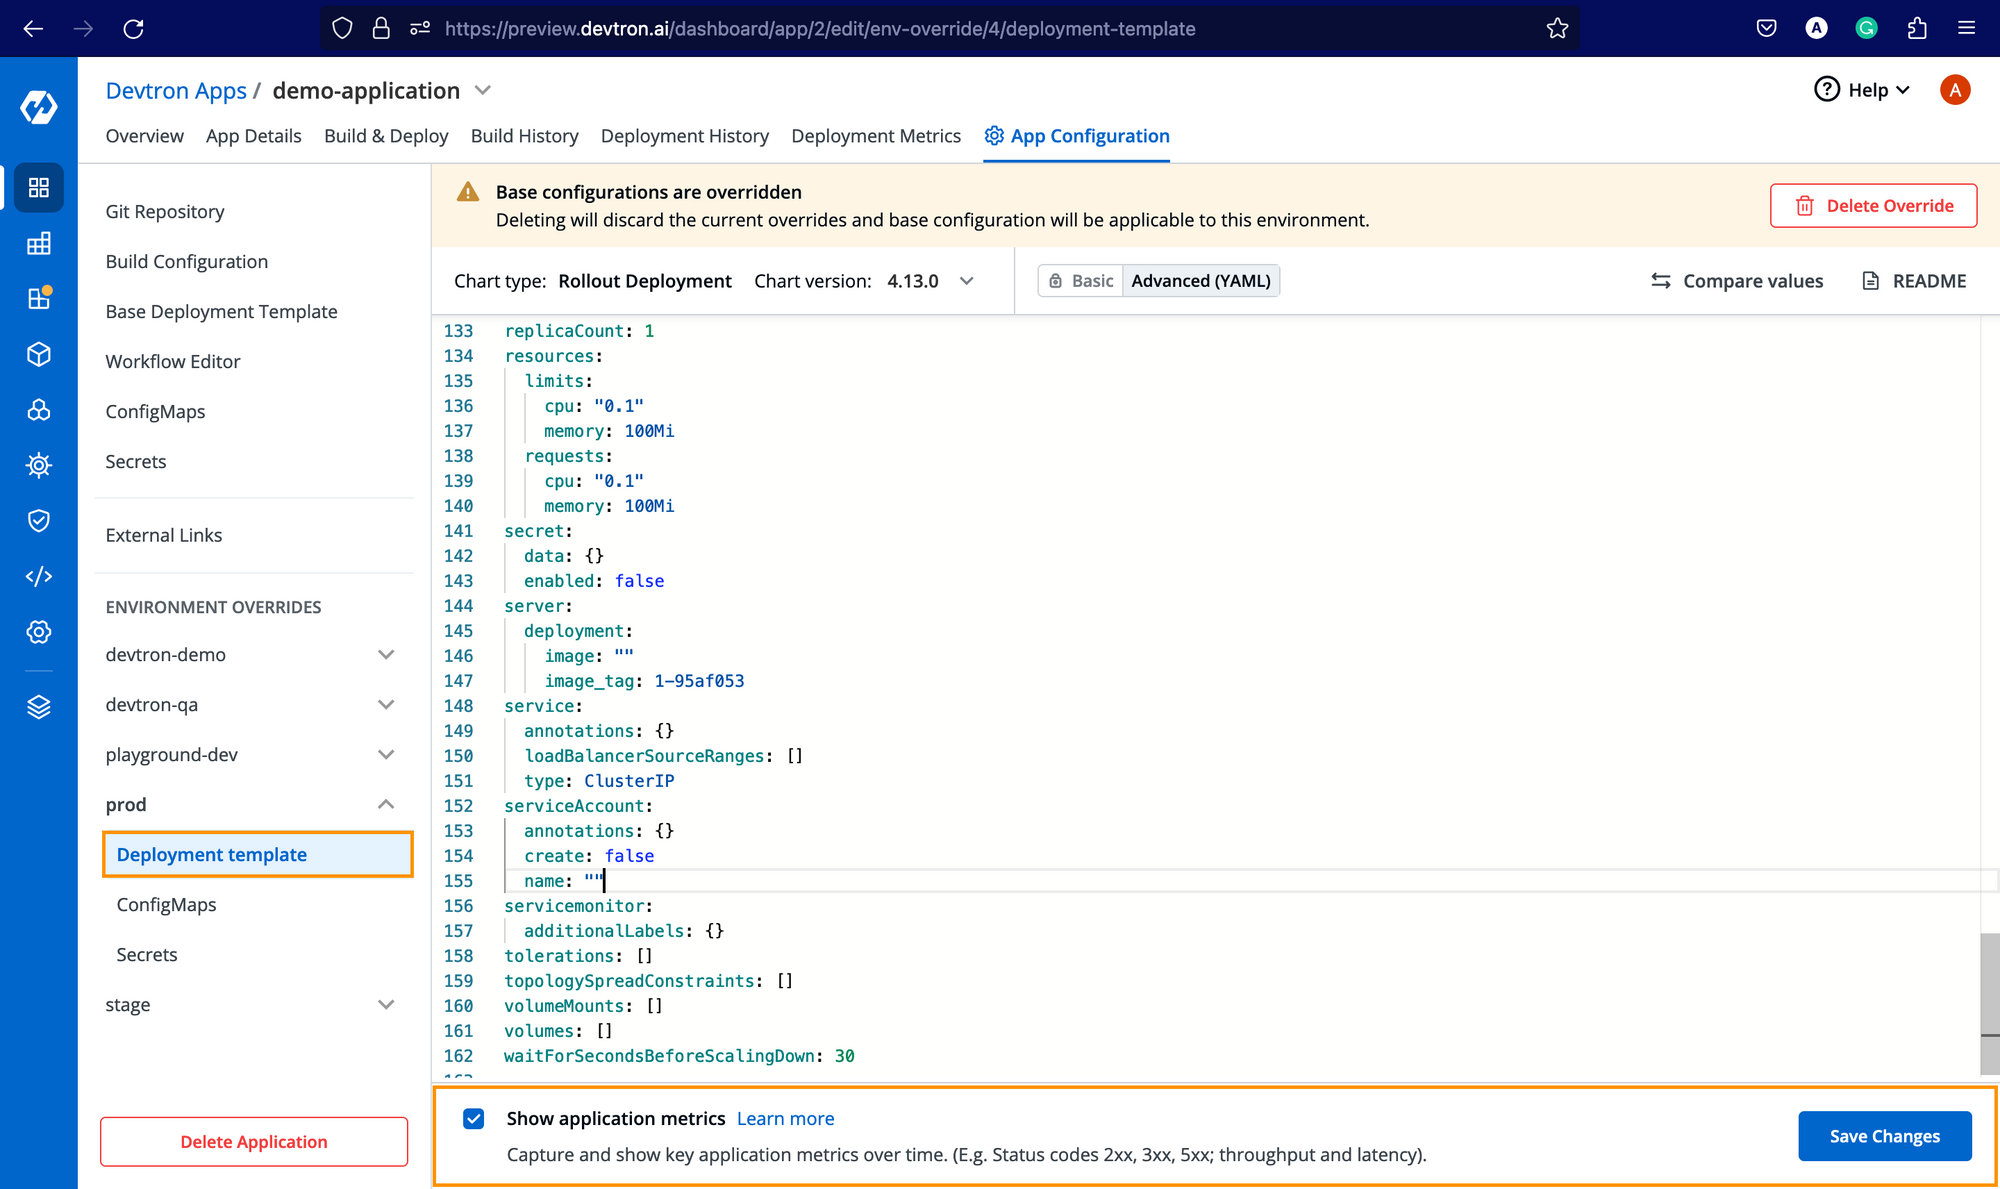
For Throughput and Latency, you need to enable the application metrics for the respective environments from Deployment Template as mentioned below.
Benefits of Using Devtron for Kubernetes Monitoring
Managing the Prometheus Stack on Kubernetes manually can be complex, especially with multiple clusters. Devtron simplifies observability by:
- Automating Prometheus & Grafana setup with minimal YAML
- Providing resource-grouped Kubernetes views for all workloads
- Offering centralized dashboards for throughput, latency, CPU & memory
- Accelerating root-cause analysis with integrated alerts and application metrics
This ensures faster troubleshooting, reduced downtime, and a better developer experience.
Conclusion
With Prometheus Stack on Kubernetes, you gain powerful visibility into your cluster health, applications, and infrastructure. By combining Prometheus, Grafana, and Devtron, teams can:
- Monitor workloads proactively
- Detect anomalies faster
- Optimize resource usage and application performance
If you’re managing Kubernetes at scale, this observability stack is essential for achieving resilience and operational efficiency.
FAQ
What is Kubernetes monitoring and why is it essential?
Kubernetes monitoring involves collecting, visualizing, and analyzing metrics from pods, containers, services, and nodes to understand application performance and resource usage. It helps DevOps and SRE teams detect issues early, optimize workloads, and ensure high availability of services in complex, dynamic environments.
How do Prometheus and Grafana work together for Kubernetes monitoring?
Prometheus collects time-series metrics from Kubernetes clusters and stores them in its database, while Grafana visualizes these metrics through interactive dashboards. Together, they provide real-time insights, custom alerts, and deep observability into container performance, helping teams detect anomalies and take proactive actions.
How can I set up Kubernetes monitoring using Devtron?
You can set up Kubernetes monitoring in Devtron by first installing Grafana via the Stack Manager, then deploying Prometheus using the kube-prometheus-stack Helm chart. After installing required CRDs and configuring the Prometheus endpoint in Devtron, you’ll get real-time application metrics across your environments directly on the dashboard.
What metrics can Devtron display from Prometheus and how does it help?
Devtron can display resource usage, CPU/memory consumption, request throughput, and latency for every deployed application by integrating with Prometheus. This enables teams to track application performance, debug issues, and make data-driven scaling decisions within a unified Kubernetes dashboard