Since organizations began migrating from building monolith applications to microservices, containerization technology has risen. With applications running on hundreds and thousands of containerized environments, an effective tool to manage and orchestrate those containers became essential.
Kubernetes (K8s) - an open-source container orchestration tool from Google—became popular with features that improved the deployment process of containerized applications. With its high flexibility and scalability features, Kubernetes has emerged as the leading container orchestration tool, and over 60% of companies have already adopted Kubernetes in 2022.
With more and more companies adopting containerization technology and Kubernetes clusters for deployment, it makes sense to implement CI/CD pipelines for delivering Kubernetes in an automated fashion. So in this article, we’ll cover:
- What is a CI/CD pipeline
- Why should you use CI/CD for Kubernetes
- Various stages of Kubernetes app delivery
- And automating CI/CD process using open source Devtron platform
What is a CI/CD pipeline
Continuous Integration and Continuous Deployment (CI/CD) pipeline represents an automatic workflow that continuously integrates code developed by software developers and deploys them into a target environment with less human intervention.
Power up your Cloud Native stack with Devtron
Deploy in days, not weeks. Achieve accelerated deployments for faster time to market.
Before CI/CD pipelines, developers manually took the code, built it into an application, and then deployed it into testing servers. On the approval from testers, developers would throw their code off the wall for the Ops team to deploy the code into production. The idea worked fine with monolithic applications when deployment frequency was once a couple of months.
But with the advent of microservices, developers started building smaller use cases faster and deployed them frequently. The process of manually handling the application after the code commit was repetitive, frustrating, and prone to errors.
This is when agile methodologies and DevOps principles flourished with CI/CD at its core. The idea is to build and ship incremental changes into production faster and more frequently. A CI/CD pipeline made the entire process automatic, and high-quality codes were shipped to production quickly and efficiently.
The two primary stages of a CI/CD pipeline
As the name itself suggest CI and CD, these are the two primary stages of end-to-end pipeline. Let's take a deeper look into both the aspects.
Continuous Integration or CI pipeline
CI is part of the development process. The central idea in this stage is to automatically build the software whenever new software is committed by developers. If developments happen every day, there should be a mechanism to build and test it every day. This is sometimes referred to as the build pipeline. The final application or artifact is then pushed to a repository after multiple tests.

Continuous Deployment or CD pipeline
Continuous deployment (sometimes also called Continuous Delivery even though they mean different things - see note below) stage refers to pulling the artifact from the repository and deploying it frequently and safely. A CD pipeline is used to automate the deployment of applications into the test, staging, and production environments with less human intervention.

Note: Another term people use interchangeably when referring to Continuous Deployment is Continuous Delivery, but they’re different. As per the book Continuous Delivery: Reliable Software Releases Through Build, Test, and Deployment Automation by David Farley and Jez Humble, it’s the process of releasing changes of all types—including new features, configuration changes, bug fixes and experiments—into production, or into the hands of users, safely and quickly in a sustainable way.
Scale Your Startup, Not Your DevOps Budget
Deploy in days, not weeks. Achieve accelerated deployments for faster time to market.
Continuous Delivery comprises the entire software delivery process, i.e., continuously planning, building, testing, and releasing software to the market. It’s assumed that continuous integration and continuous deployment are the two parts of it.
There are many different CD tools available today. Some were created before Docker containers and Kubernetes existed. Some are much newer and highly aligned with cloud-native and containerized Kubernetes deployments.
Now, let us discuss why to use CI/CD pipelines for Kubernetes applications.
Benefits of using a CI/CD pipeline for Kubernetes
By using a CI/CD pipeline for Kubernetes, one can reap several crucial benefits:
Reliable & cheaper deployments
A CI/CD pipeline deploying on Kubernetes facilitates the controlled release of the software, as DevOps Engineers can set up staged releases, like blue-green deployments and canary deployments. This helps achieve zero downtime during release and reduces the risk of releasing the application to all users simultaneously. Automating the entire SDLC (Software DevelopmentLifecycle) using a CI/CD pipeline aids in lowering costs by cutting many fixed costs associated with the release process.
Faster releases
Release cycles that used to take weeks and months to complete have significantly come down to days by implementing CI/CD workflows. In fact, some organizations even deploy multiple times a day. Developers and Ops team can work together as a team with CI/CD pipeline and quickly resolve bottlenecks in the release process, including re-works that used to delay releases. With automated workflows, the team can release apps frequently and quickly without getting burnt out.
High-quality products
One of the major benefits of implementing a CI/CD pipeline is that it helps to integrate testing continuously throughout the SDLC. You can configure the pipelines to stop proceeding to the next stage if certain conditions are not met, such as failing the deployment pipeline if the artifact has not passed functional or security scanning tests. Due to this, issues are detected early, and the chances of having bugs in the production environment become slim. This ensures that quality is built into the products from the beginning itself and the end users get better products.
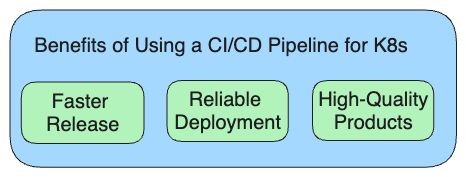
Fig C illustrates the benefits of implementing CI/CD pipelines.
Now, let’s dive deeper into various stages of Kubernetes app delivery, which can be made a part of the CI/CD pipeline.
Stages of Kubernetes app delivery
Below are the different stages involved in a CI/CD pipeline of Kubernetes and cloud-native application delivery, and the tools developers and DevOps teams use at each stage.
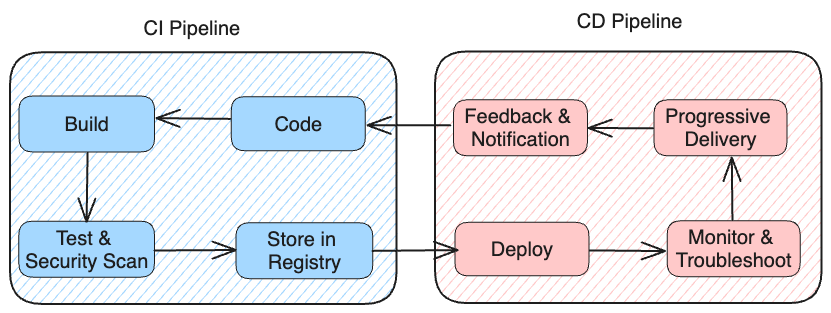
Code
Process: Coding is the stage where developers write codes for applications. Once new source code it written, it’s pushed into central storage on a remote repository (typically some version of git), where application code and configurations are stored. It’s a shared repository among developers, and they continuously integrate code changes in the repository, mostly daily. These changes in the code repository trigger the CI pipeline.
Tools: GitHub, GitLab, BitBucket (many tools provide git repositories)
Build
Process: Once changes are made in the application code repository, it’s then packaged into a single executable file called an artifact. This allows flexibility in moving the file around until it’s deployed. The process of packaging the application and creating an artifact is called building. The built artifact is then made into a container image (often a Docker container or Docker image) that would be deployed on Kubernetes clusters.
Tools: Maven, Gradle, Jenkins, Dockerfile, Buildpacks, Devtron
The build process (continuous integration) is easy with Devtron.
Test
Process: Once the container image is built, the DevOps team will ensure it undergoes multiple functional tests such as unit tests, integration tests, and smoke tests. Unit tests ensure small pieces of codes (units), like functions, are working properly. Integration tests look for how different components of codes, like different modules, are holding up together as a group. Smoke tests check if the build is stable enough to proceed.
After the functional tests are done, there will be another sub-stage for testing and verifying security vulnerabilities. DevSecOps would execute two types of security tests i.e. Static application security testing (SAST) and dynamic application security testing (DAST) to detect problems such as container images containing vulnerable packages.
After passing all the functional and security tests, the image is stored in a container image repo (aka. container registry).
Tools: JUnit, Selenium, Claire, SonarQube, Devtron
All the above steps make up the CI or build pipeline.
Deploy
Process: In the deployment stage, a container image is pulled from the registry and deployed into a Kubernetes cluster running in testing, pre-production, or production environments. These environments can be running in major cloud providers (like AWS, Azure, or GCP) or on-premises in a private data center. Deploying the image into production is also called a release and the application will then be available for the end users.
Unlike VM-based monolithic apps, deployment is the most challenging part in Kubernetes because of the following reasons:
- Developers and DevOps engineers have to handle many Kubernetes resources for successful deployment.
- As there are various deployment methods, such as declarative manifest files and HELM charts, enterprises rarely follow a standardized way to deploy their applications.
- Multiple deployments of large distributed systems every day can be really frustrating work.
Tools: Kubectl, Helm Charts, Devtron
Here is a blog that explains how you can deploy using helm charts.
For interested users, we’ll show the steps involved in the simple process of deploying an NGINX image into K8s. (Feel free to skip the working example.)
Deploying Nginx in Kubernetes cluster (working example)
Before deploying, you must create resource files in K8s so your application will run in containers. And there are many resources, such as Deployments, ReplicaSets, StatefulSet, Daemonset, Services, Configmap, and many other custom resources.
We’ll look at how to deploy into Kubernetes with the bare minimum resources or manifest files: Deployment and Service. A Deployment workload resource provides declarative updates and describes the desired state, like replication and scaling of pods. A Service in Kubernetes uses the IP addresses of the Pods to load balance traffic to the pod replicas.
For testing this, you should have a K8s cluster running on a server or locally using Minikube or Kubeadm. Now, let’s deploy Nginx to a Kubernetes cluster.
The Deployment YAML file for Nginx—let’s name it nginx-deployment.yaml—would look like this:
apiVersion: apps/v1
kind: Deployment
metadata:
 name: nginx-deployment
 labels:
   app: nginx
spec:
 replicas: 10
 selector:
   matchLabels:
     app: nginx
 template:
   metadata:
     labels:
       app: nginx
   spec:
     containers:
     - name: nginx
       image: nginx
       ports:
       - containerPort: 80
The Deployment file specifies the container image (which is nginx), declares the desired number of Pods (10), and sets the container port to 80.
Now, create a Service file with the name nginx-service.yaml and paste the below code:
apiVersion: v1
kind: Service
metadata:
  name: nginx-service
spec:
  selector:
	app: nginx
  ports:
  - name: http
	port: 80
	targetPort: 80
  type: ClusterIP
Once you configure the manifest files, deploy them using the following commands:
kubectl apply -f nginx-deployment.yaml
kubectl apply -f nginx-service.yaml
The code will deploy the Nginx server and make it accessible from outside the cluster. You can see the Pods by running the following command:
kubectl get pods
Also, you can run the following command and get the service’s IP address to access Ngnix from a browser.
kubectl get svc
If you have noticed there are multiple steps and configurations one needs to perform while deploying an application. Just imagine the drudgery of the DevOps team when they are tasked to deploy multiple applications into multi clusters every day.
Monitoring, Health-check, and Troubleshooting
Process: After the deployment, it’s extremely important to monitor the health of new Pods in a K8s cluster. The Ops team may manually log into a cluster and use commands, such as kubectl get pods or kubectl describe deployment, to determine the health of newly deployed Pods in a cluster or a namespace. Ops teams may use monitoring and logging tools to understand the performance and behavior of pods and clusters.
To troubleshoot and find issues, matured Kubernetes users will use advanced mechanisms like Probes. There are three kinds of probes: liveness probes to ensure an application is running, readiness probes to ensure the application is ready to accept traffic, and startup probes to ensure an application or a service running on a Pod has completely started. Although there are many commands and ways, it can be very difficult for developers or Ops teams to troubleshoot and detect an error because of poor visibility of a lot of components inside a cluster (node, pod, controller, security & deployment objects, etc.).
Tools: AppDynamics, Dynatrace, Prometheus, Splunk, kubectl
Progressive Delivery & Rollback
Process: People use advanced deployment strategies like blue-green and canary to roll out their application gradually and avoid degradation to customer experience. This is also known as progressive delivery. The idea is to allow a small portion of traffic to the newly deployed pods and perform quality and performance regression. And if the newly deployed application is healthy, then the DevOps team will gradually roll it forward. But in case there’s an issue in performance or quality, the Ops or SRE team instantly rollback the application to its older version to ensure there’s a zero-downtime release process.
Tools: Kubectl, Kayenta, Devtron
Monitoring and rollback with Devtron.
Feedback & Notification
Process: Feedback is the heart of any CI/CD process because everybody should know what’s happening in the software delivery and deployment process. The best way to ensure effective feedback is to measure the efficacy of the CI/CD process and notify all the stakeholders in real time. In case of failures, it helps DevOps and SREs to quickly create incidents in service management tools for further resolution.
For example, project managers and business owners would be interested to know if a new feature has been successfully rolled out to the market. Similarly, DevOps would like to know the status of new deployments, clusters and pods, and SREs would like to be intimated about the health and performance of a new application deployed into production.
Tools: Slack, Discord, MS Teams, JIRA, and ServiceNow
Note: All the stages—Monitoring, Progressive Delivery, and Feedback & Notification—fall under Continuous Deployment.
Automate CI/CD process using open-source Devtron platform
If you’re a large or mid-enterprise with tens or hundreds of microservices based on Kubernetes, then you need to serialize your delivery (CI/CD) process using pipelines. You can start using Devtron's open-sourceDevOps platform. It’s Kubernetes-native and is used by top companies such as Delhivery and BharatPe, to orchestrate the entire software delivery value chain on Kubernetes. Devtron platform helps developers and ops team to setup CI/CD pipeline for Kubernetes app delivery in 3 minutes. It also provides a single pane dashboard from CI, CD, GitOps (provided by Argo CD), observability, troubleshooting, security to governance, and everything in between.
Watch the video to see how easy CI/CD can be for Kubernetes with Devtron.
Get started with Devtron
You can visit Devtron’s GitHub page to begin your installation. To get started with deploying your Kubernetes apps, you can refer to our documentation. Join our dedicated discord community server for support and queries.


