Devtron, a Kubernetes management platform, has introduced the Kubernetes dashboard for easy Kubernetes application management from a UI. Various teams can get a single-plane visibility of all resources across clusters and can edit, deploy or troubleshoot them from the UI. Devtron's Kubernetes dashboard has three sub-modules:
- App management
- Cluster management
- HELM release management
Farewell, clunky CLI commands; welcome, efficient administration. A Kubernetes Dashboard brings transparency and convenience in your application workflows, with a simple-to-use interface for increased visibility and control.
This blog will discuss the Kubernetes dashboard for application management and how it brings immense value to the developer, DevOps, and SRE/Ops team in all organizations.
Challenges of application management in Kubernetes
With CI/CD and GitOps tools, numerous features, changes, or bug fixes are deployed into Kubernetes quickly and frequently (almost daily). With many features released into the various environments, checking the status of each application's health of pods across is a painstaking process. Here are a few challenges that bog down DevOps and SREs teams while managing applications after deployments.
Lack of holistic visibility of all the resources
Without a centralized tool, DevOps and SREs often don't know about all the resources, such as pods, Deployments, Statefulset, Services, Secrets, Configmaps, etc., deployed into a cluster. Ops teams often need a holistic understanding of resource consumption across multiple clusters to make decisions. Fetching information about all the Kubernetes objects across clusters and environments about their health and status can be time-taking.
Streamline Kubernetes app management with Devtron's feature-packed dashboard
- Unified Application Visibility: Devtron's dashboard offers a single view of all the applications running across different clusters, and it is simple for teams to monitor, deploy, and troubleshoot from one location.
- Intuitive User Interface: Devtron is designed for developers and operations teams alike with a simple-to-use UI that simplifies complicated Kubernetes operations and minimizes the need for complicated CLI commands.
- Integrated Helm Release Management: Integrate Helm charts directly within the dashboard for effortless application updates and rollbacks and enhance deployment flexibility.
Streamline your Kubernetes app management with Devtron's Kubernetes dashboard.
Schedule a Demo →Dependent on experts
Collaboration between teams (developers, Ops, and SREs) can only be possible with holistic information about clusters, app deployments, and resources. And various team members, such as developers, often depend on a particular person to fetch the data for decision-making.
Applying "kubectl" at scale is frustrating.
Using the kubectl command and fetching information about applications or pods in a cluster can be fun. But applying commands to check the status of new deployments or pod health is repetitive and frustrating for the Ops team. For environments where developers and testers would deploy an image and perform unit testing and system integration testing, carrying out pod operations such as health checks and troubleshooting is a context switch for developers. It often involves a learning curve; developers don't enjoy any part of it.
Devtron has launched the open-source Kubernetes dashboard for application management to overcome all these challenges.
Kubernetes dashboard for Application Management
Devtron Kubernetes dashboard is an open-source web interface to manage Kubernetes applications and cluster resources on-demand. Let us see all the features (watch the below video) of the Kubernetes dashboard for app management.
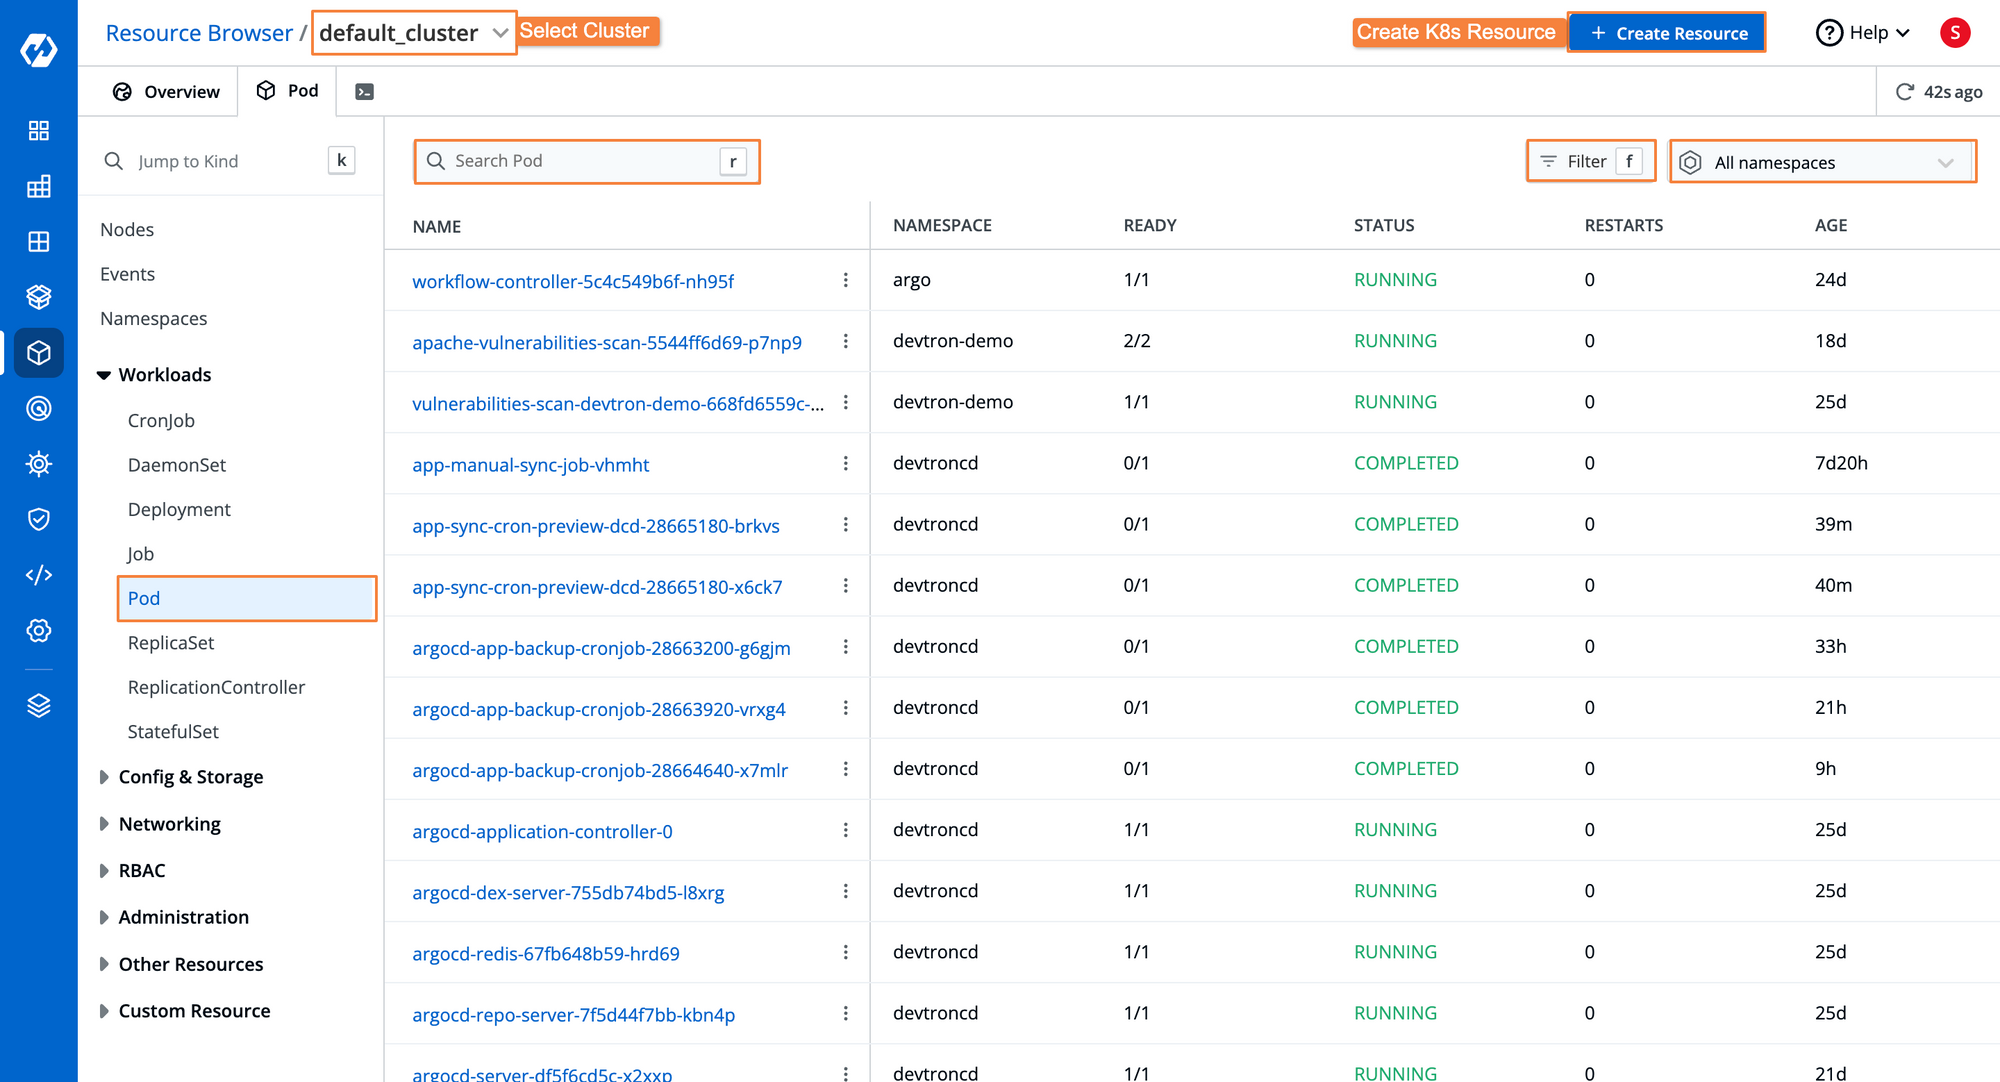
360° visibility of multiple clusters for informed decision making
Devtron Kubernetes dashboard allows users to see all the resources- grouped as workloads, Configmaps and storage, networking, RBAC, CRDs- in one plane. Developers and Ops leads can quickly visualize the resources deployed across clusters and make informed decisions like deleting a few obsolete pods to save cloud costs.
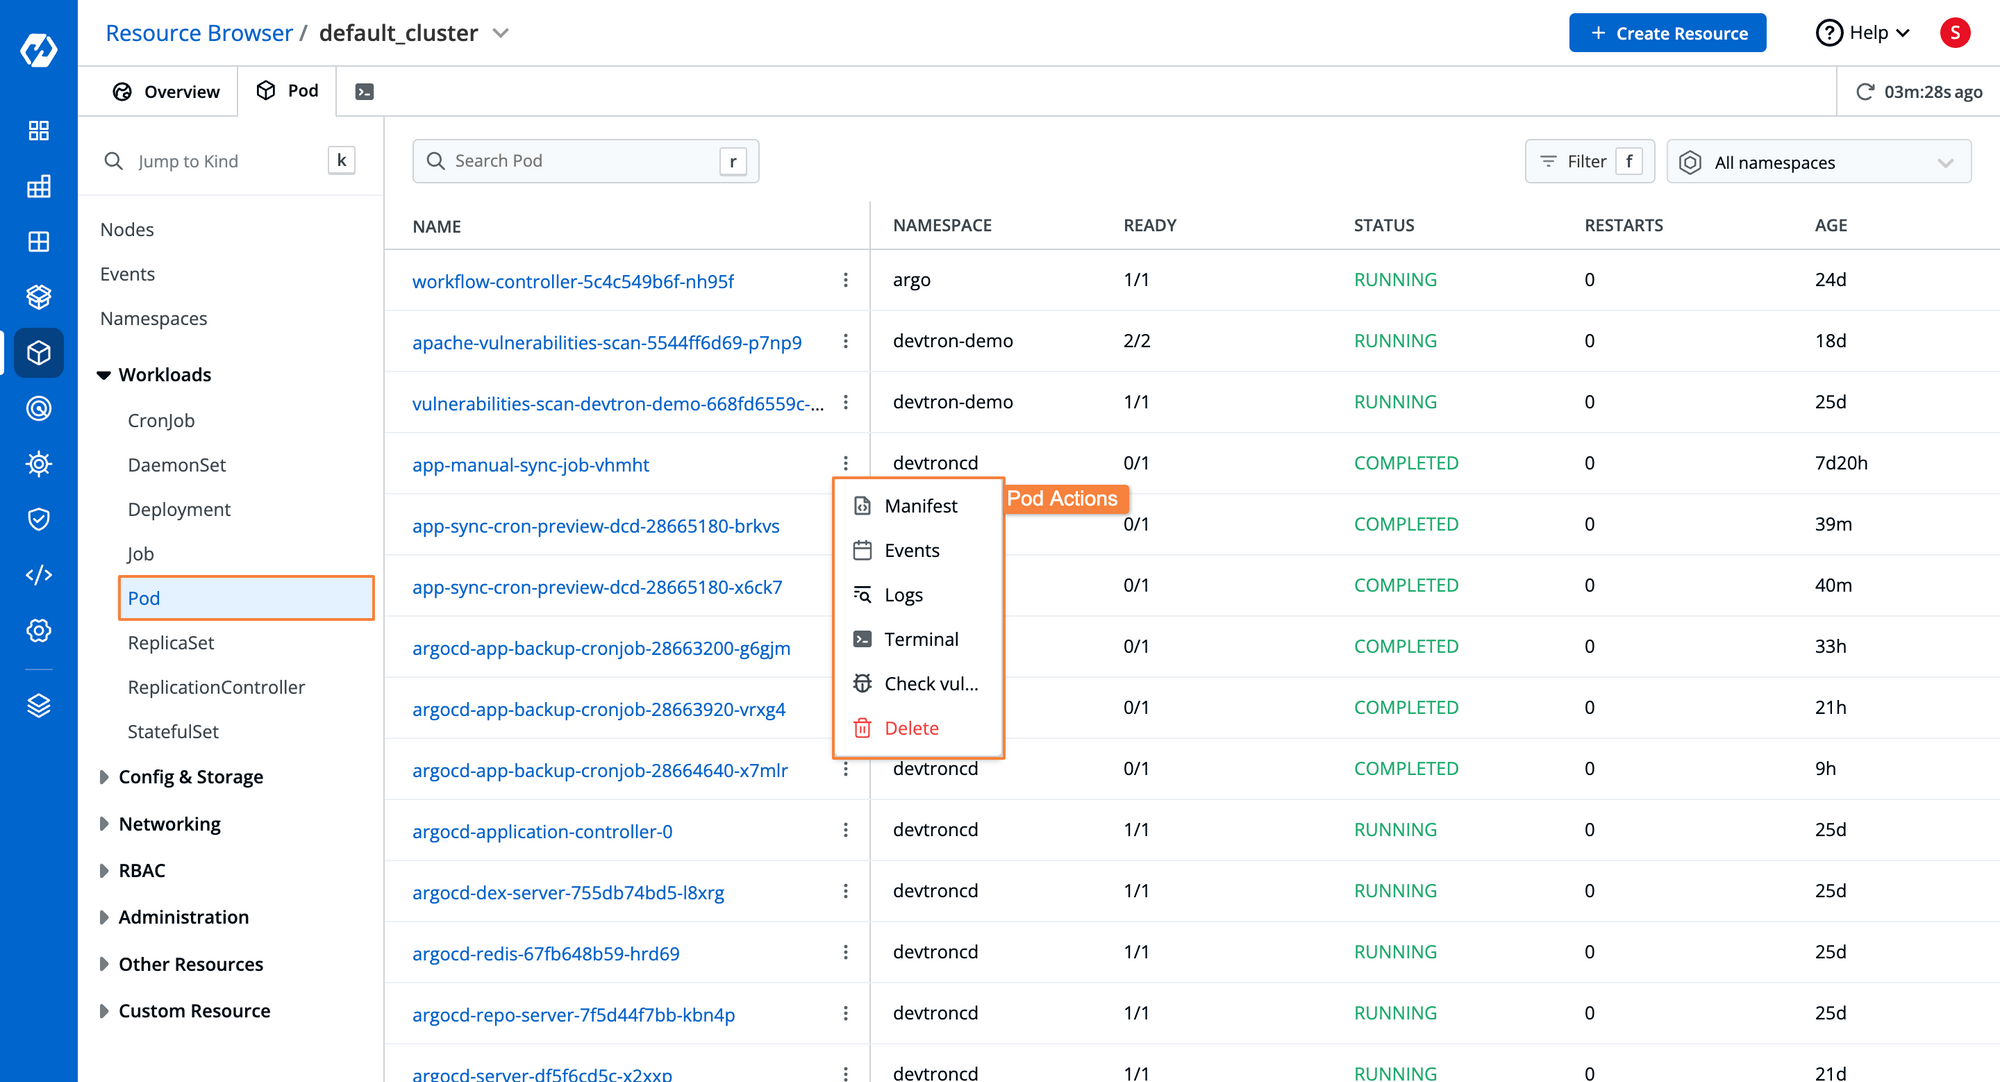
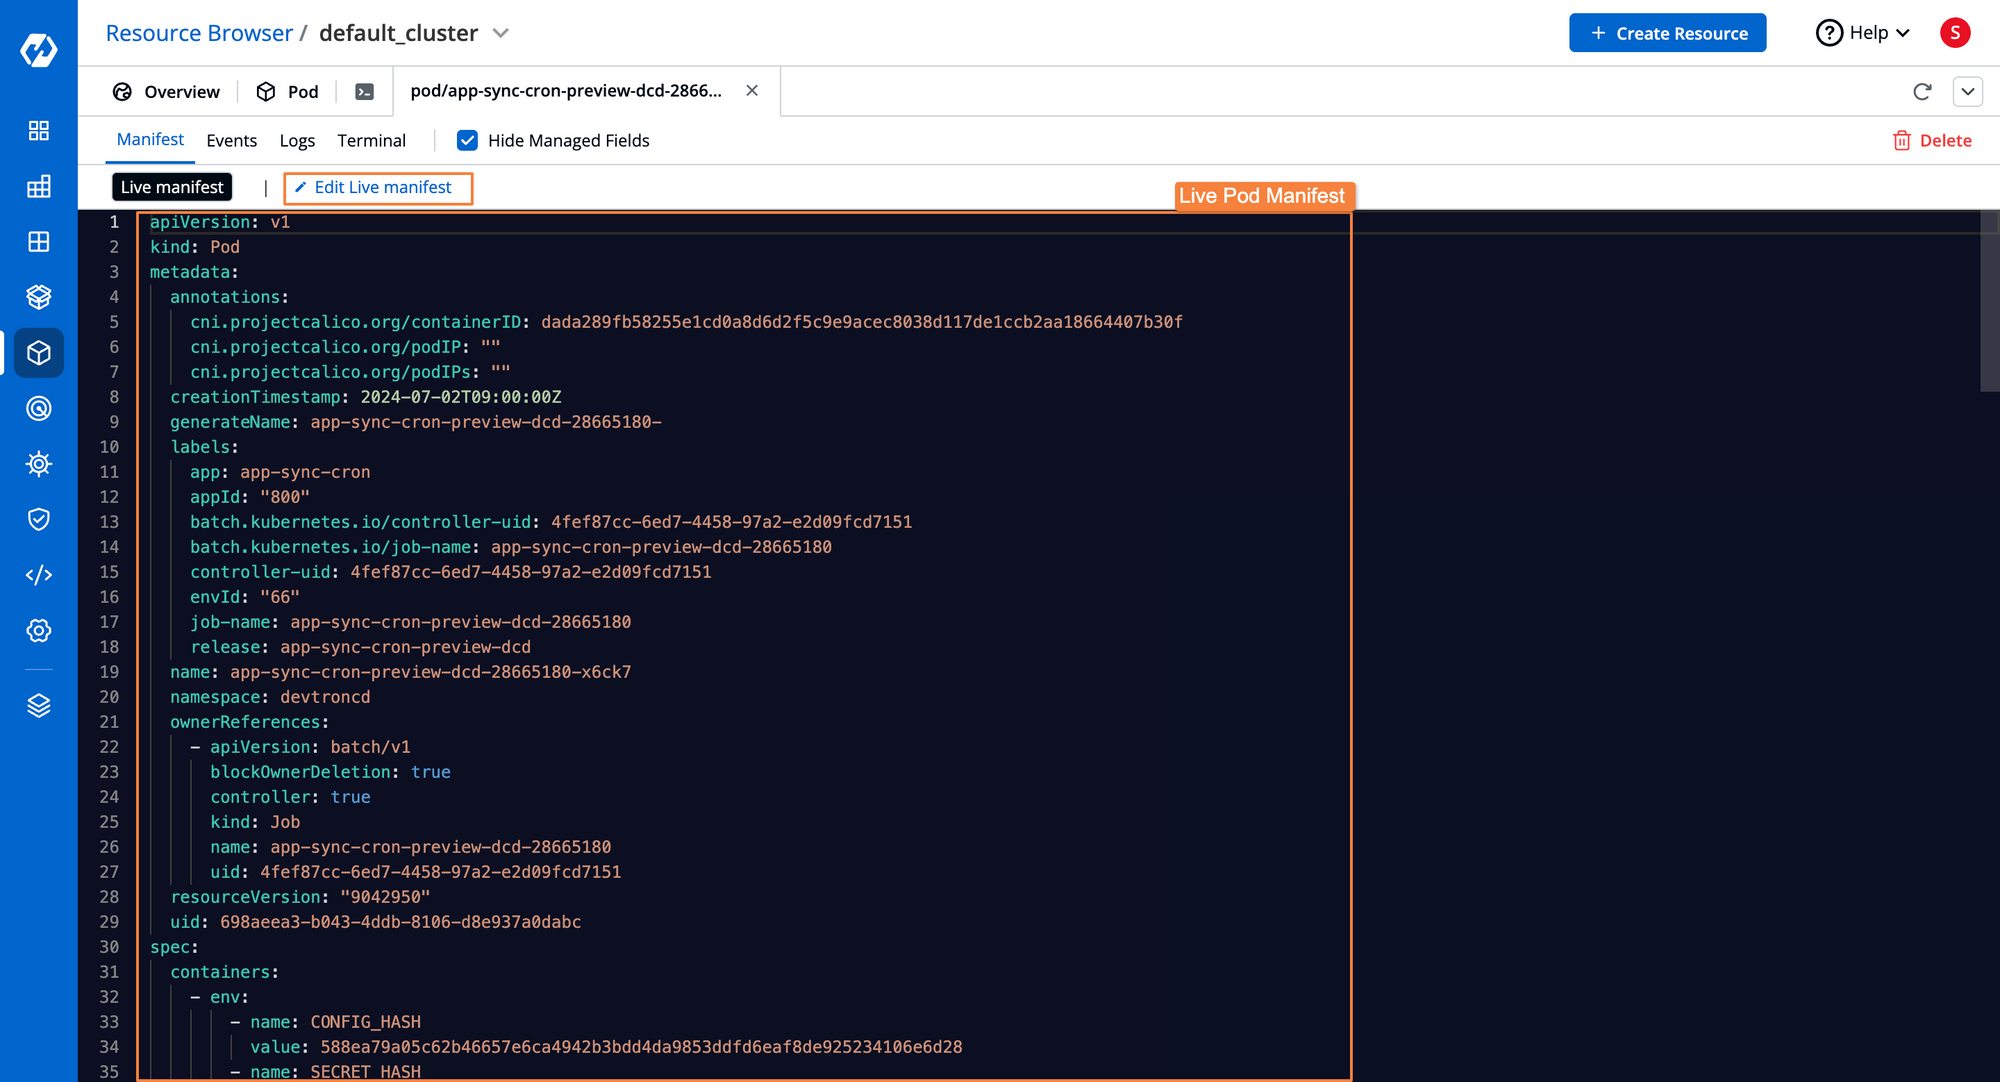
Granular visibility and control of resources
The ops team can drill down into each resource, say a pod, and find the granular details. They can visualize the manifest, events, and logs for each help. They can edit a manifest in the run-time and apply it from the UI. Like resource management, the Ops team can also visualize and modify namespaces in a cluster from the Kubernetes dashboard.
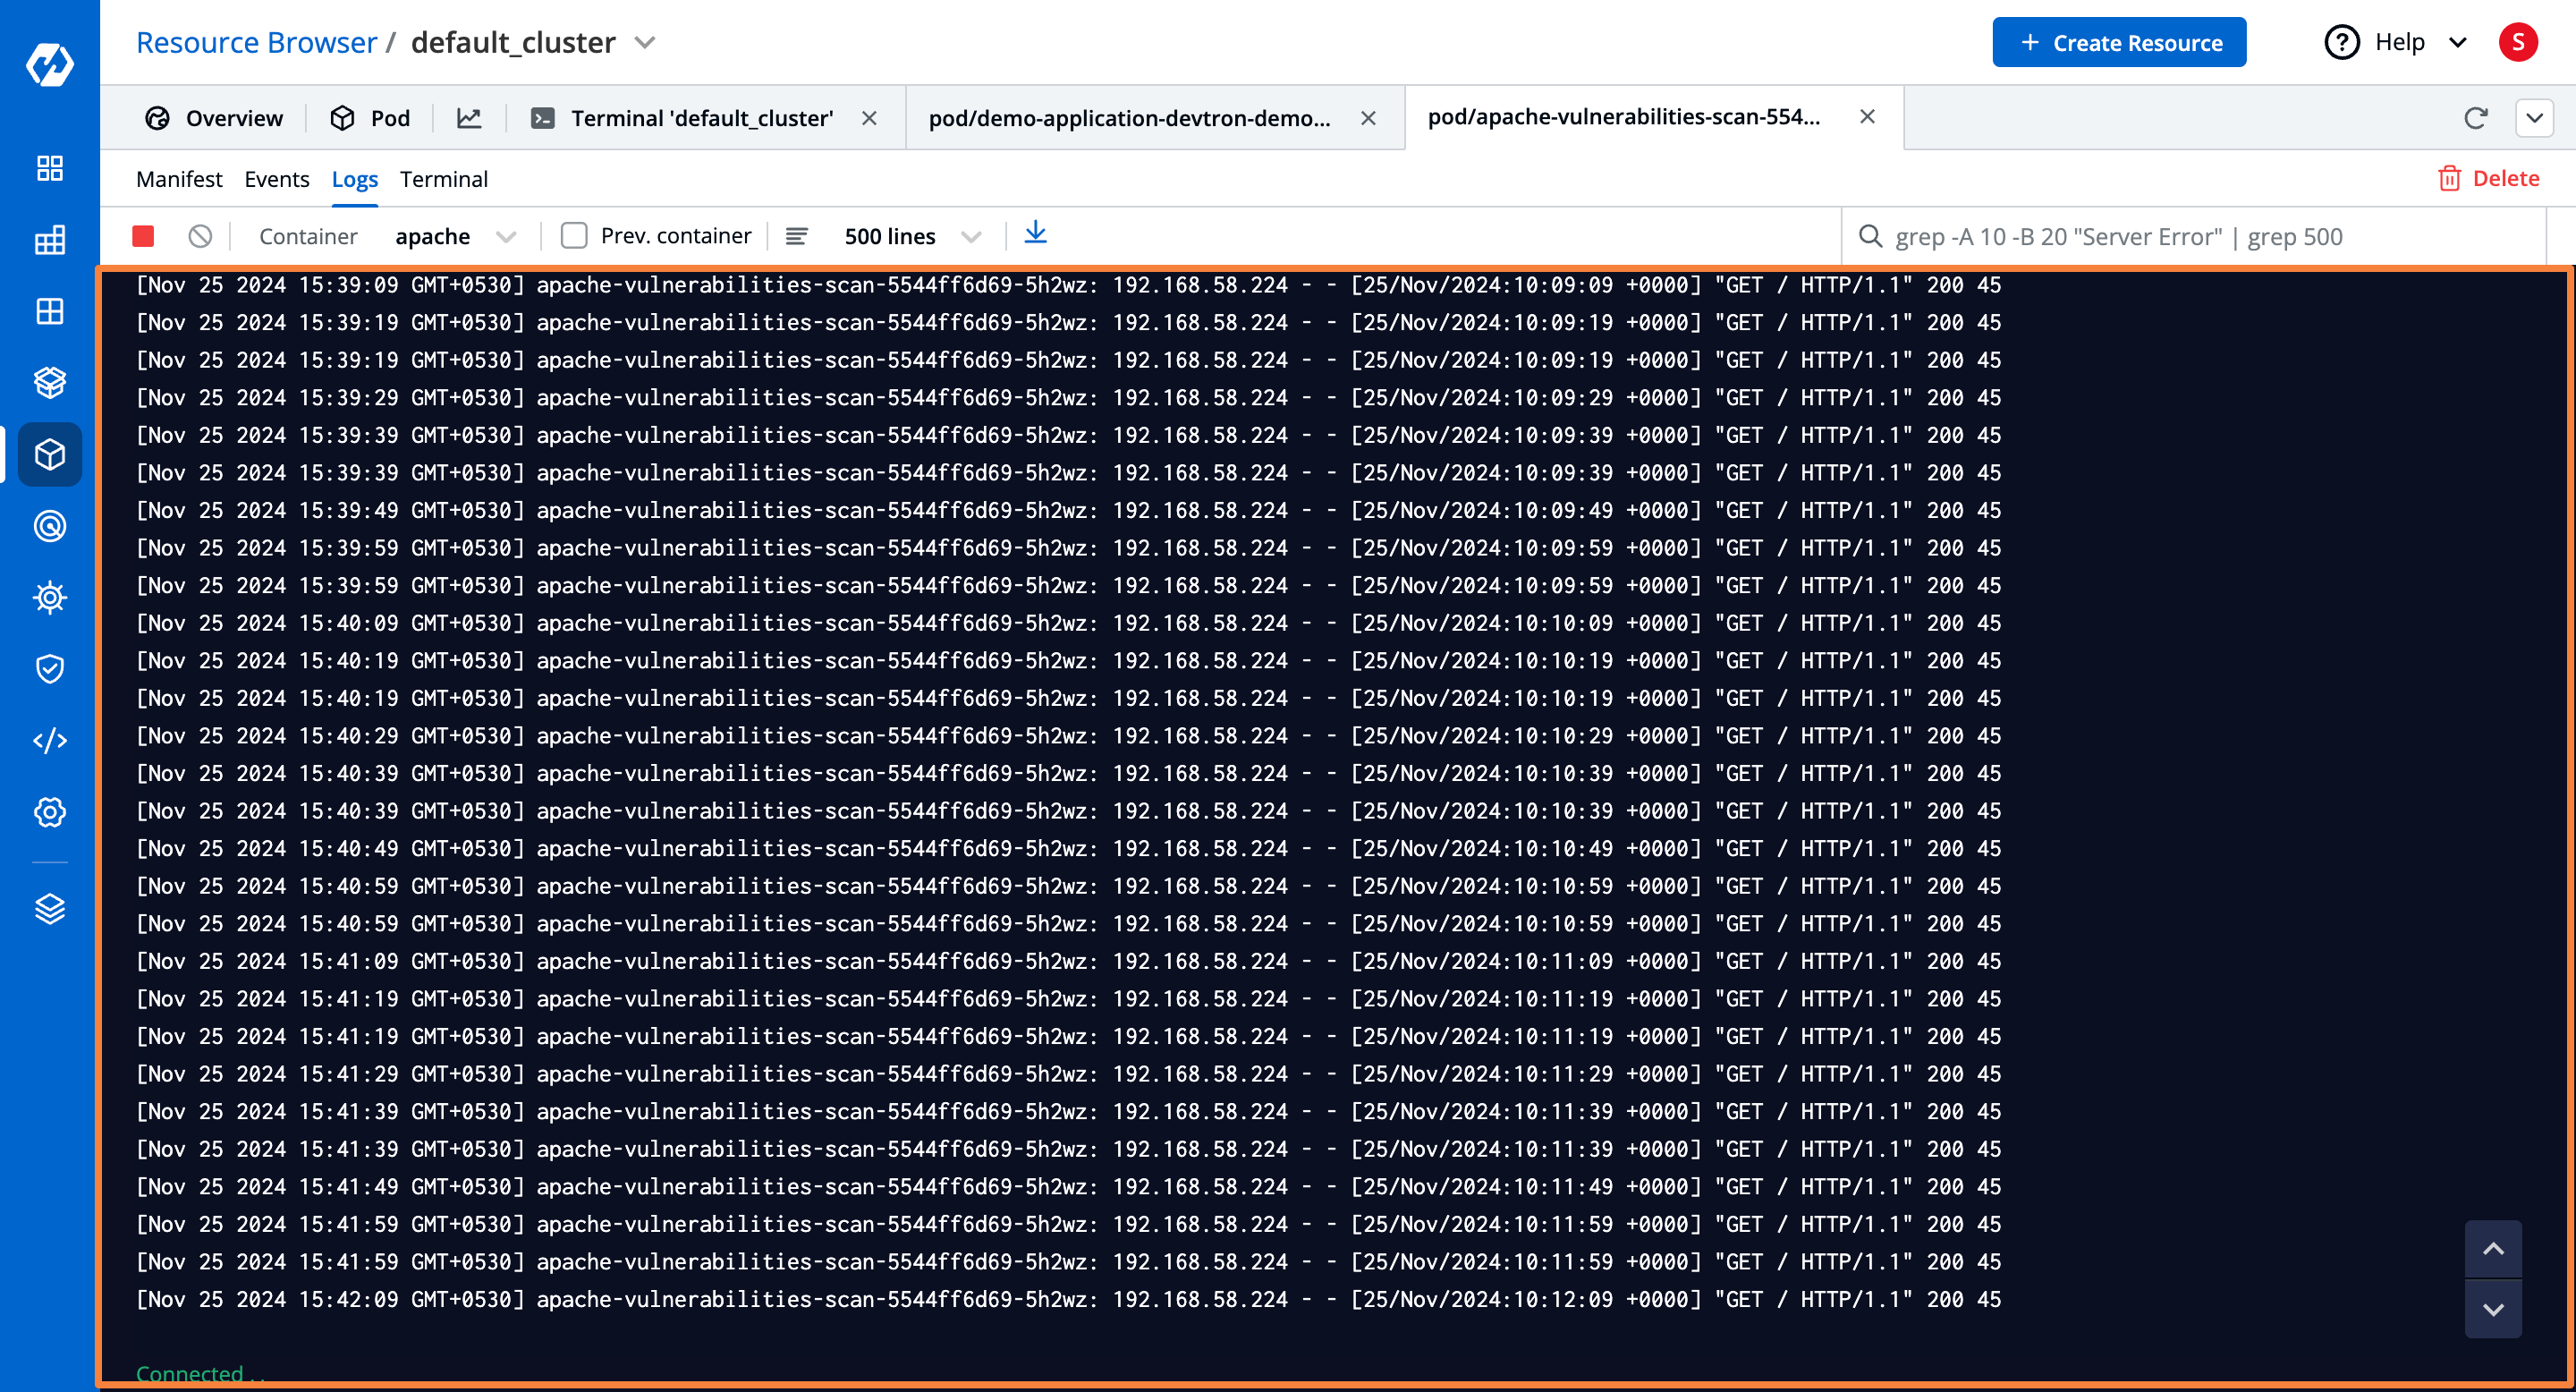
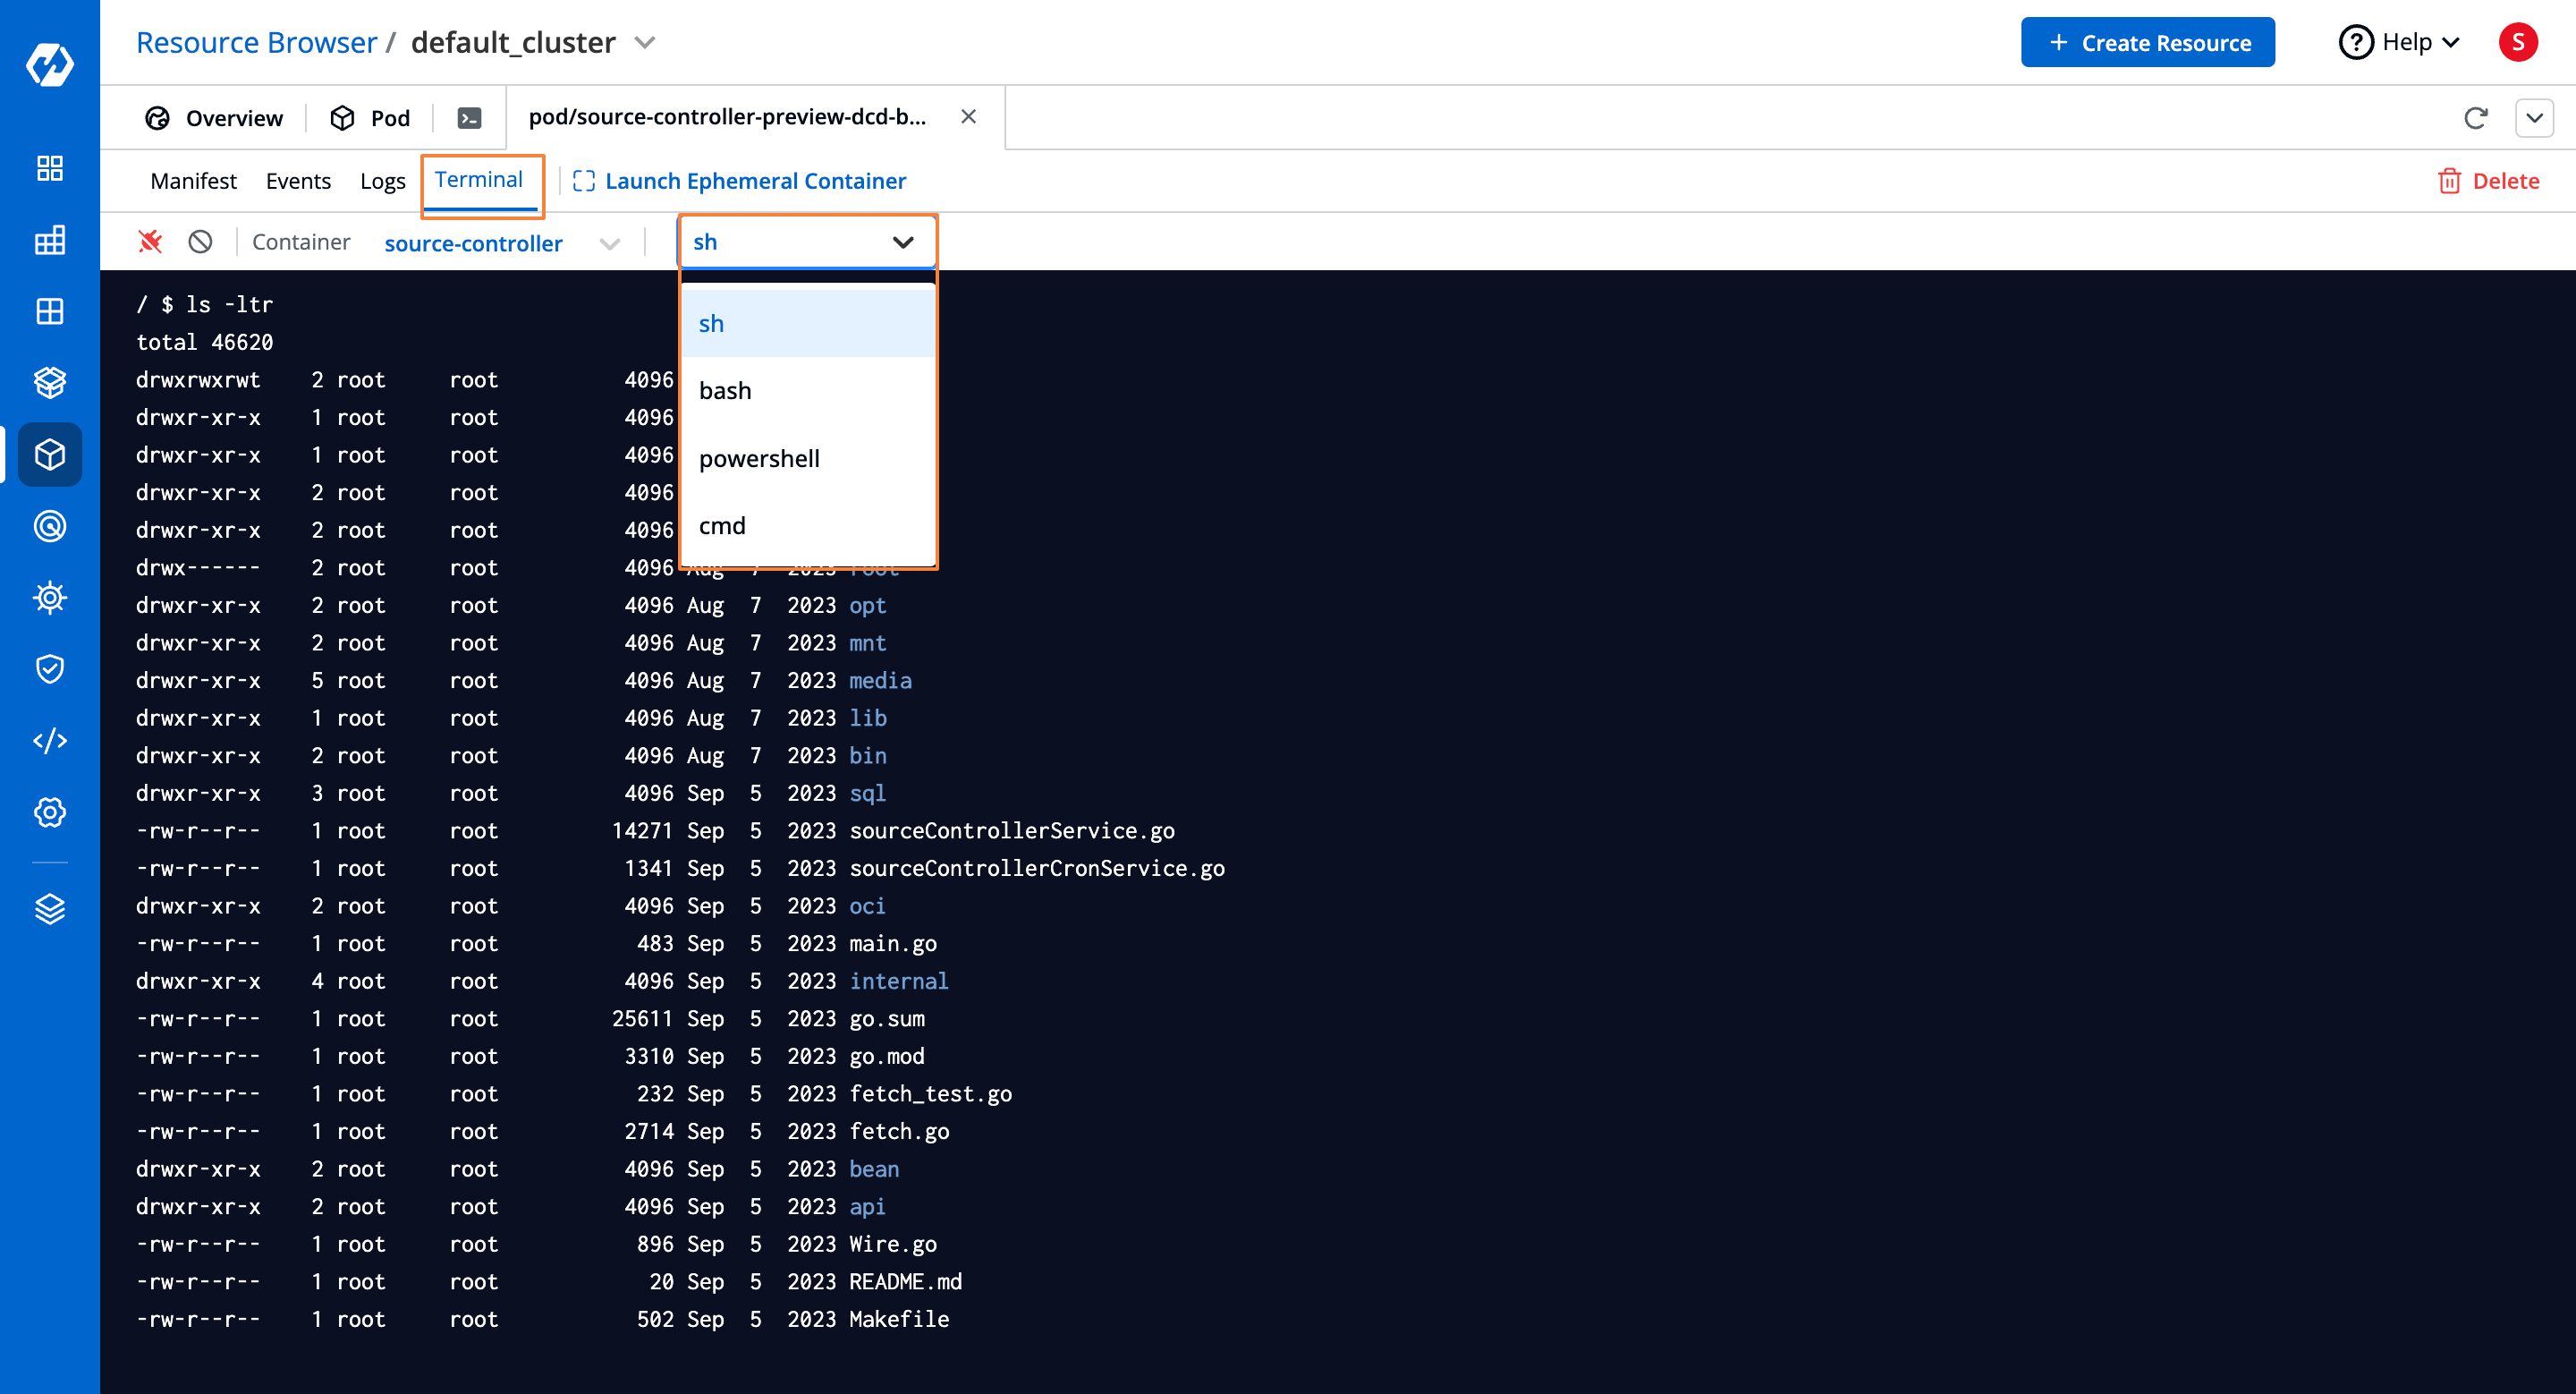
Troubleshooting with logs and terminal
Devtron dashboard allows users to choose a container for a resource to find the out logs. This helps understand the behavior of a resource and troubleshoot immediately in case an application is not working correctly. Devtron Kubernetes dashboard also allows the Ops team to use the terminal (ssh, bash, PowerShell) from the browser for troubleshooting.
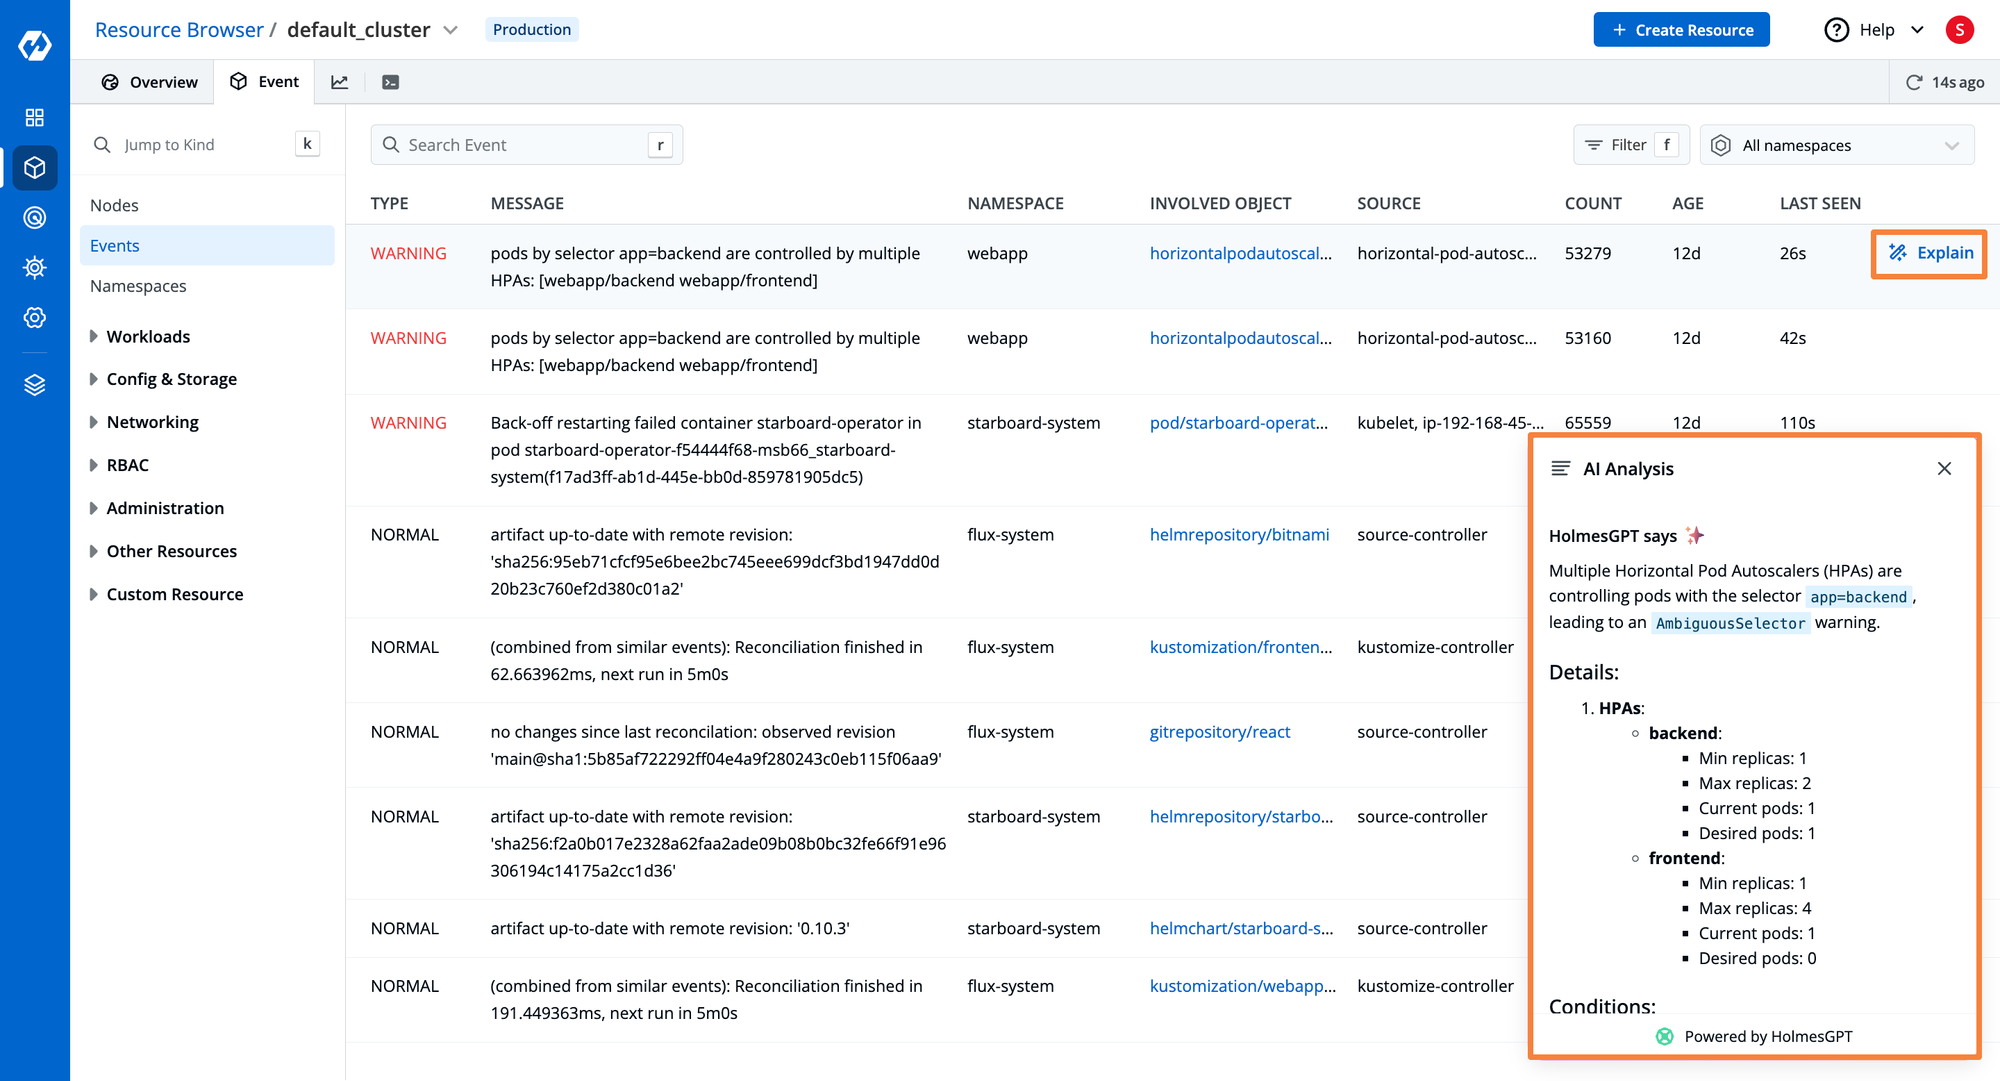
Troubleshooting with Cluster Events
Devtron's dashboard can create a centralized store of all the different events that have been generated in the cluster. These logs help provide useful information for debugging the various applications. Devtron has a built-in intelligence that can analyse the events, and give you actionable steps for solving the warning or error events.
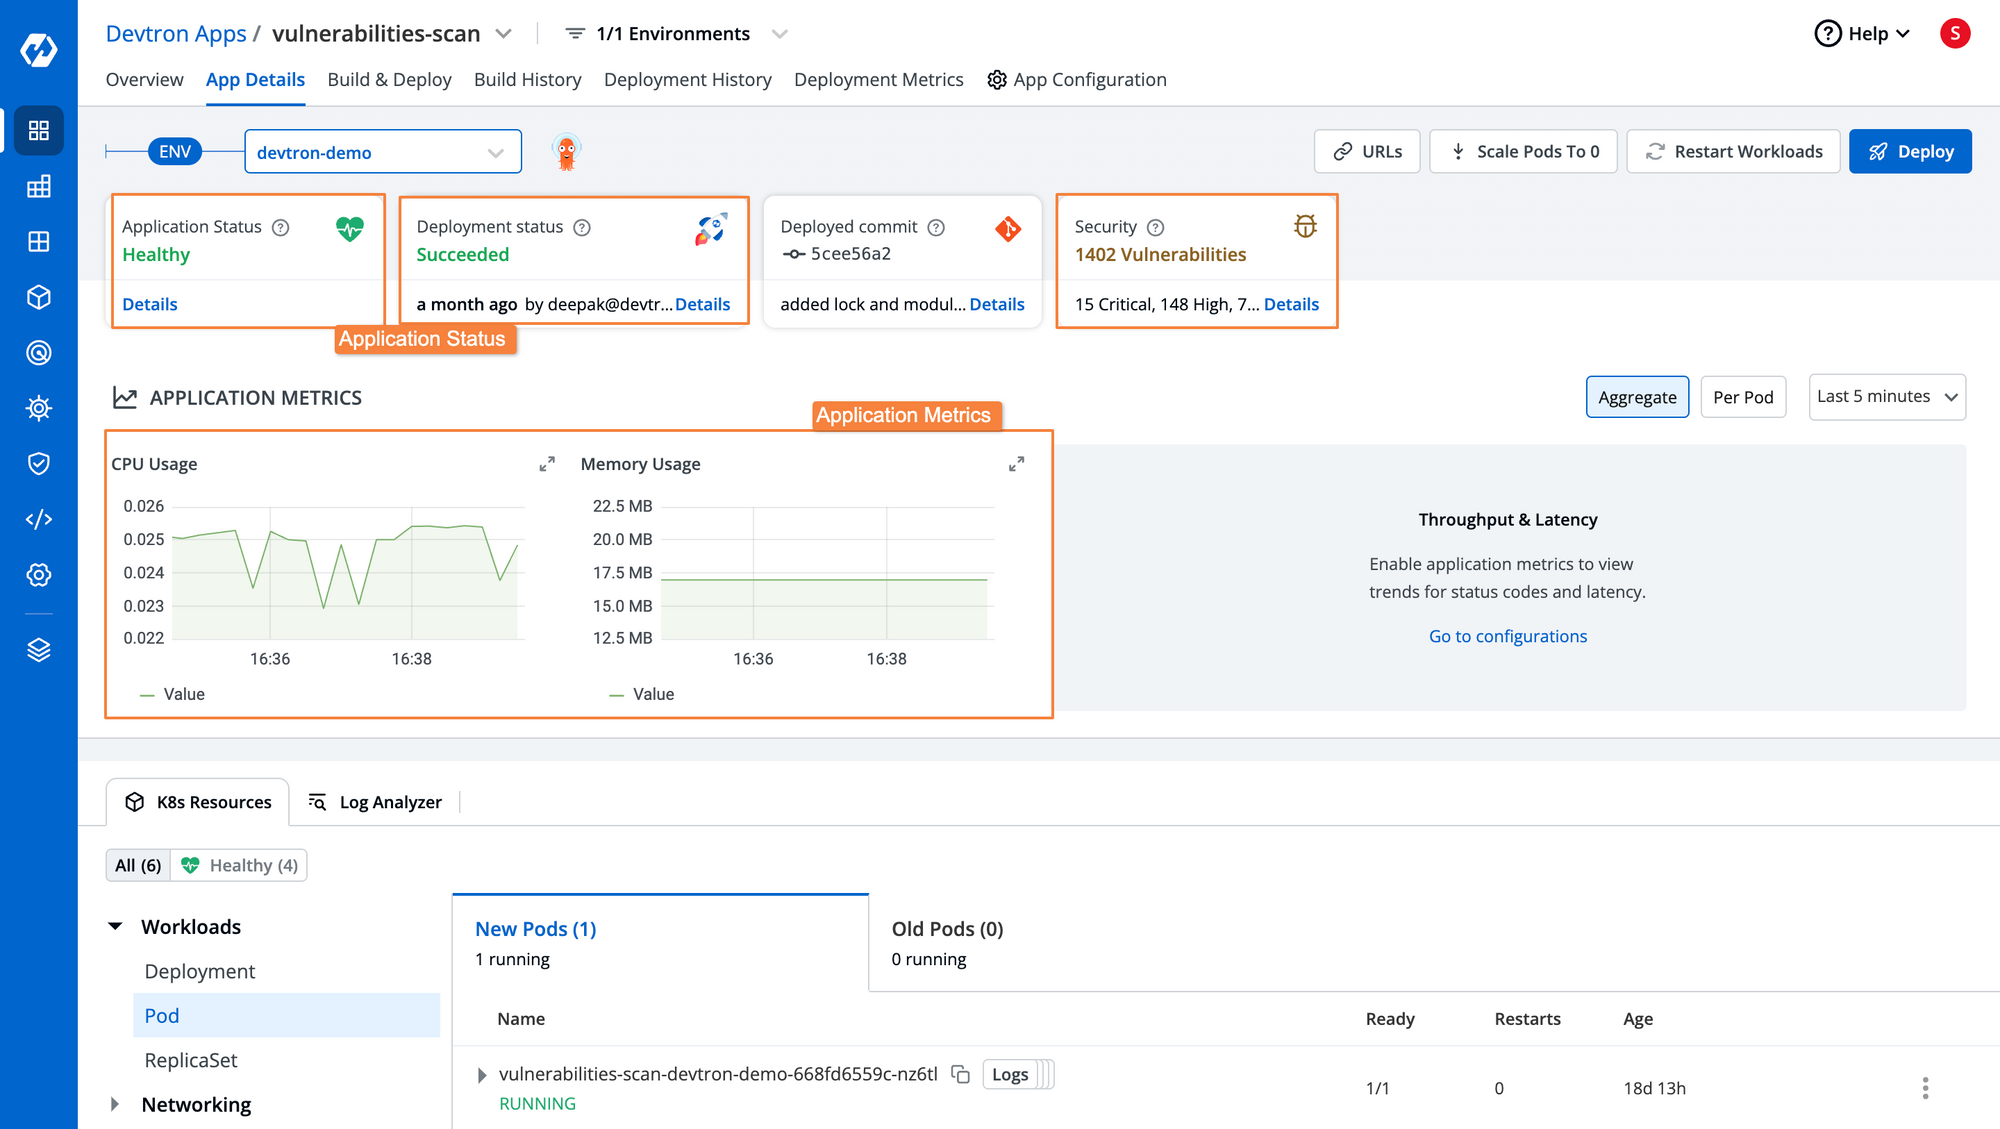
Application deployments health status
Since Devtron also provides CI/CD pipelines and GitOps workflows for deployments, the dashboard provides the health status of each application. The dashboard offers the golden metrics- CPU usage, memory usage, throughput, and latency- to measure performances of each resource category- workloads, networking, configmaps & storage, etc.
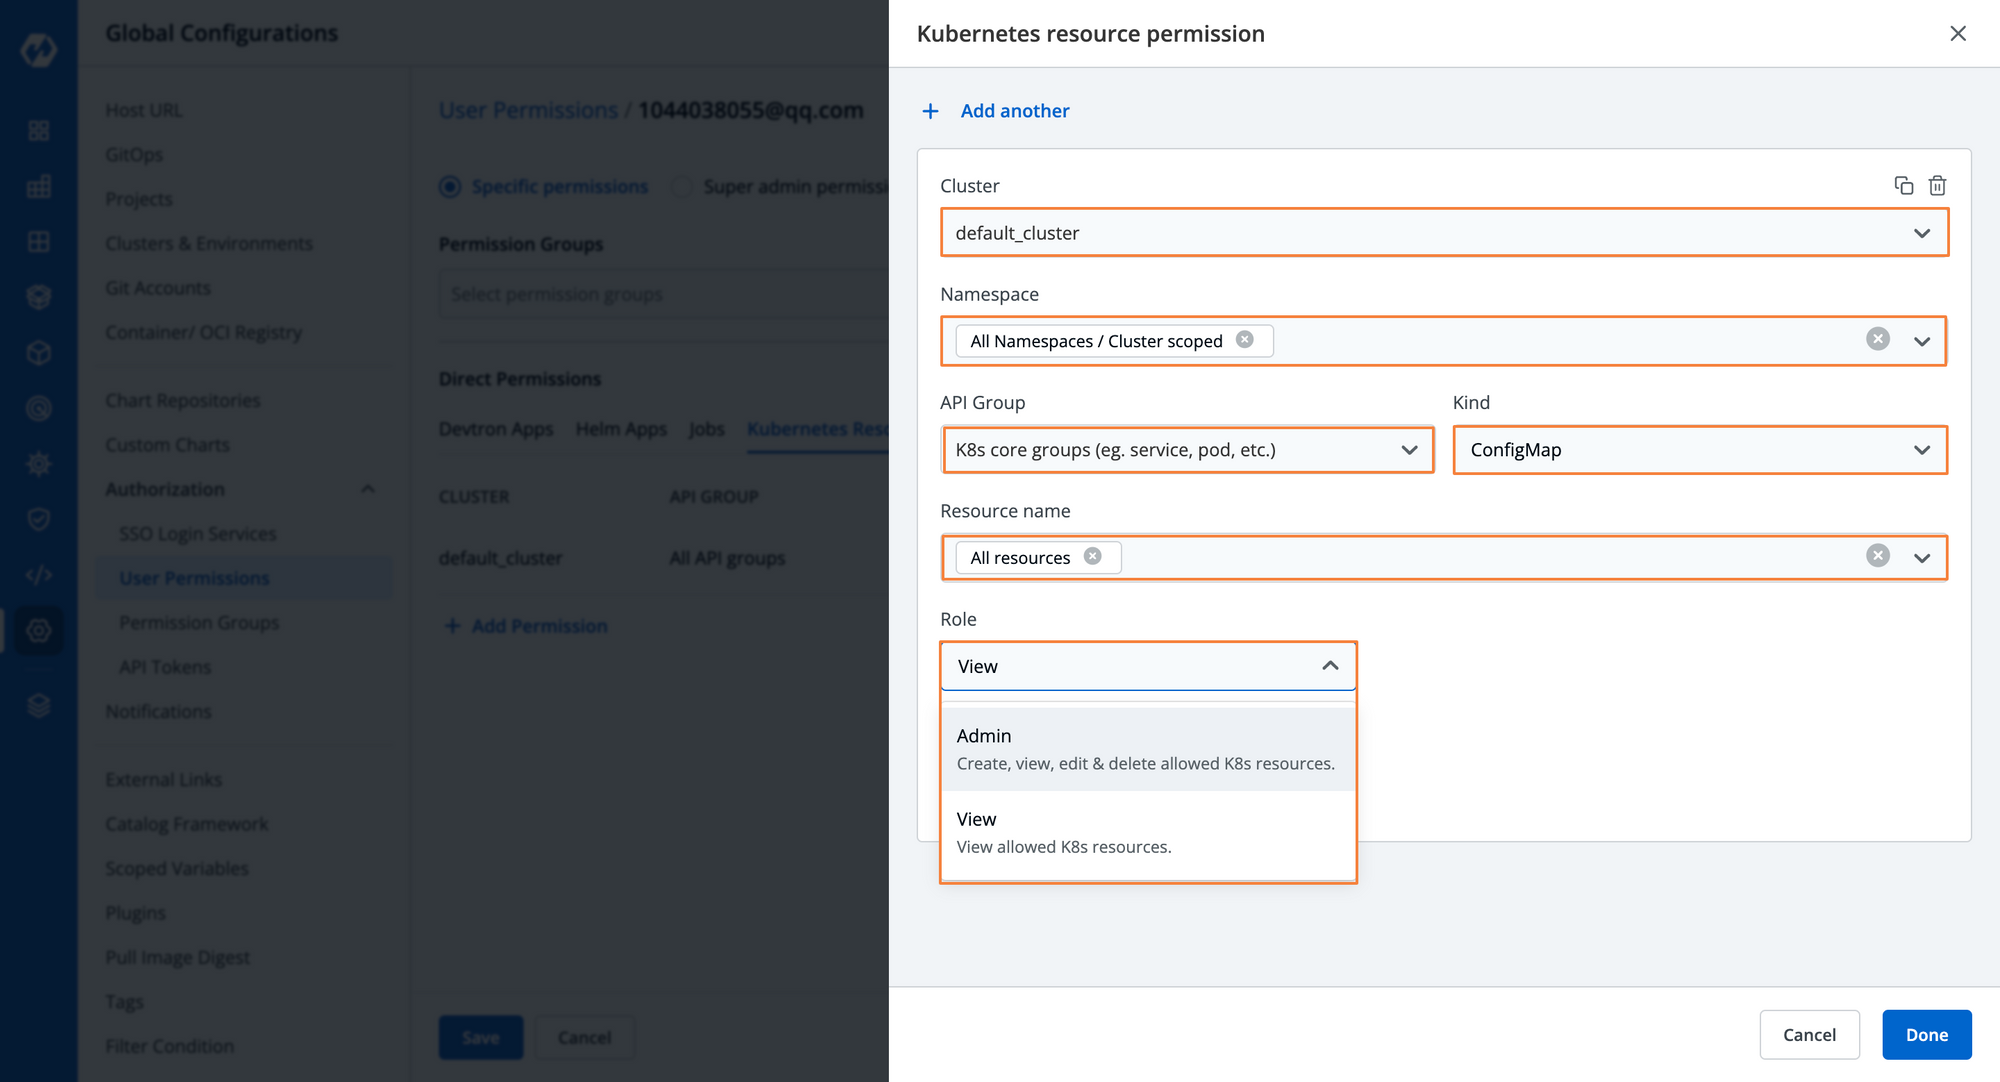
RBAC for least privilege on resources
Providing teams with the least privilege access to various resources is essential in large organizations. Devtron Kubernetes dashboard allows admins to provide actions such as view, edit, and delete to cluster and resource levels. Suppose you want to grant a developer the editing ability on dev-namespace and viewing ability to their respective application resources in prod-namespace. In that case, you can easily do that using the RBAC functionality of the Devtron Kubernetes dashboard.
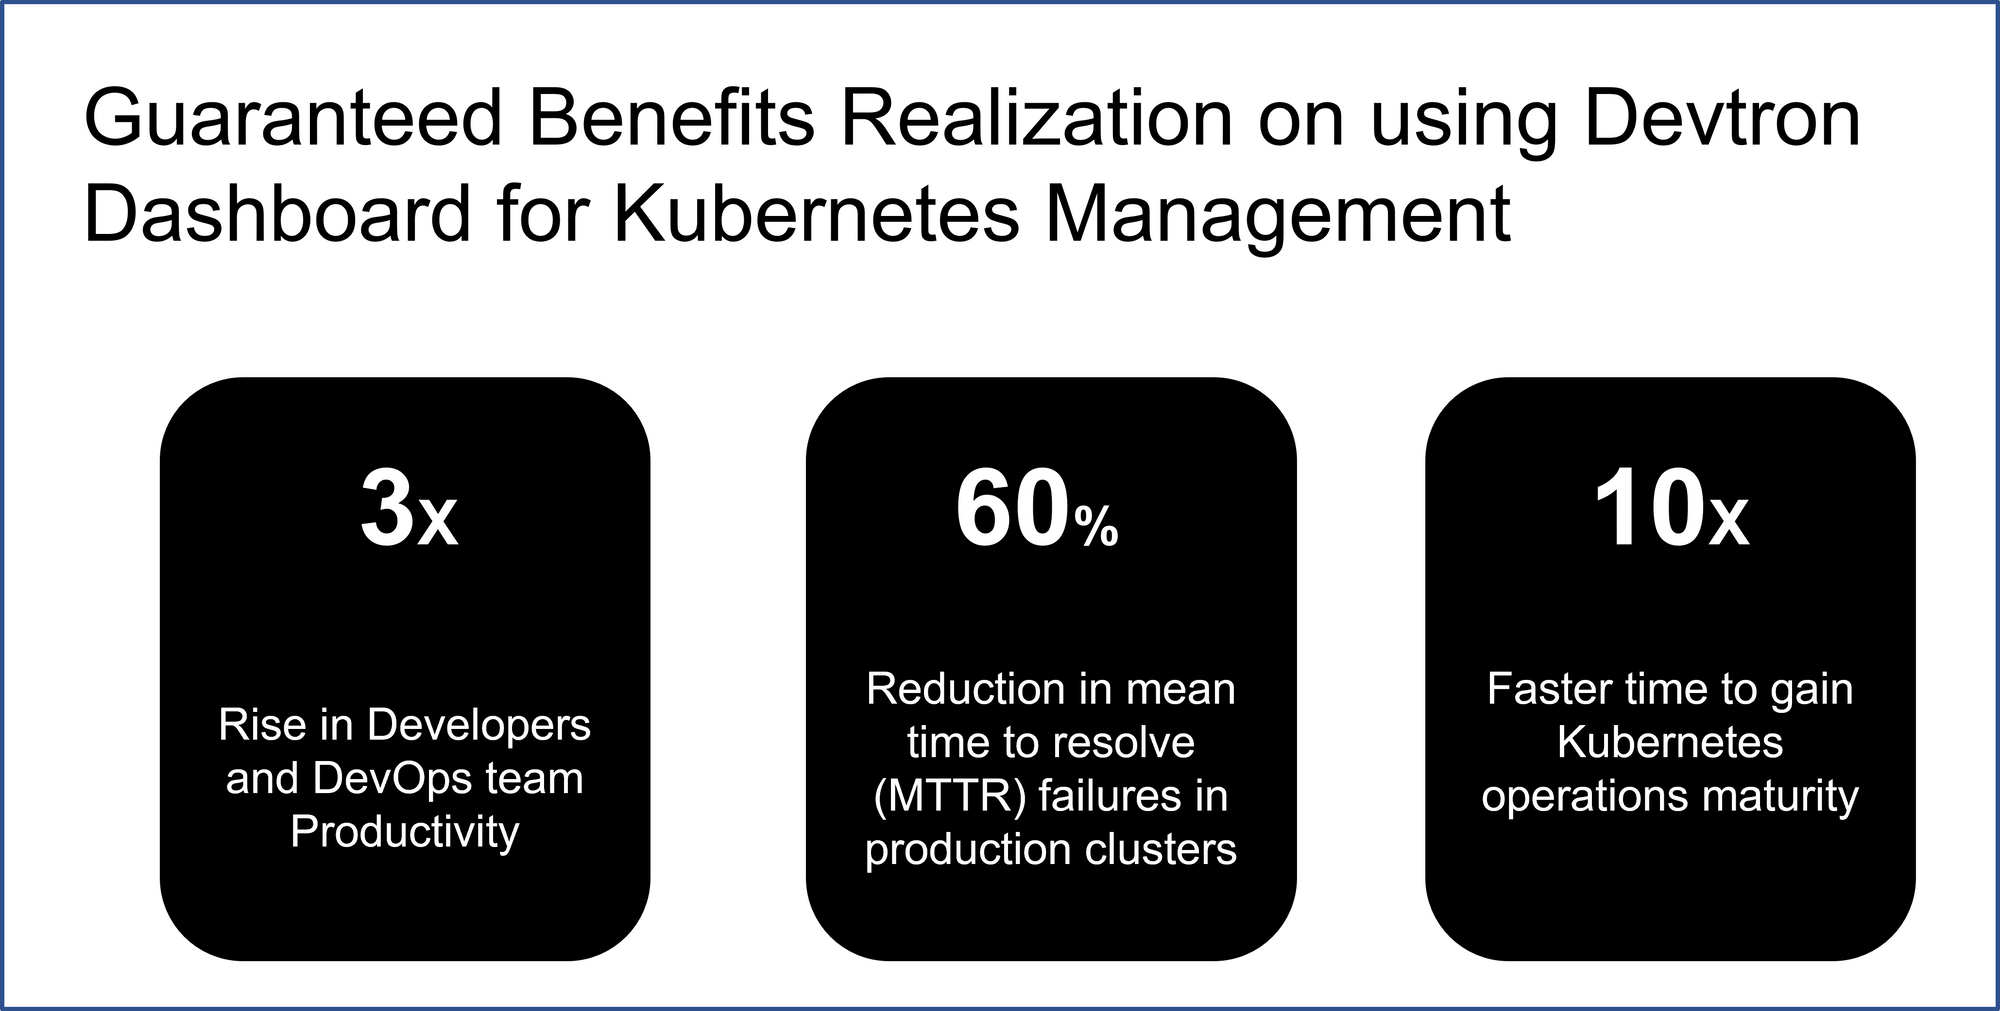
Guaranteed outcomes of Devtron Kubernetes dashboard
With the Kubernetes dashboard, you can improve developer and Ops team productivity and reduce mean time to resolve issues with central plane visibility and controls of all the resources across clusters.
Kubernetes Dashboard Ecosystem
Open source Devtron Kubernetes dashboard is available in different deployment options on-prem and managed. Recently Devtron has also released a desktop client version for the Kubernetes dashboard that would help you to manage Kubernetes resources and multi-clusters.
Try Devtron open-source Kubernetes dashboard for free.