Organizations are adopting Kubernetes for containerization at an unprecedented rate. The large-scale adoption of Kubernetes in such a short time has brought many inefficiencies and challenges to the software delivery process. Additionally, one of the major challenges organizations face is the complexity of managing and monitoring Kubernetes clusters which can lead to misconfigurations and poor resource utilization at scale. Lack of proper visibility into clusters makes troubleshooting and diagnosing problems difficult.
Kubernetes is a powerful and flexible container orchestration platform, but it can be challenging to navigate for beginners. The vanilla Kubernetes dashboard offers some solace but needs more depth to support developers and DevOps engineers operating hundreds of microservices.
At Devtron, we have unlocked the Kubernetes Dashboard to perform a higher level of functionality efficiently. Devtron’s Kubernetes Dashboard is a web-based tool that allows users to manage and monitor their Kubernetes resources across clusters.
2 Crucial Components Of the Dashboard
Devtron's Kubernetes Dashboard consist of two main components which can help teams elevate their Kubernetes experience. Let's understand what these two components are.
1. The Helm Kubernetes Dashboard
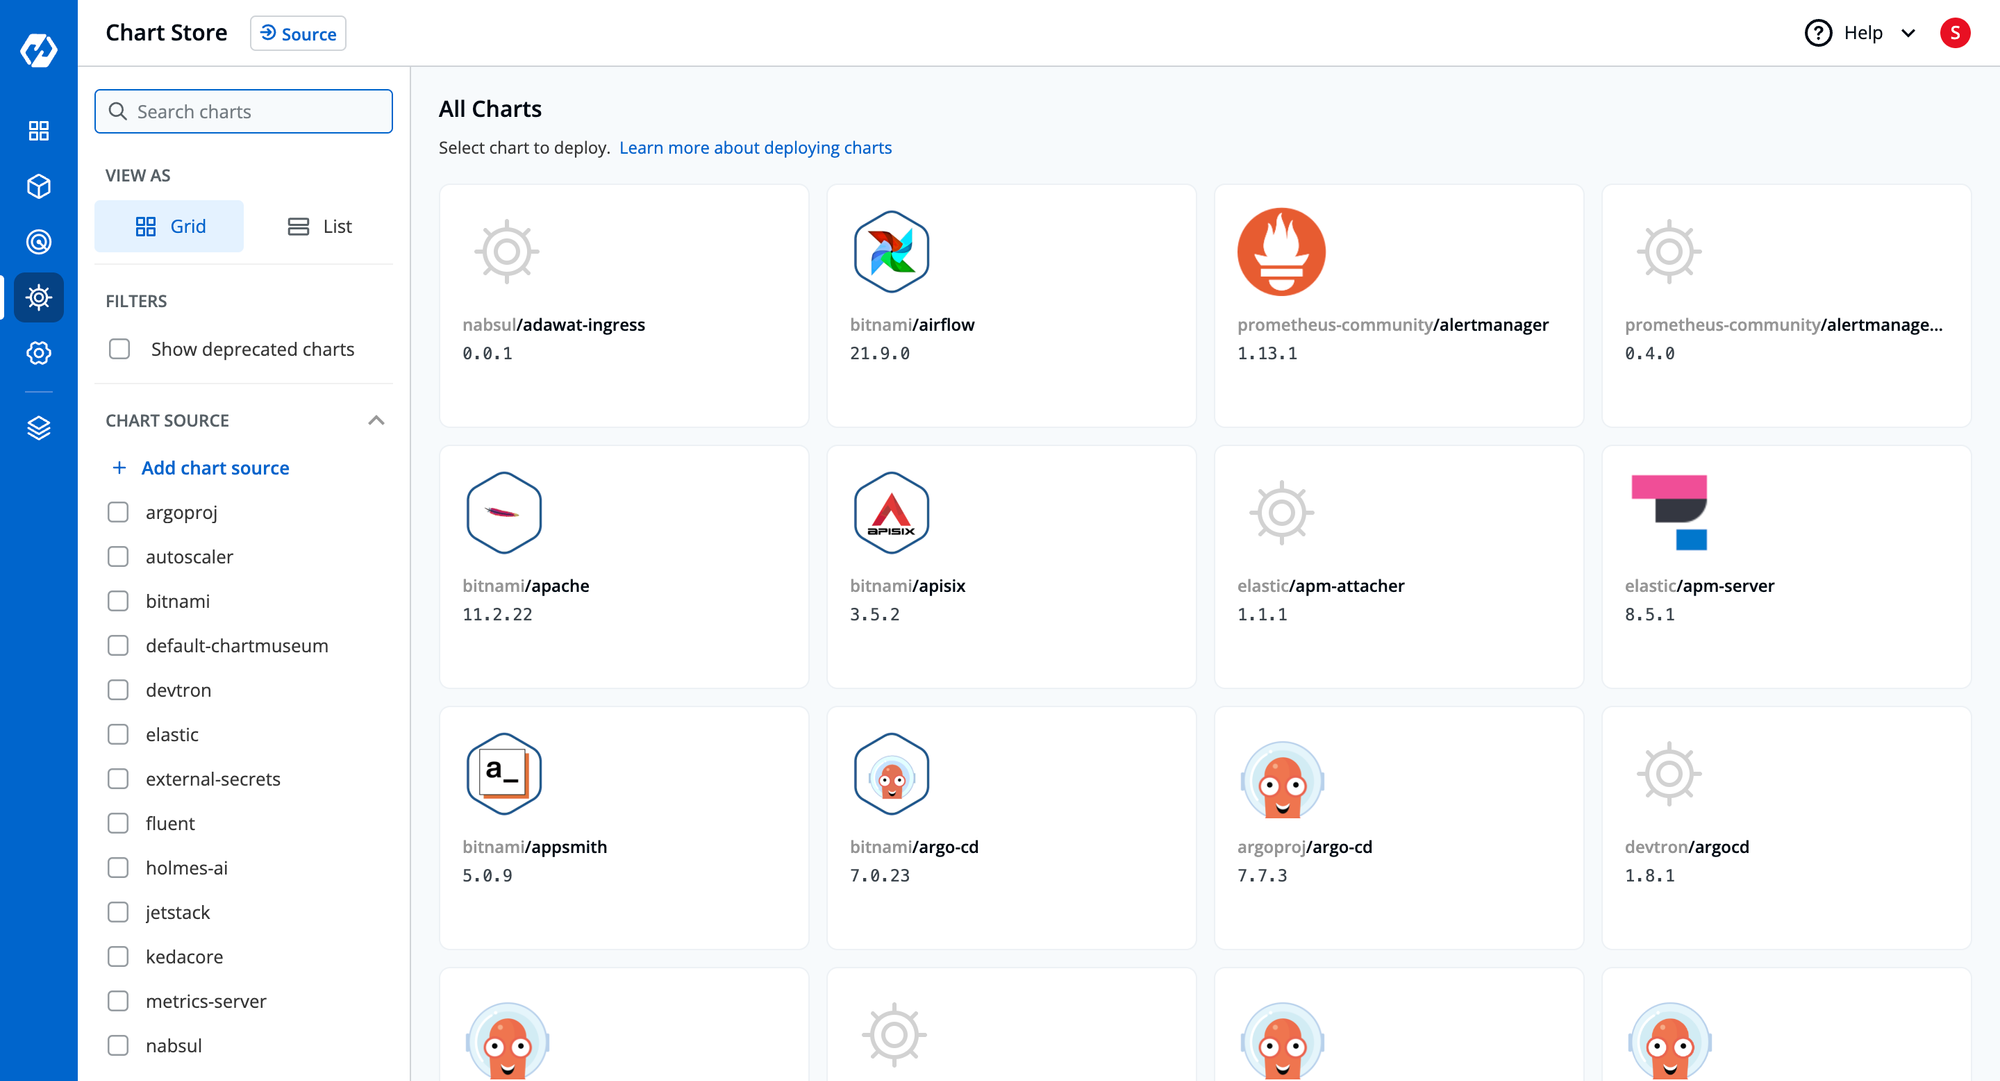
Helm is the most adopted package manager for deploying applications on Kubernetes. Though widely adopted because it reduces the complexities of deploying applications on Kubernetes, Helm CLI has several operational challenges. For example, after the chart is deployed, you have no visibility into which resources were deployed by the Helm chart, or if everything is deployed and working correctly. Devtron is aware of the community's difficulty with existing Helm CLI features. Considering these common problems, we built an intuitive Helm dashboard for managing the lifecycle of Helm apps, abstracting out all the complexities and challenges.
You may also have a look at the challenges that the Helm Dashboard by Devtron can help you solve!
2. Resource Browser
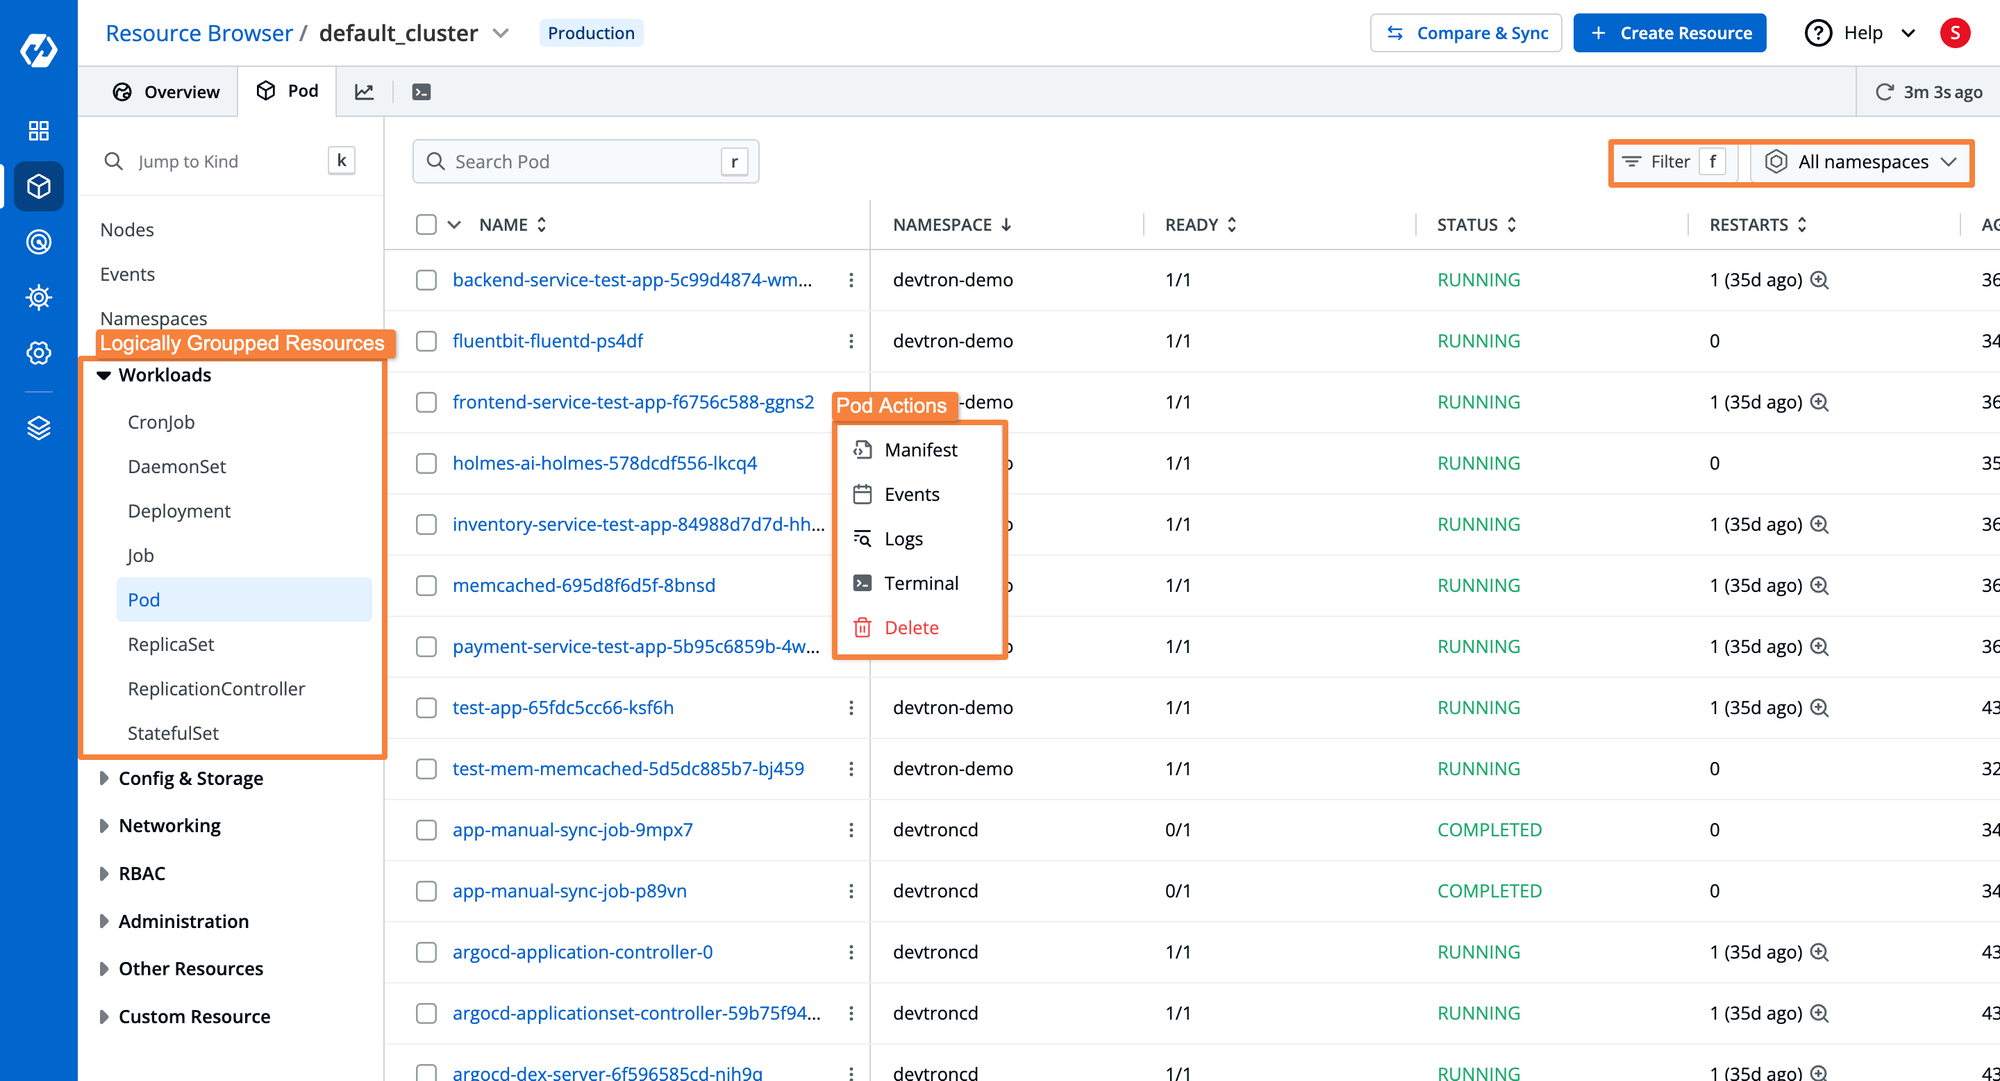
The Kubernetes dashboard provides a simple, easy-to-use user interface for managing and monitoring Kubernetes applications and clusters. The Kubernetes resource browser increases the scope of Kubernetes application management by aiding in convenience and enriching a dashboard's capabilities. It provides visibility into every single resource that is deployed to the Kubernetes cluster.
To know know about the Kubernetes Resource Browser, please have a look at the blog post.
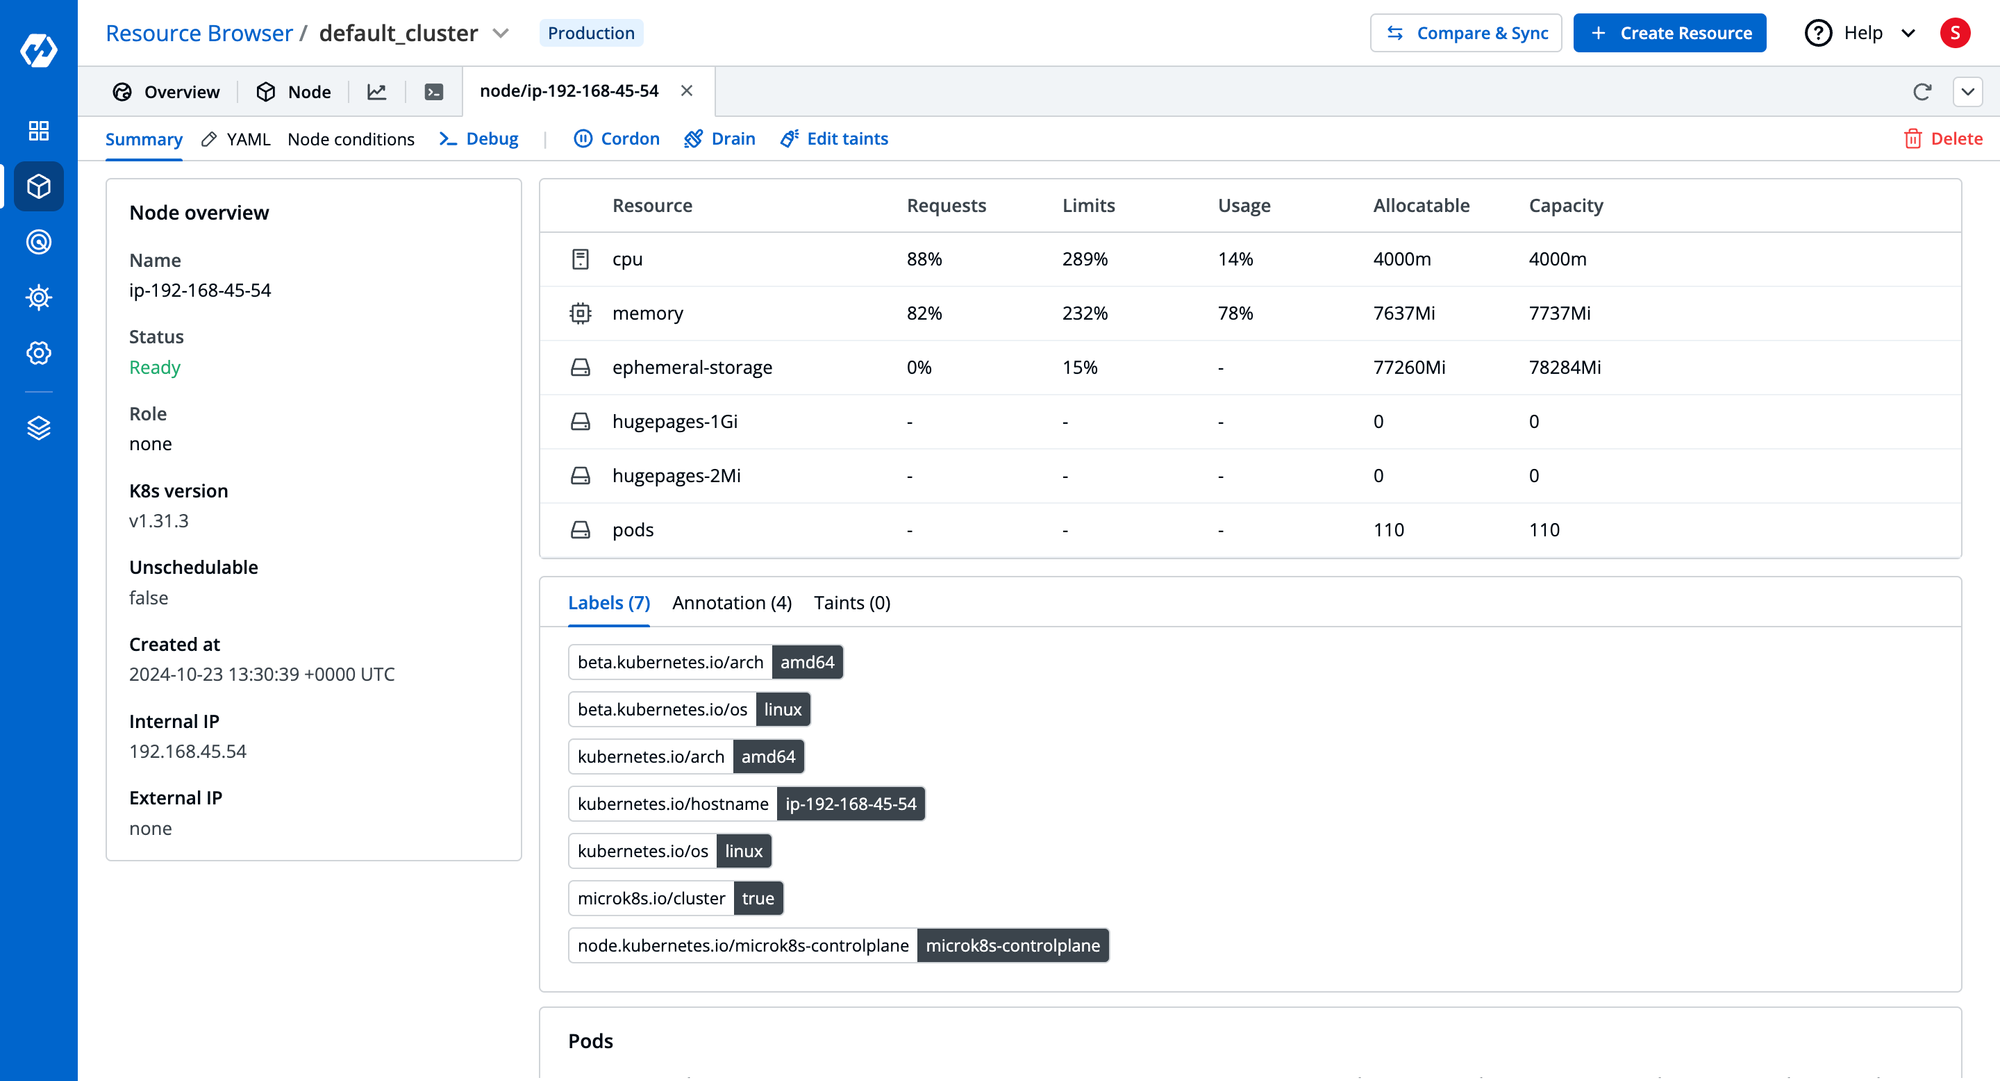
The resource browser by Devtron also provides a brief overview of clusters added to the dashboard and helps you monitor the cluster performance. It gives the real-time node health status and summary of nodes, including resources usages, labels, annotations, taints, pods on each node, and a lot more. The following node operations can easily be performed using the dashboard:
- Cordon a node
- Drain a node
- Taint a node
- Debug node/cluster using cluster access terminal
- Edit the node manifest
- Delete a node from the Kubernetes dashboard
- Launch a Terminal in the node
Now, in this blog post we will be learning how you can get started with the Kubernetes Dashboard by Devtron and understand how it helps you solve some of the most common challenges with ease.
Streamline Kubernetes operations with Devtron's dashboard
- Unified Multi-Cluster Management: The Kubernetes Dashboard from Devtron provides a single source of management for multiple clusters with real-time node health and resource utilization visibility.
- Advanced Helm Integration: Deploy, monitor, and manage Helm charts with ease using Devtron's simple and intuitive UI, eliminating the complexity of conventional Helm CLI management.
- Comprehensive Resources Visibility: Enjoy end-to-end visibility into all the resources within your Kubernetes clusters for simplified troubleshooting and debugging.
Streamline Kubernetes operations with the powerful dashboard of Devtron.
Installation Guide
We will now take a look at how to install and use the Kubernetes Dashboard by Devtron. Devtron's Kubernetes Dashboard can be installed very easily using a helm install command. Let's go over all the steps.
Pre-requisites
Before moving forward with the main installation steps, make sure you have the following installed and configured:
You may refer to the getting started documentation to learn more about the pre-requisites and the minimum resources required for the installation.
Installing Kubernetes Dashboard using Helm
The following are the steps to install Kubernetes Dashboard by Devtron using Helm:
NOTE: Make sure your Kubernetes cluster is running before moving forward with the following commands.
You can usekubectl cluster-infoto check the details of your running cluster
Step 1:
Add the Devtron helm repo:
helm repo add devtron https://helm.devtron.aiYou can use the following command to check whether the repo has been added to the list of installed Helm repos:
helm repo listStep 2:
Install the Kubernetes dashboard by the following command:
helm install devtron devtron/devtron-operator --create-namespace/
--namespace devtroncd --set components.devtron.service.type=NodePort Step 3:
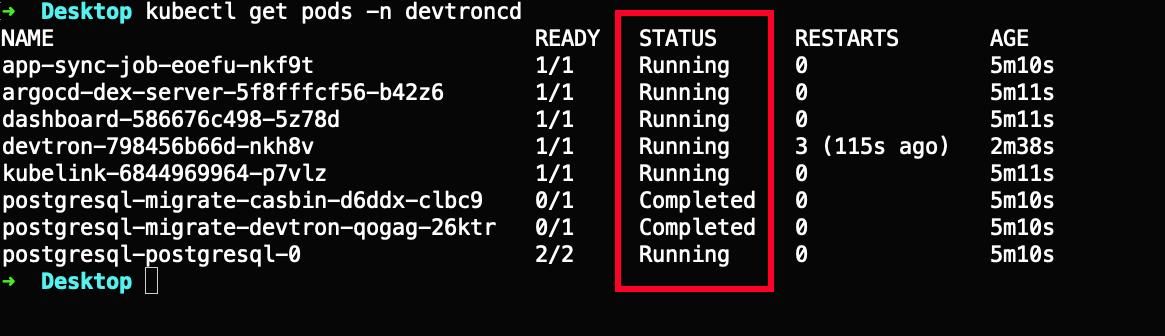
To check the status of all the pods, run the following command:
kubectl get pods -n devtroncdOnce all the pods are running successfully (see the image below), we are now ready to move forward with the next steps.
Step 4:
To get the port number through which you can access your Devtron service, run the following command:
kubectl get svc -n devtroncd devtron-service -o jsonpath='{.spec.ports[0].nodePort}'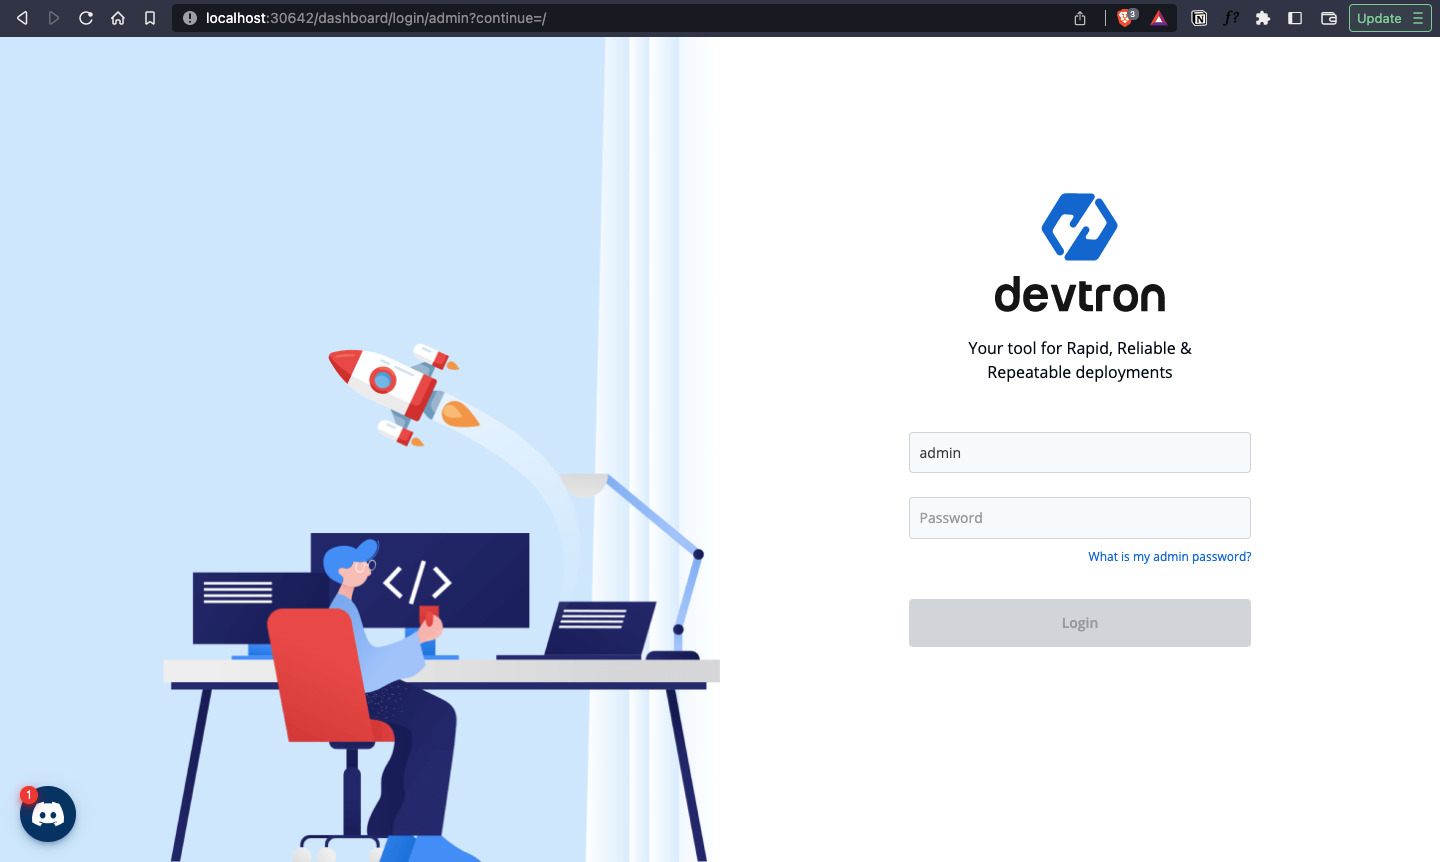
Your Kubernetes dashboard will now be accessible at: http://localhost:<PORT>
Step 5:
To get the Dashboard Admin credentials:
Username: admin
Password: Run the following command to get the admin password:
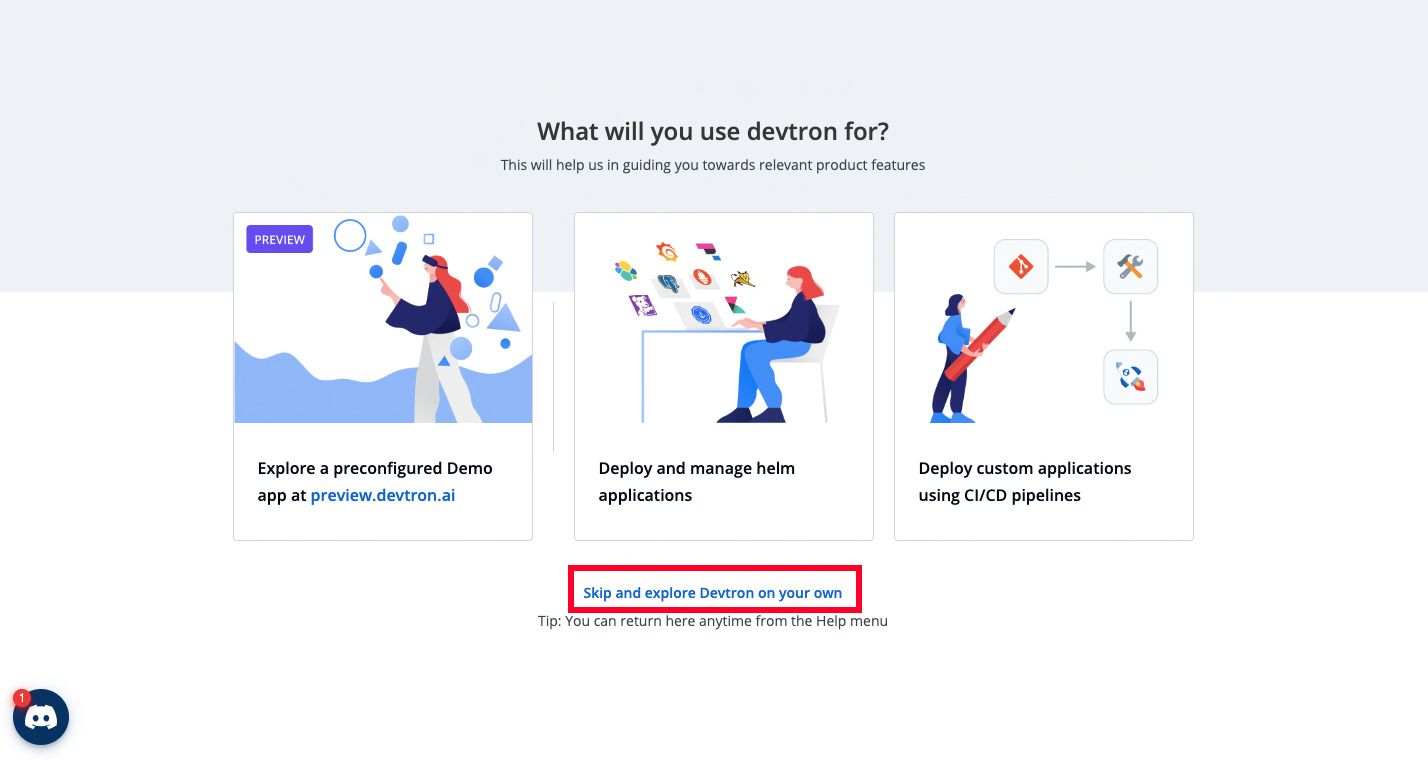
kubectl -n devtroncd get secret devtron-secret \-o jsonpath='{.data.ADMIN_PASSWORD}' | base64 -dOnce you are logged in, the very first time you'll be prompted with the following options (see fig 5). You may choose the appropriate one for your use case, but we'll skip the pre-configured options for this tutorial.
Congratulations! You are ready to use the Kubernetes Dashboard now 🎉
Real-life Use Cases
Let us see how the Kubernetes dashboard can be a valuable tool in debugging and troubleshooting your applications. We all know that fixing issues can be made comfortable if the detection process is simplified, which is precisely what Devtron does.
NOTE: This section will also take a few examples from a To-Do List application built with Django and PostgreSQL as the database, which has already been deployed on Kubernetes using Devtron.
Additionally, you may also refer: deploying the application on Kubernetes using Devtron.
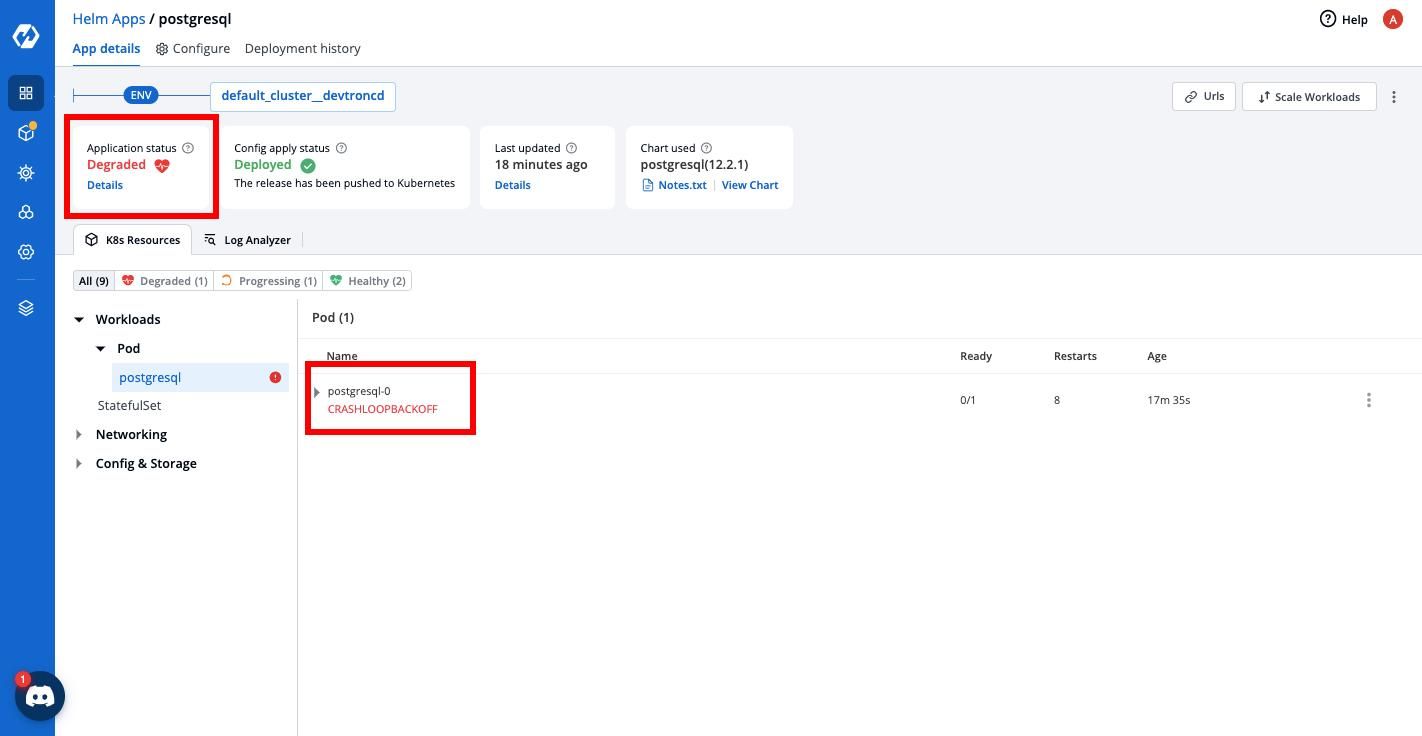
Scenario 1: CrashLookBackOff
As a first step of deploying the Django application, we have deployed a PostgreSQL helm chart with the default configuration.
Let us assume a situation where your PostgreSQL pod shows the status - CrashLoopBackOff. This error means that the pod failed to start, Kubernetes tried to restart it, and it is repeatedly failing. Generally, there are a few ways you can debug your pod using kubectl & the CLI and get a bit deeper into exploring the issue in your configuration files. But we all understand it’s a tedious process, so we will use the dashboard to find the error!
If we now head over to our deployed PostgreSQL helm chart (having some error) through the dashboard, it would look something like the image below:
Troubleshooting & Fix:
You can even identify the error from the Kubernetes Resource Browser as well (image below).
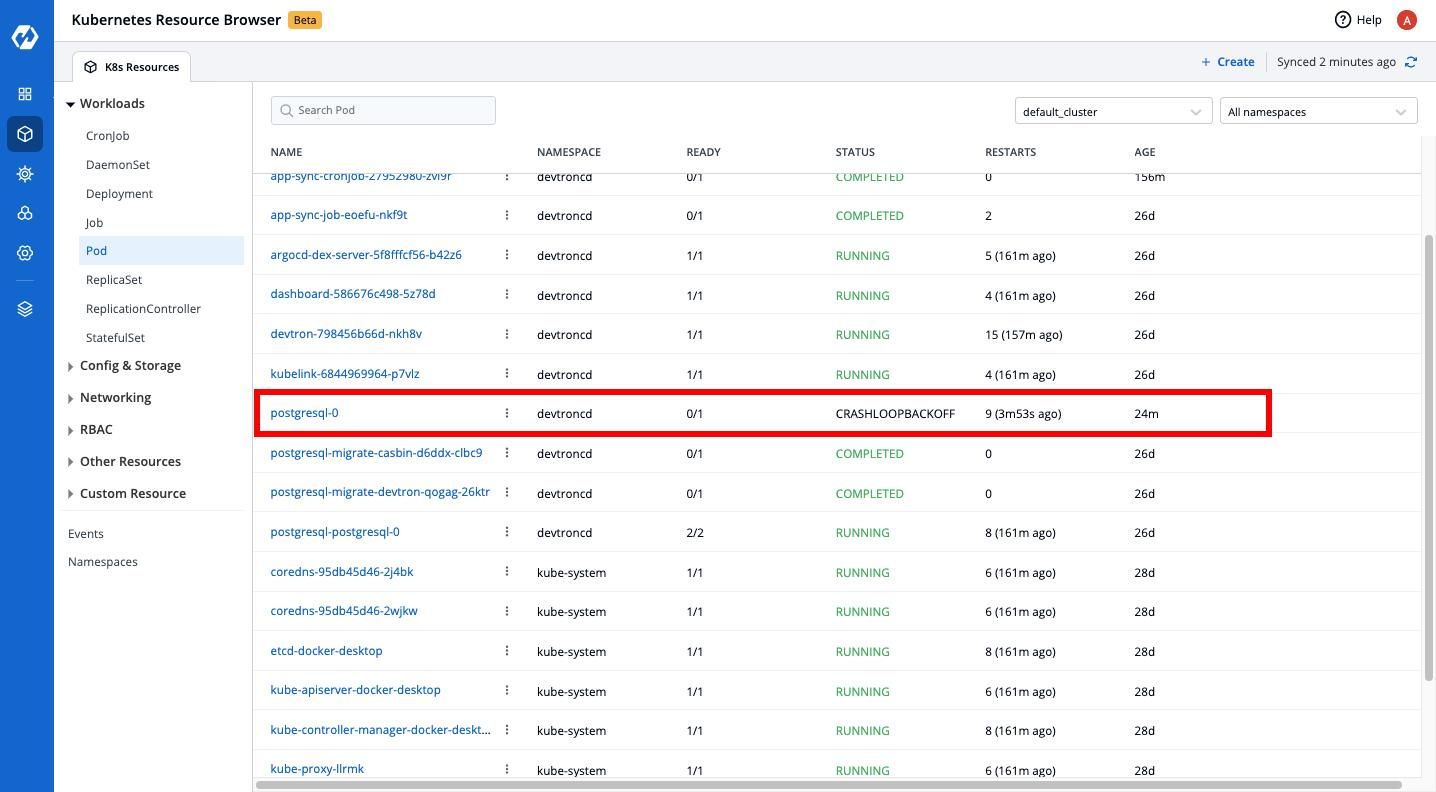
From this, we can see that the pod status is CRASHLOOPBACKOFF, and the application status is Degraded, meaning “Something is wrong with workload & immediate action is required”.
Here are a few things you can do in the dashboard to debug this issue. The below options can be found if you hover over the pod name.
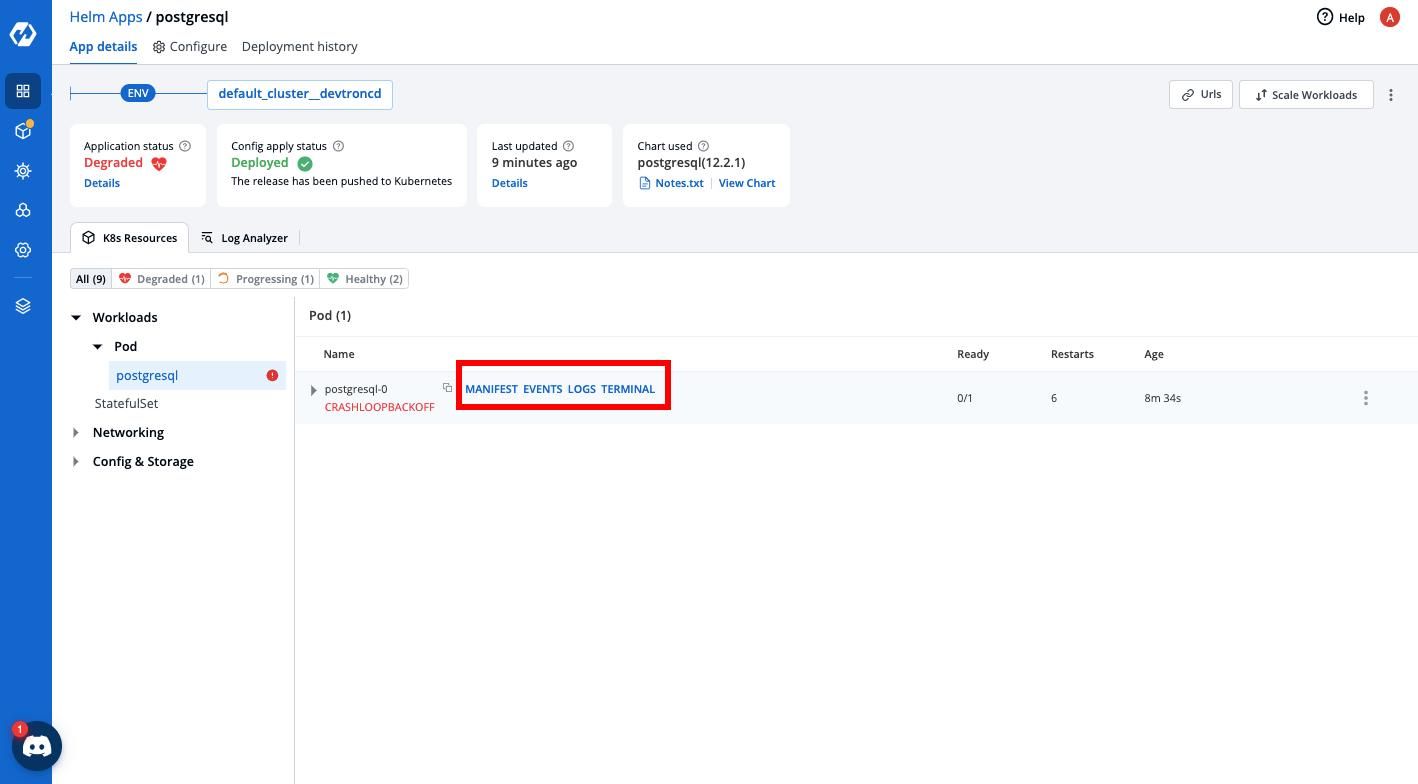
Step 1: Check the pod logs
The dashboard provides you with the feature to view real-time pod logs where you can monitor the pod activities and look out for potential issues that may be causing the error.
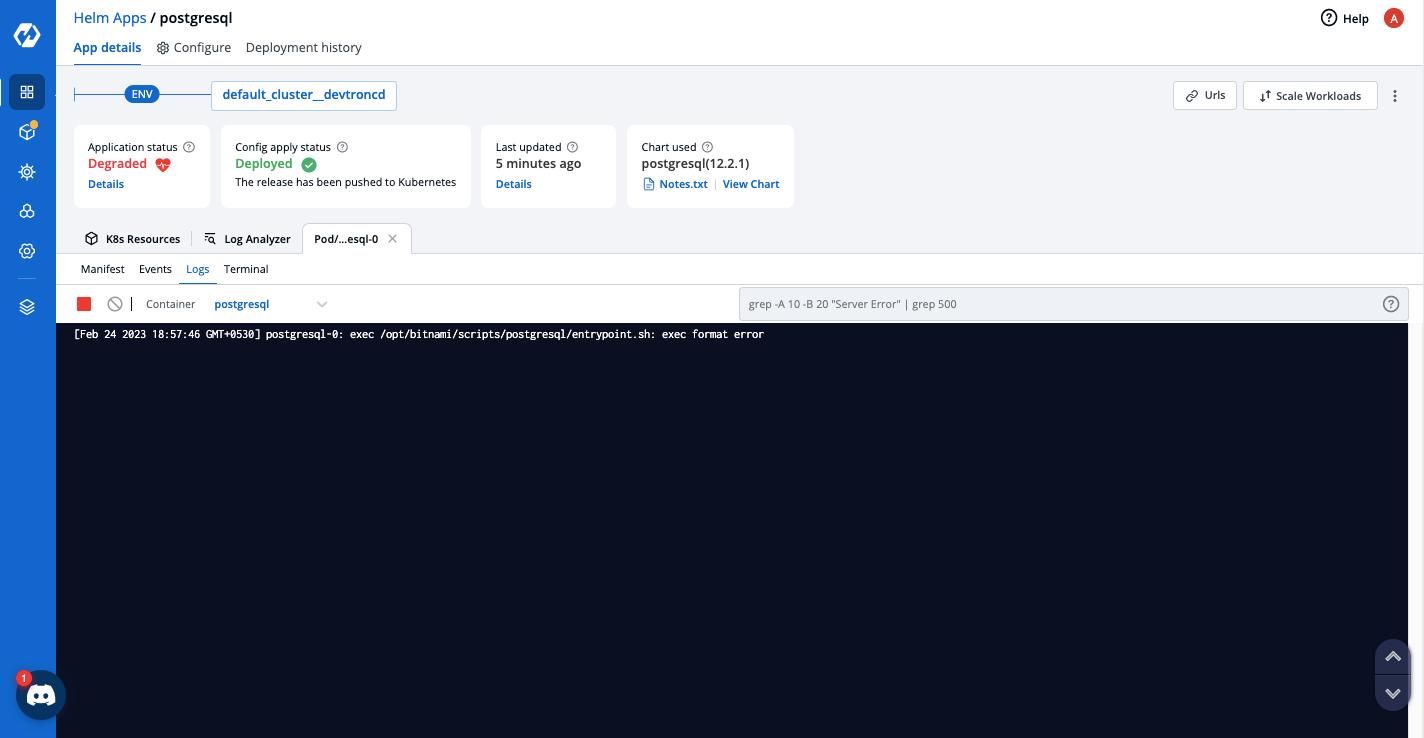
In our case, the logs aren’t showing effective results for our issue (image below), so let’s proceed to the next step.
Step 2: Check the pod events
If we now check the pod events, we can see the error as - Back-off restarting failed container which essentially means that we are dealing with a temporary resource overload, as a result of an activity spike.
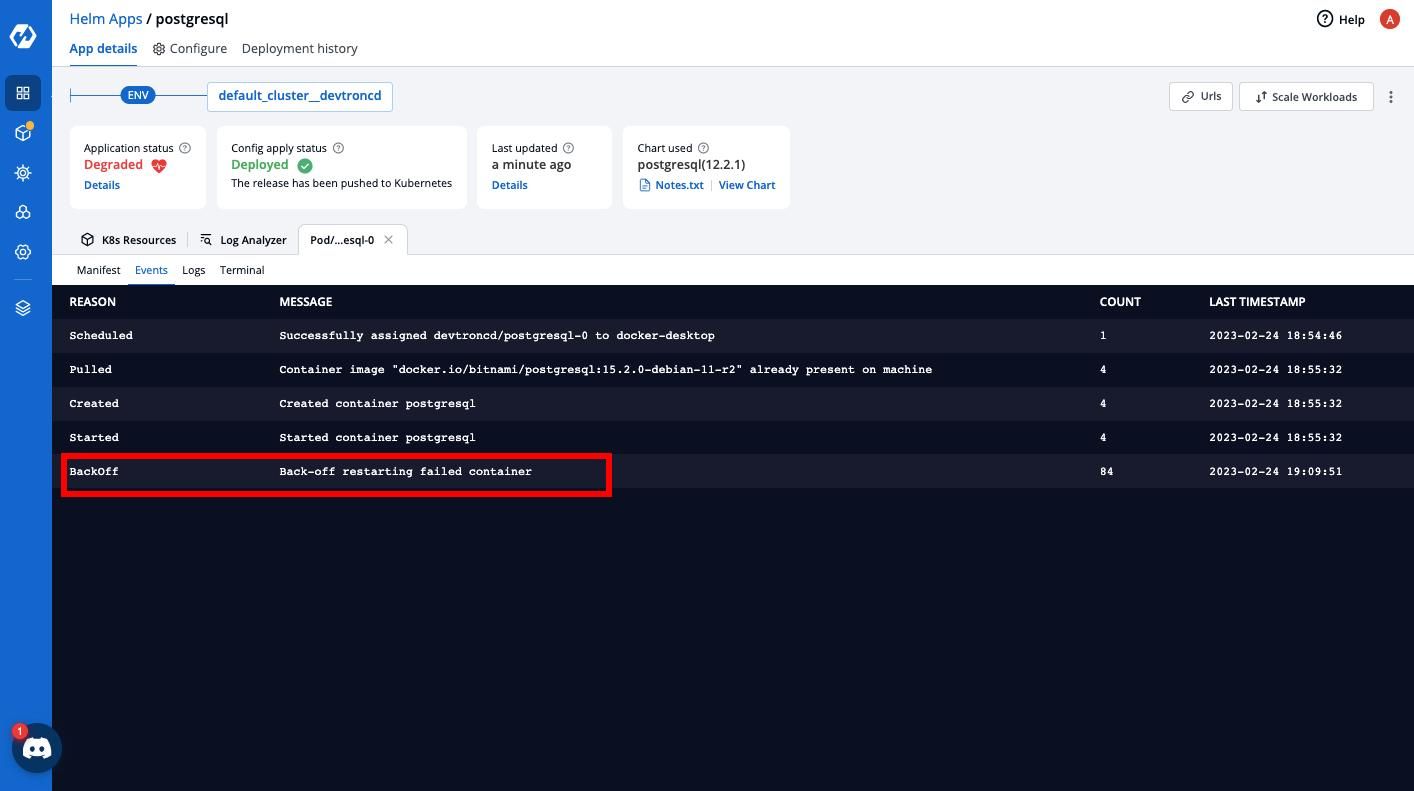
A potential solution is to adjust periodSeconds or timeoutSeconds to give the application a more prolonged response window.
Step 3: Use the in-built terminal to run commands for troubleshooting
This can be another way to debug the containers running for your application. With the in-built terminal by Devtron, it’s effortless to quickly run some commands that may help you find more details about the problem here.
To know more about troubleshooting a cluster through the CLI, check out this official guide from Kubernetes docs.
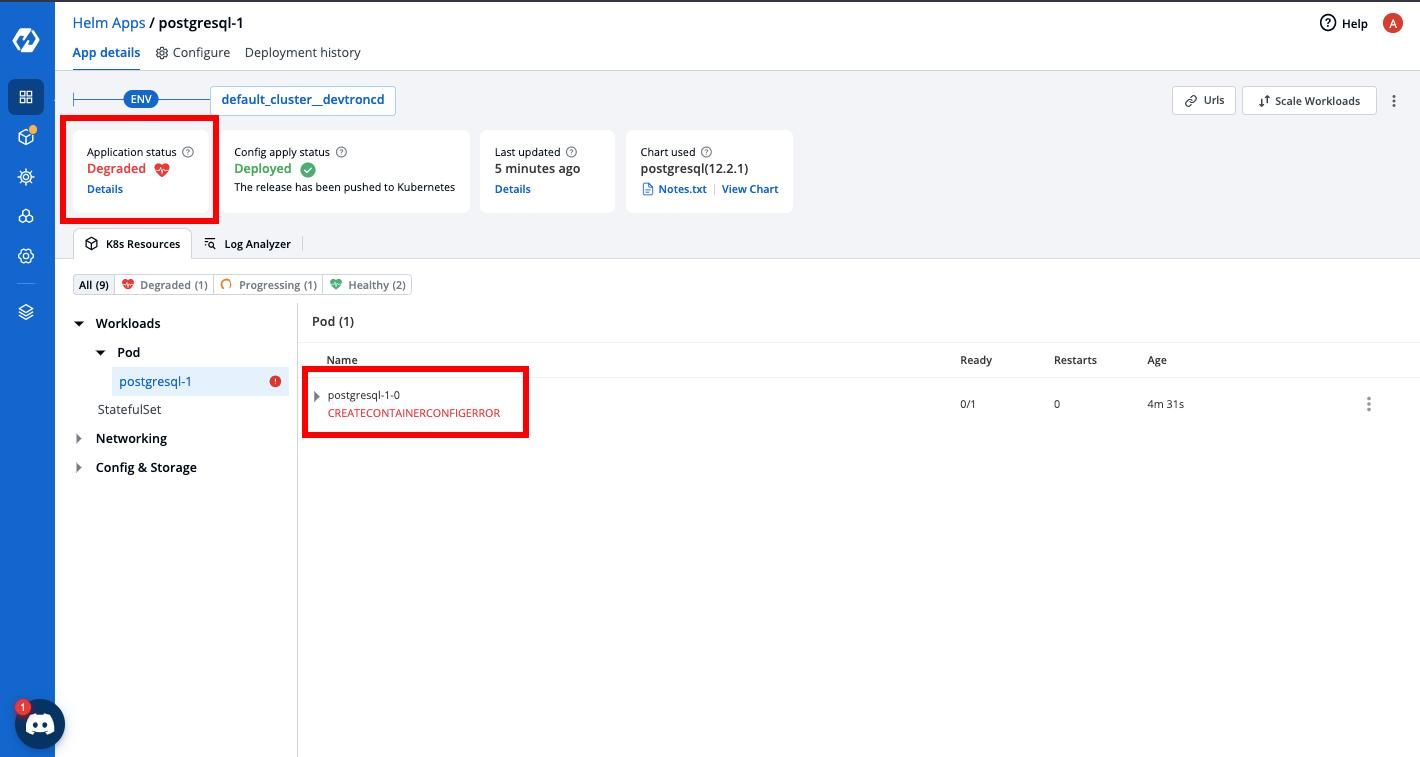
Scenario 2: CreateContainerConfigError
Another scenario could be that your pod shows the status as CreateContainerConfigError. This error usually occurs when Kubernetes tries to create a container in a pod but fails before the container enters the Running state.
Let us debug this using Devtron.
Troubleshooting & Fix:
The dashboard will indicate to you that there is an error, as shown by the image below:
We can hover over the pod to find various options to try to debug it. Let’s check the pod events for this one (image below):
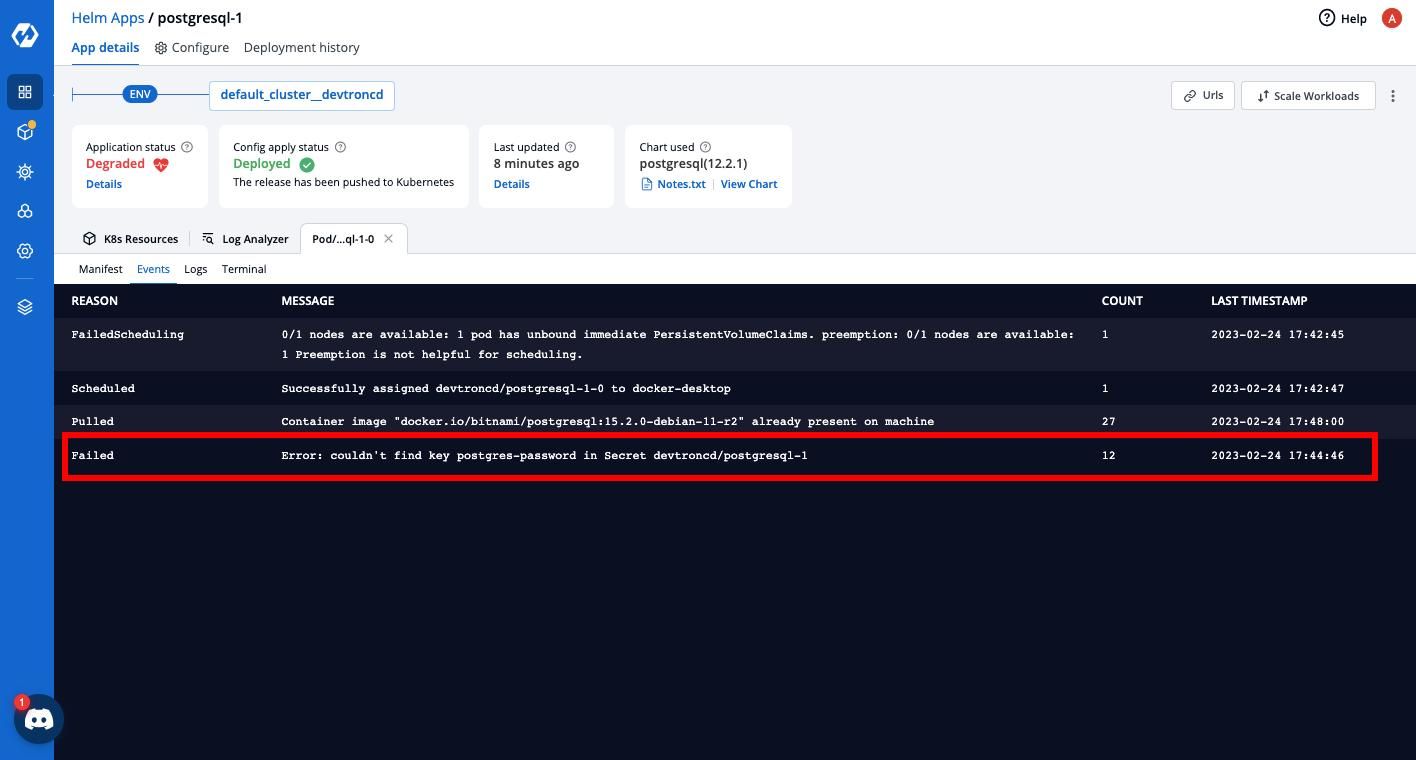
It could not detect any admin password for our PostgreSQL database in our secret devtroncd/postgresql-1.
Now that we know what's causing the issue, we can make the necessary changes in the configuration file in the dashboard and re-deploy your application.
Scenario 3: ImagePullBackOff
In this scenario, let’s do something interesting. To simplify things, we’ll take an example of an Nginx helm chart already deployed with default configuration using Devtron and explicitly make some changes in values.yaml file, which would cause some errors. And then, we’ll see how Devtron helps detect the issue and how it can apply a fix to it.
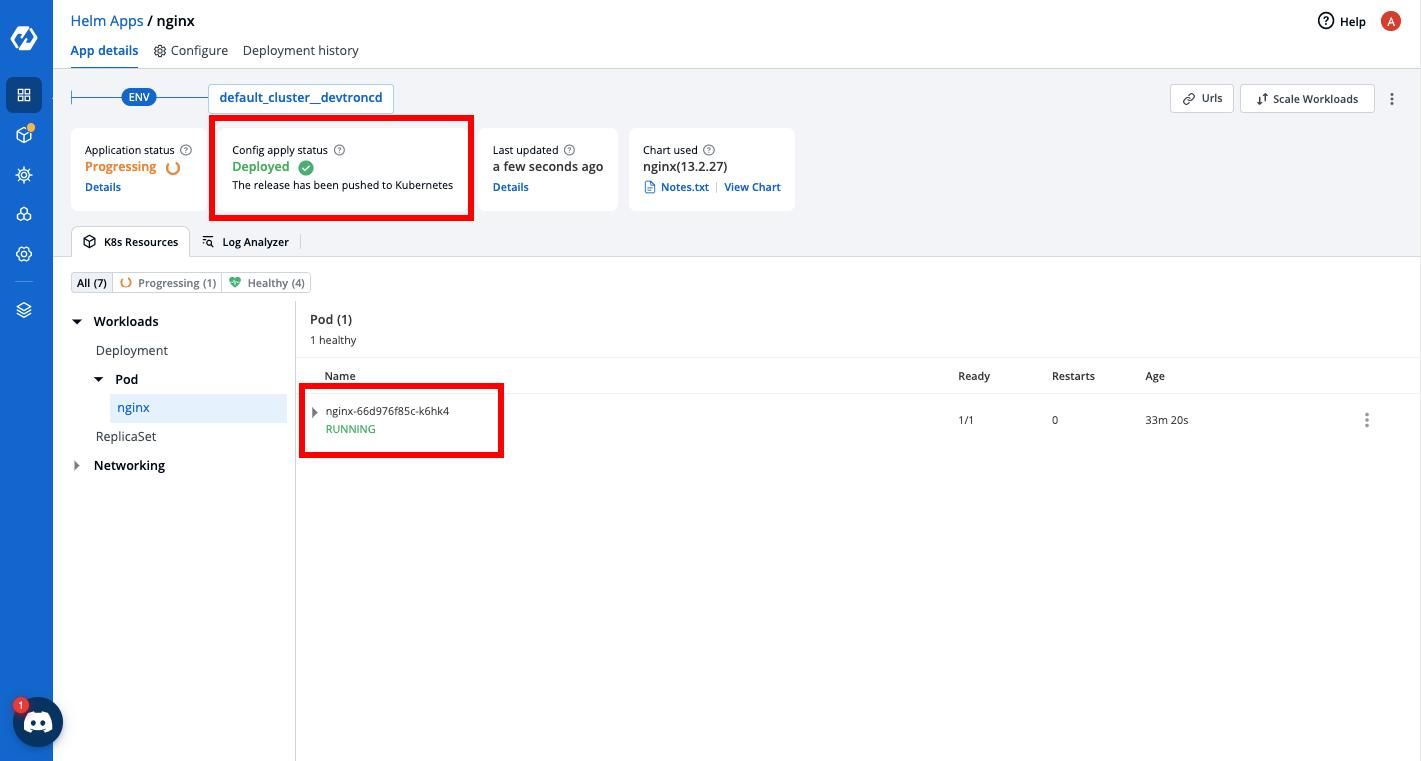
Here, we have an Nginx helm chart deployed, and you can view the deployment details as shown below:
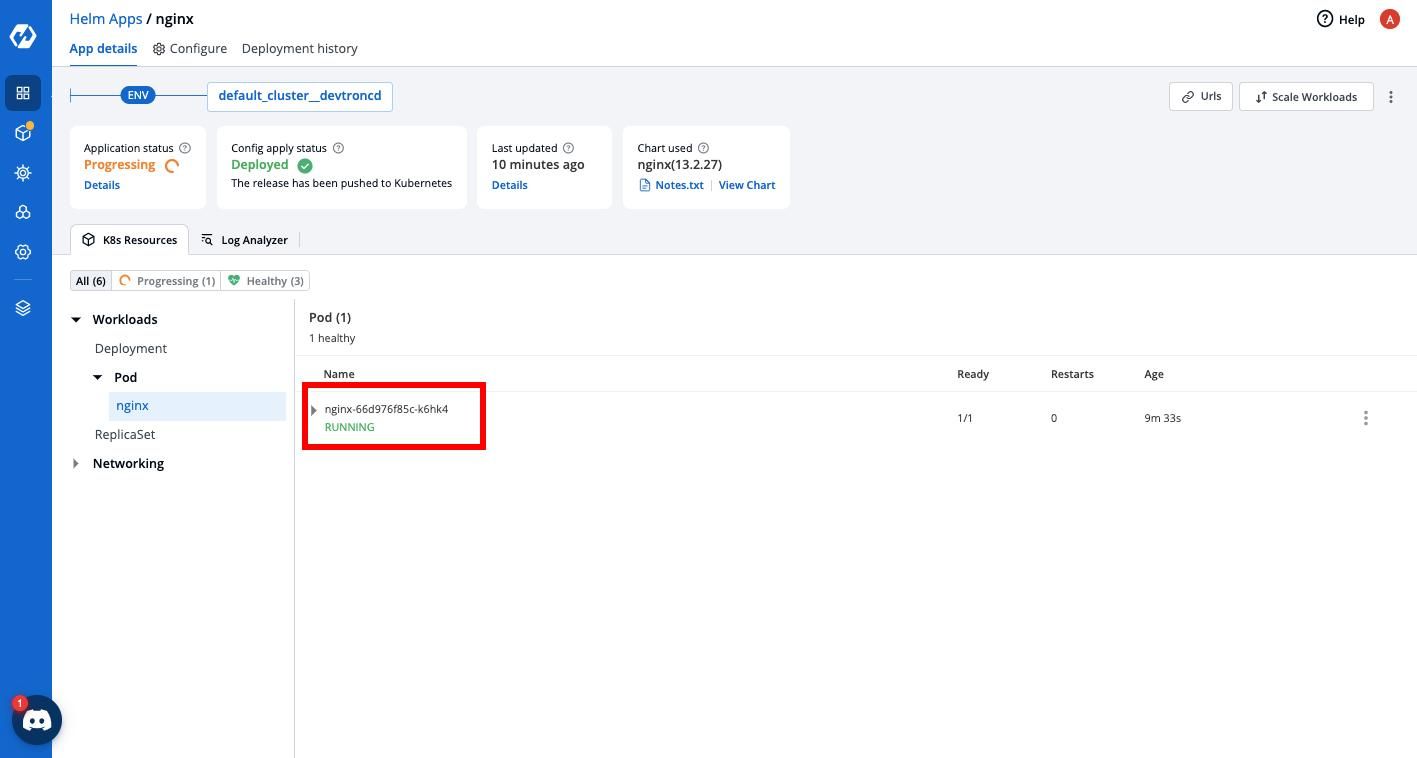
We can see that the pod is running as of now.
NOTE: in some cases, it may take some time for the application status to update the health of the deployed application.
Now, let’s slightly change our values.yaml files. Here, we changed the name of the image repository from where the Nginx image is being pulled.
From:
image:
  debug: false
  digest: ""
  pullPolicy: IfNotPresent
  pullSecrets: []
  registry: docker.io
  repository: bitnami/nginx
  tag: 1.23.3-debian-11-r26
To:
image:
  debug: false
  digest: ""
  pullPolicy: IfNotPresent
  pullSecrets: []
  registry: docker.io
  repository: bitnami/devtron
  tag: 1.23.3-debian-11-r26
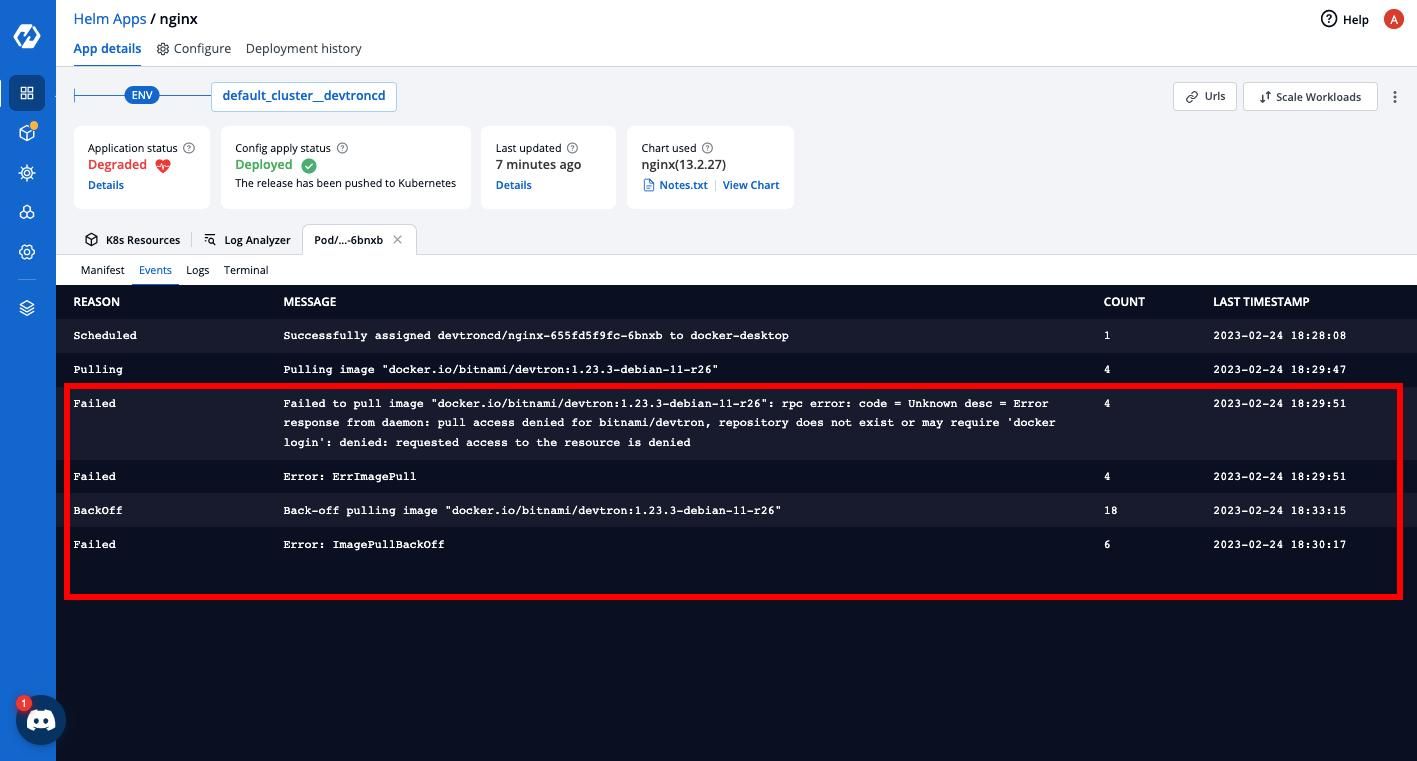
Now, if we update & re-deploy our application and have a look at the App details tab, Devtron has detected the error as ImagePullBackOff - which means that Kubernetes pod experienced issues when trying to pull out our container image from the container registry, and that is entirely fair because we explicitly changed the name of the repository above.
Troubleshooting & Fix:
If we look at the pod events, it clearly shows that Kubernetes first failed to pull the image and then went into an ImagePullBackOff state.
Something interesting to note here is that if we closely look into the events, we can find exactly what is causing this error. In one of the error statements, we can see the repository name as bitnami/devtron (image below). If you know the correct repository for Nginx, you already have the solution to what's causing this error and can fix it immediately!
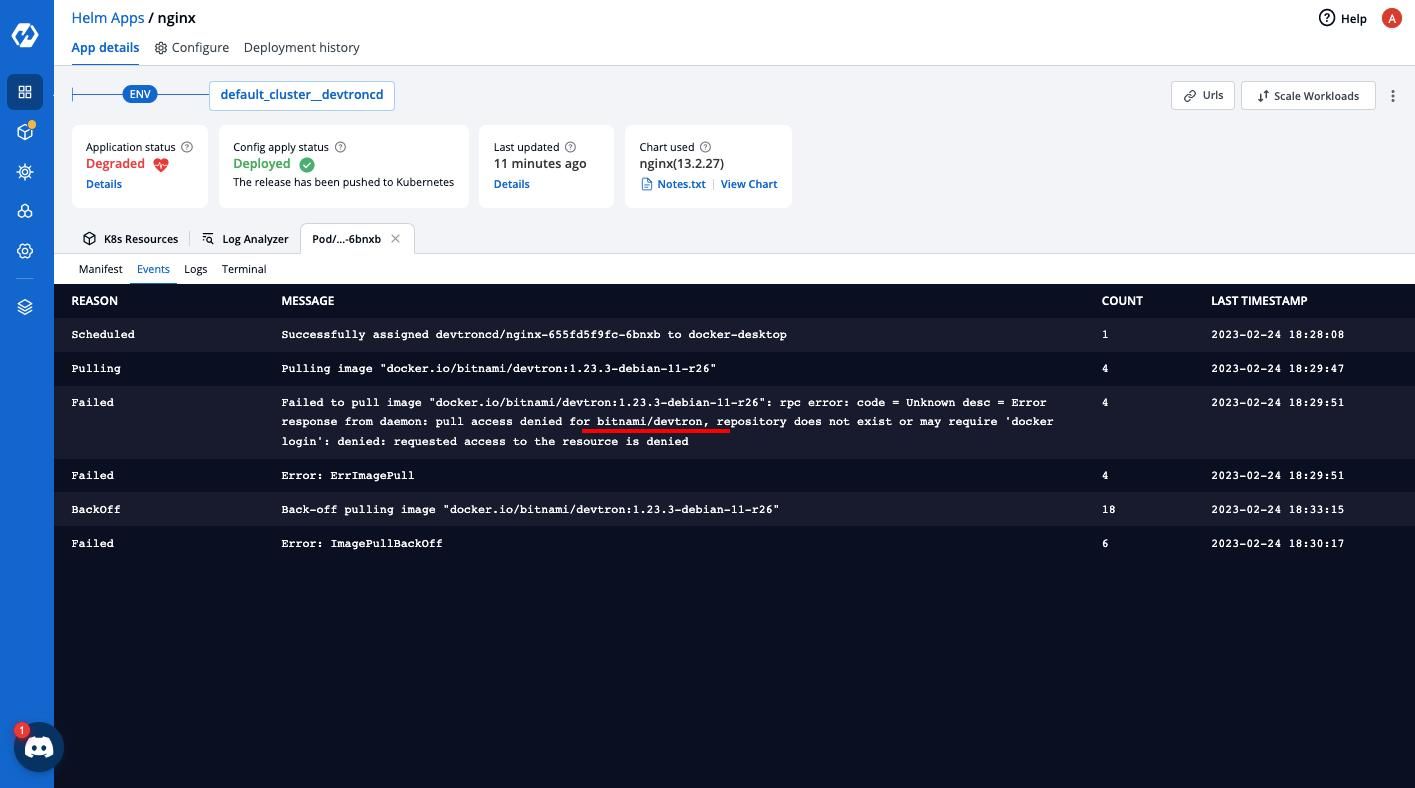
We can quickly return to our values.yaml files and revert our changes. And the status changes back to running again.
Conclusion
In this blog, we talked about how you can get started with the Kubernetes Dashboard by Devtron and how it can simplify the debugging and troubleshooting process for you.
If you want to dive deeper into the features offered by the dashboard, check out the blog - Manage Kubernetes with Kubernetes Dashboard by Devtron.
Feel free to join the Devtron discord community to get involved with our open-source ecosystem!