It’s a Friday evening and you’re about to check out from your workplace. Suddenly, you get a notification from Grafana for a sudden spike in CPU usage. You spend hours trying to figure out the reason for the sudden spike, and how you can fix it, all while receiving angry calls from frustrated users about the degraded performance. You figure out that the traffic volume has increased, and the HPA has already created the maximum replicas. This problem has quite an easy fix i.e. increasing the maximum allowed replicas.
However, finding the root cause of this simple problem may take a few hours, leaving many users unhappy with degraded service performance, and you almost ended up pulling an all-nighter, all because of this simple issue.
With automated remediation, Kubernetes becomes not just scalable but self-healing. Discover how to implement this game-changing approach today
Remediation in Kubernetes
Within Kubernetes, we often encounter issues that have easy and obvious fixes. However, it can take hours to debug and reach the root cause of the issues can cause massive service disruptions, and lead to degraded performance of applications. These issues can be a deleted pod, an unmounted PVC, a missing secret, or several other common issues.
Trying to fix these issues usually involves first getting some visibility into the problem. Maybe there’s a configuration change within your pod manifest, which isn’t causing any immediate harm. You wouldn’t even notice a change in your observability graphs that can help you detect that there’s a problem. However, down the line, it can lead to massive problems in your applications. In this case, once again you might spend a lot of time trying to find the root cause, and the solution to which is a simple configuration change.
Wouldn’t it be amazing if you had some system in place which could automatically detect the changes within the resource manifests, and take some pre-defined actions?
Auto Remediation in Kubernetes within Devtron
Implementing a system in Kubernetes that can detect, and fix such commonly occurring errors would save a lot of time, and energy and avoid costly downtime or service degradation, which will ultimately lead to happier customers and more success for your business. At Devtron, we’ve created the Resource Watcher to help you monitor resources and take action when a certain condition is met.
The Resource Watcher can be configured to monitor either all the clusters or a specific environment. If there are only a few specific resources that you want to monitor, you can fine-tune which resources should be monitored and take action when something changes within those particular resources.
At the end of the day, having a tool like the Resource Watcher will help you quickly identify and resolve commonly reoccurring issues within clusters. This will save both time and engineering resources when common issues arise and they can be resolved swiftly.
Resource Watcher in Action
Let’s take a look at how you can configure the resource watcher to detect and update an HPA resource in Kubernetes. We will create a watcher to look at an HPA resource and increase the max count if the replica limit has been reached.
Before we create the watcher, let’s create a Job that will change the number of max replicas that the HPA will create.
From the Jobs dashboard, I can create a new Job called patch-hpa-job. This job will simply increase the maximum replica count in the HPA manifest by one.
While creating the job, we will need to pass in a Git repository. This repository will contain some code that we want to execute while running this job.
Within the pipeline, we will use the following script. This script will increase the max_replica_count once our conditions have been met.
#!/bin/sh
set -eo pipefail

echo "************ DEVTRON_INITIAL_MANIFEST *************"
HPA_NAME=$(echo "$DEVTRON_INITIAL_MANIFEST" | jq -r '.metadata.name')
MAX_REPLICAS=$(echo "$DEVTRON_INITIAL_MANIFEST" | jq -r '.spec.maxReplicas')
echo "HPA Name: $HPA_NAME"
echo "Max Replicas: $MAX_REPLICAS"

NEW_MAX_REPLICAS=$((MAX_REPLICAS + 1))
echo "New Max Replicas: $NEW_MAX_REPLICAS"
kubectl patch hpa $HPA_NAME -p "{\"spec\": {\"maxReplicas\": $NEW_MAX_REPLICAS}}"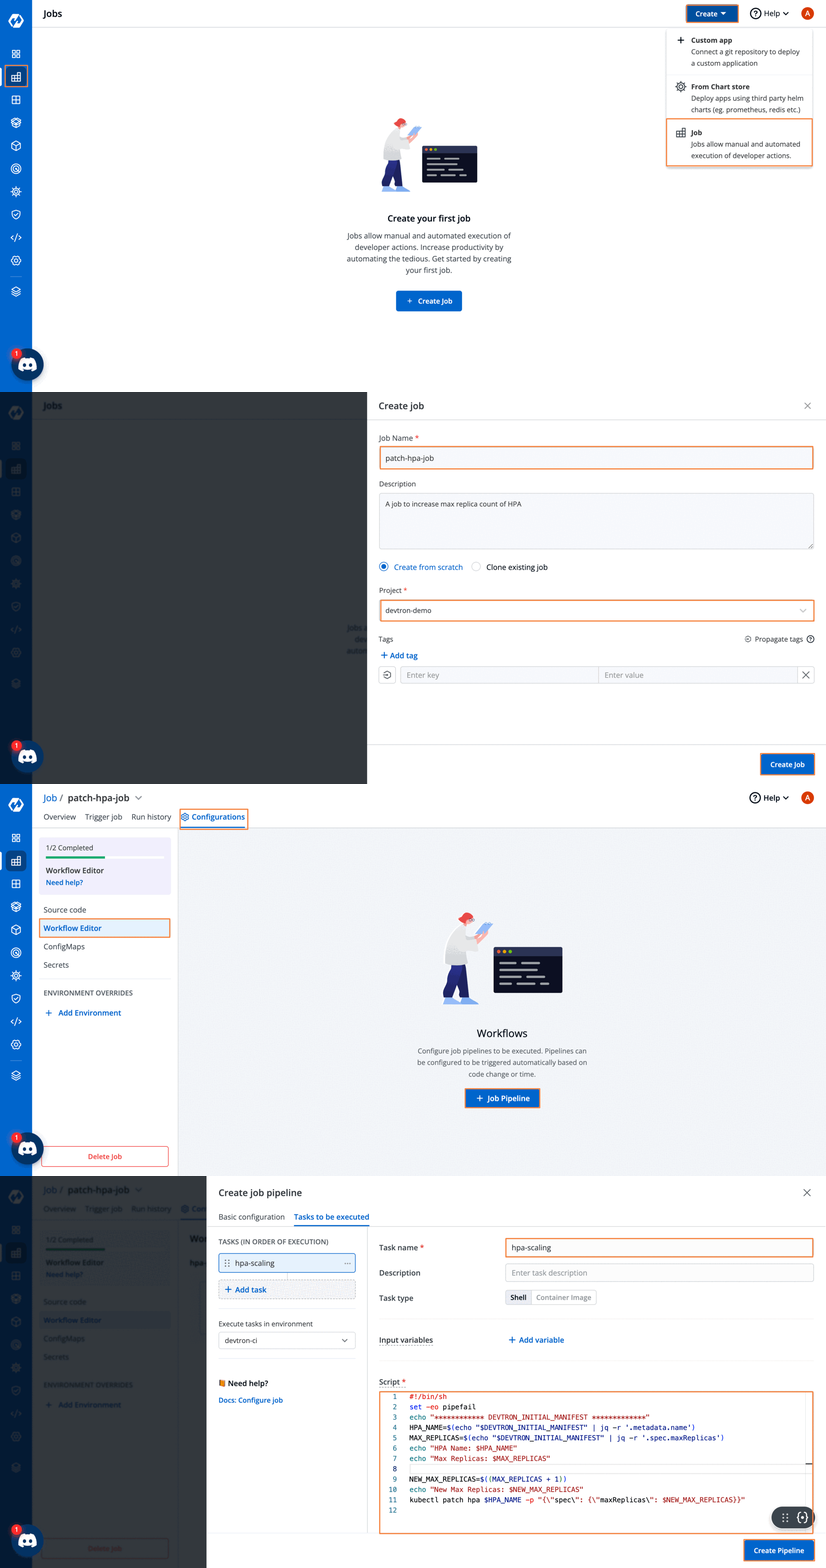
Once the pipeline is ready, we can configure the resource watcher to monitor our HPA resource and trigger the above job when a certain condition is met.
Step 1: From the Resource Watcher dashboard, create a new watcher by clicking on the New Watcher button.
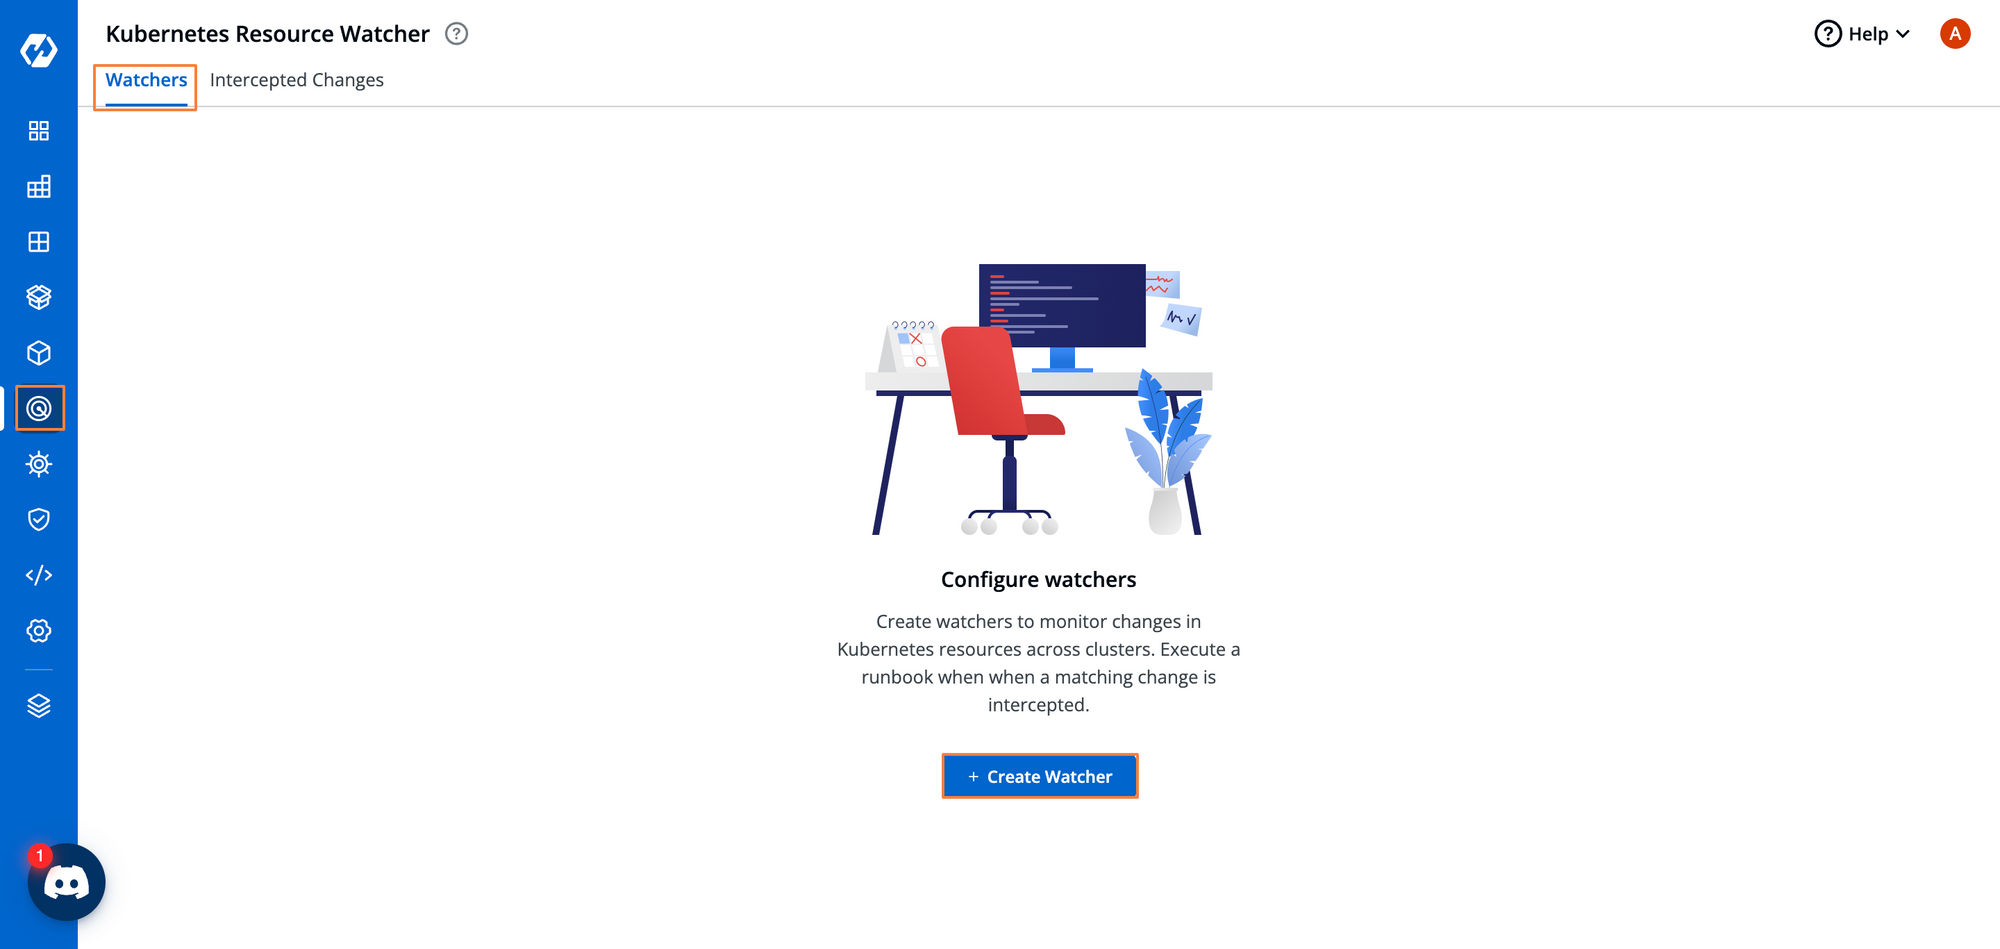
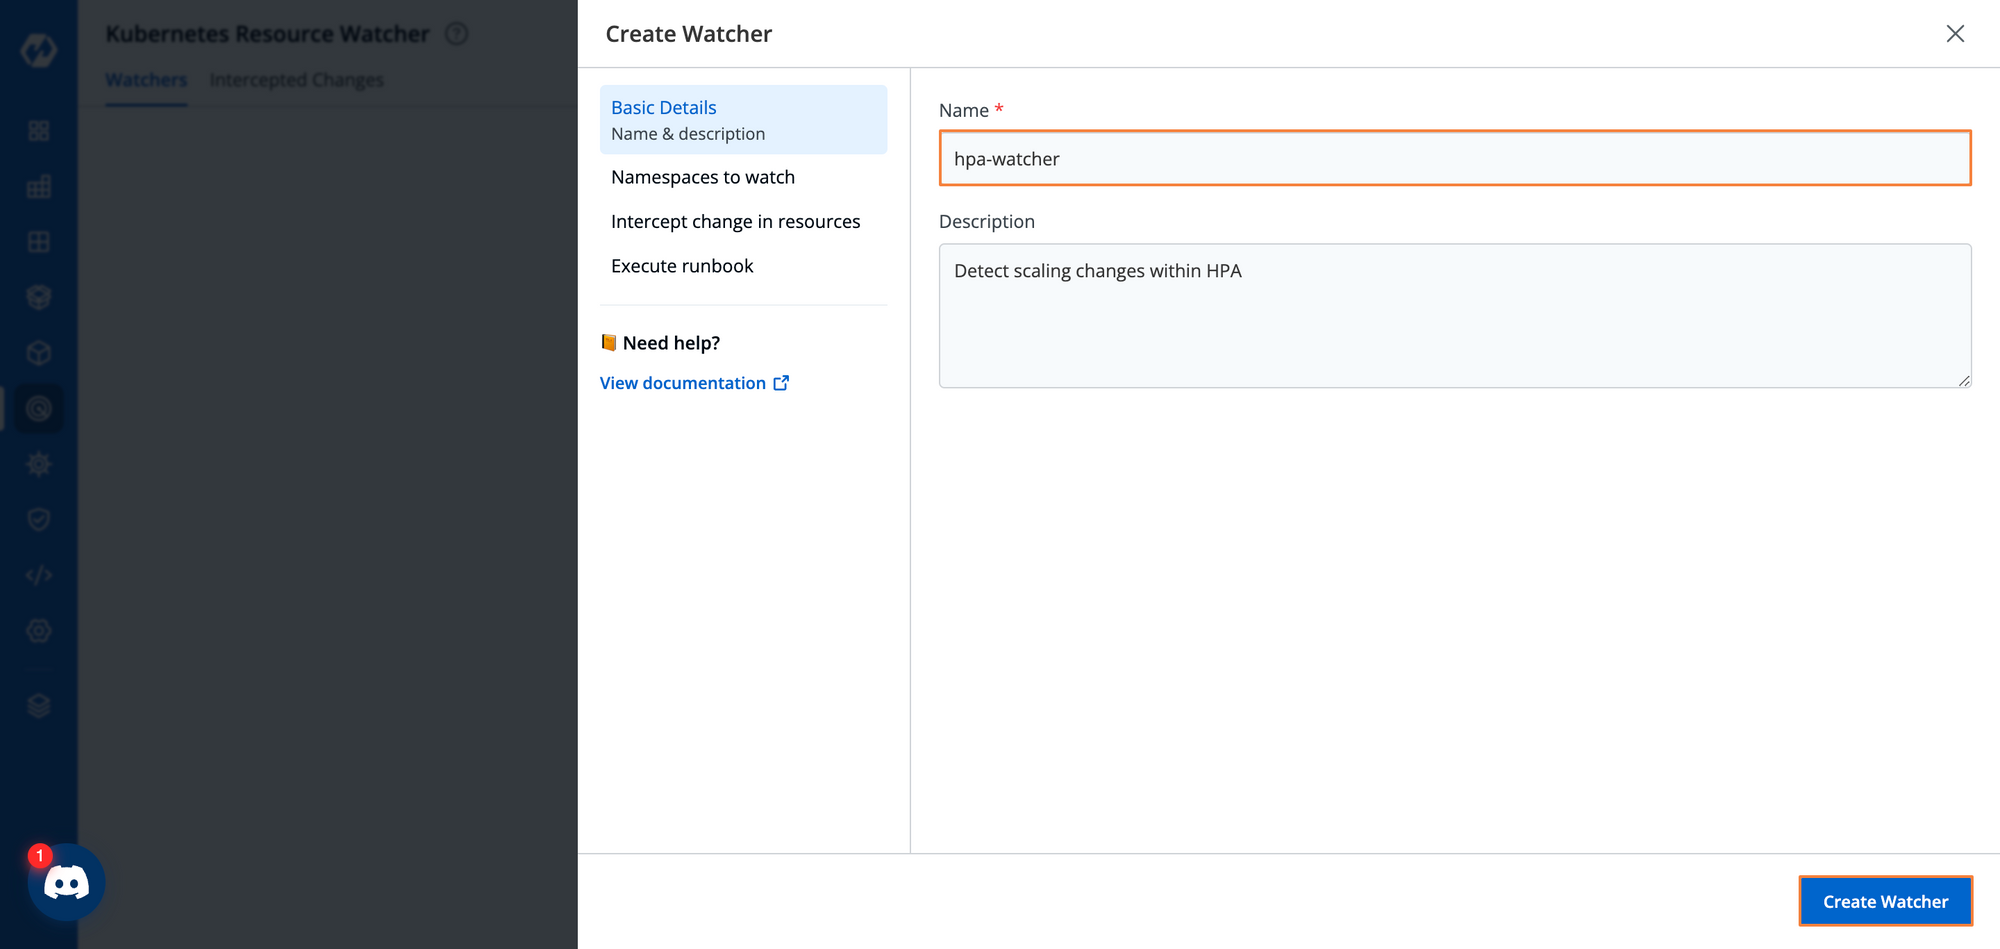
Step 2: Give this watcher a name and some description.
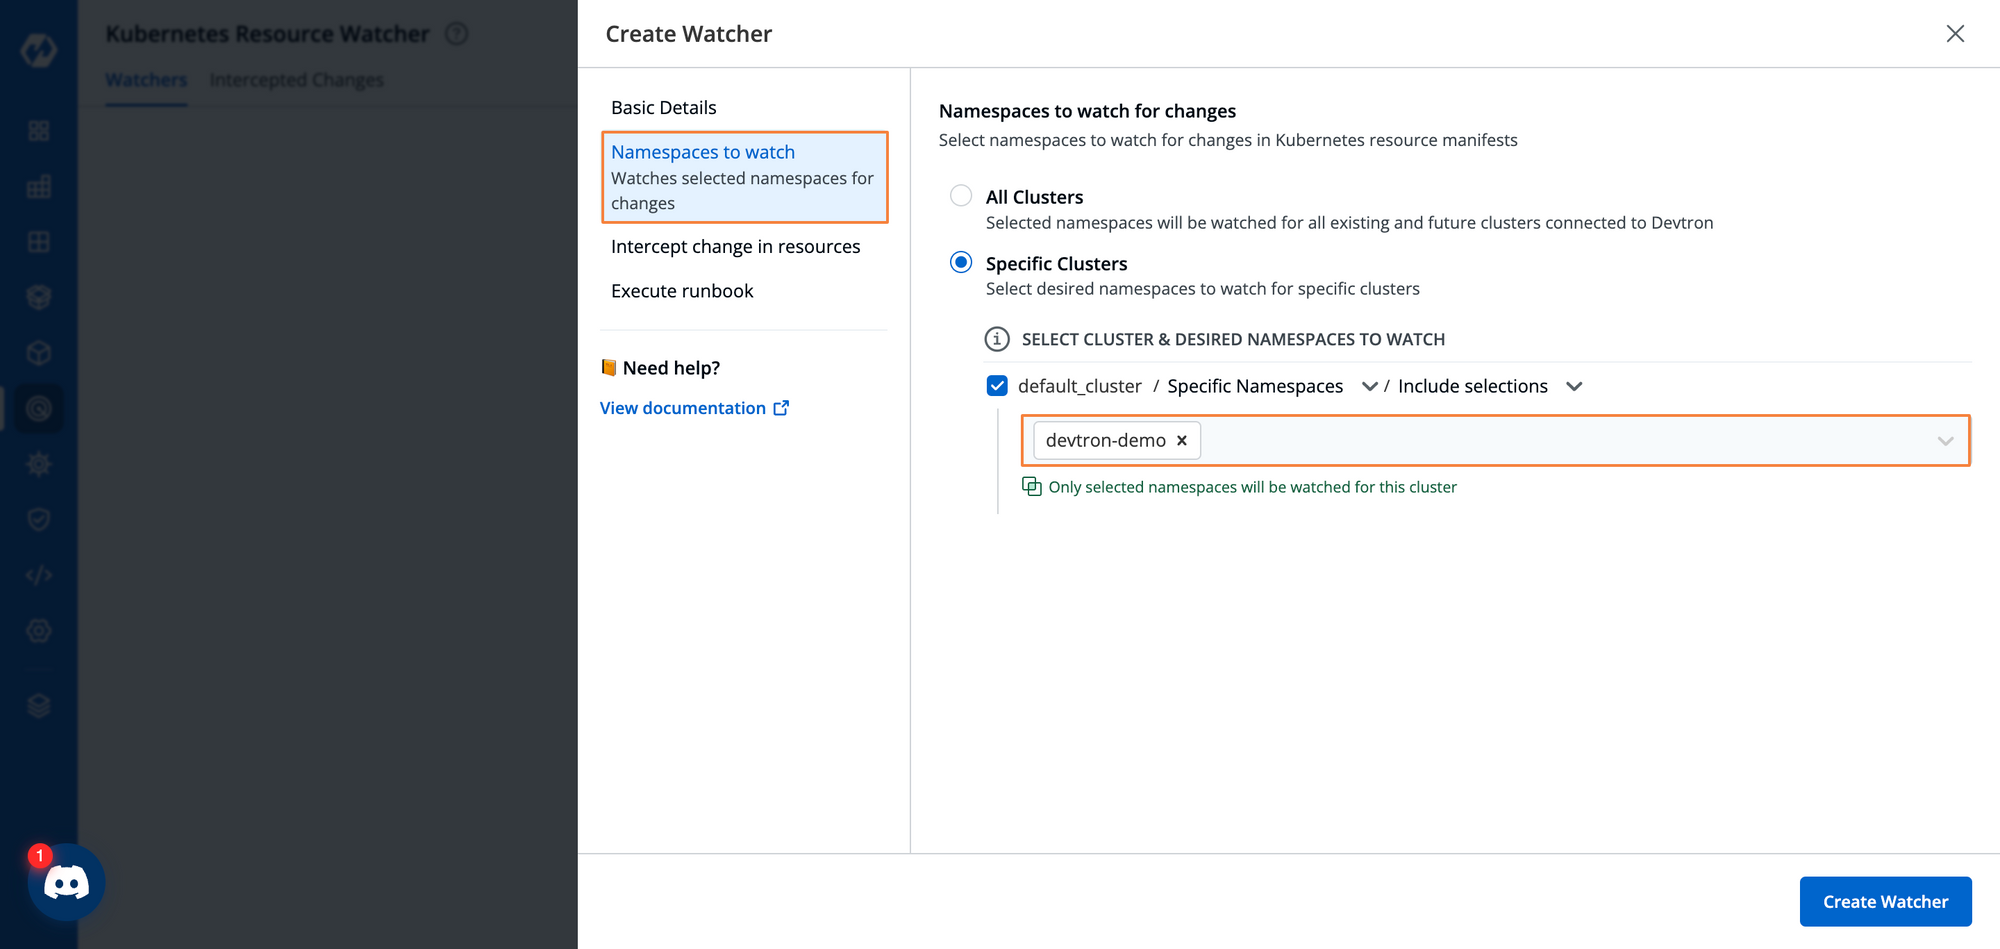
Step 3: Select the particular namespace where the resource that we want to watch exists. We can either watch all of the clusters connected to the Devtron instance i.e. all the namespaces Devtron has access to, or we can filter out specific namespaces.
Step 4: Define the particular resource that we want to watch. In this example, we are looking for the resource of a kind HorizontalPodAutoscaler. We can also define the type of action we want to watch for i.e. If the resource has been created, updated, or deleted.
For our purpose, the HPA will get updated every time the current number of pods changes, hence we will watch for any updates within the resource.
We can also define a certain condition to watch for within the resource. In this case, our condition is that the current replicas are equal to the maximum allowed replicas within the HPA. To set our conditions, we will be using CEL. CEL gives us a lot of flexibility to define certain conditions to watch for within the cluster resources. We can use the following CEL expression to define our conditions
DEVTRON_FINAL_MANIFEST.status.currentReplicas == DEVTRON_FINAL_MANIFEST.spec.maxReplicas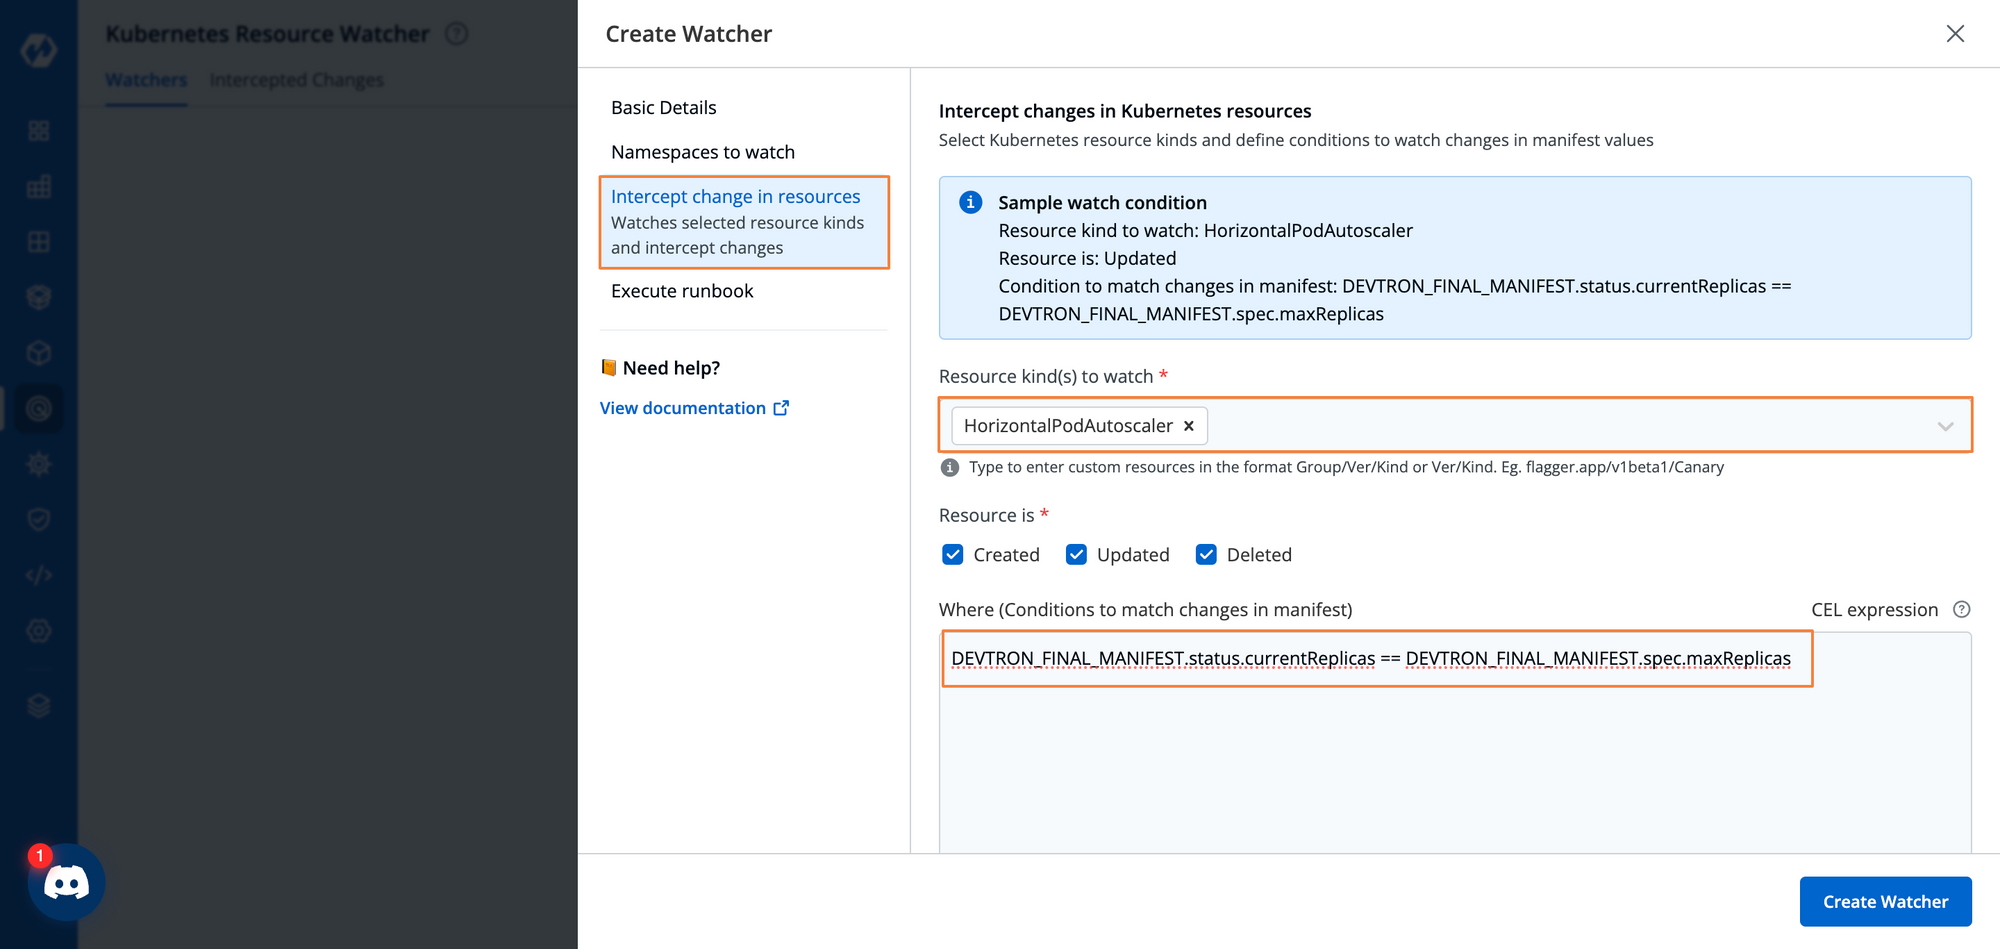
Devtron provides 2 unique CEL variables which are useful for creating custom conditions.
DEVTRON_INITIAL_MANIFEST: This allows you to access the properties of a resource before it has been changed by any entity.
DEVTRON_FINAL_MANIFEST: This allows you to access the properties of a resource after it has been changed. The change can be made by any entity, either by an automated script or a user.
Step 5: Assign a job for execution when a certain condition is met. So, we will provide the job we created earlier that will increase the maximum replicas by one when the condition is met.
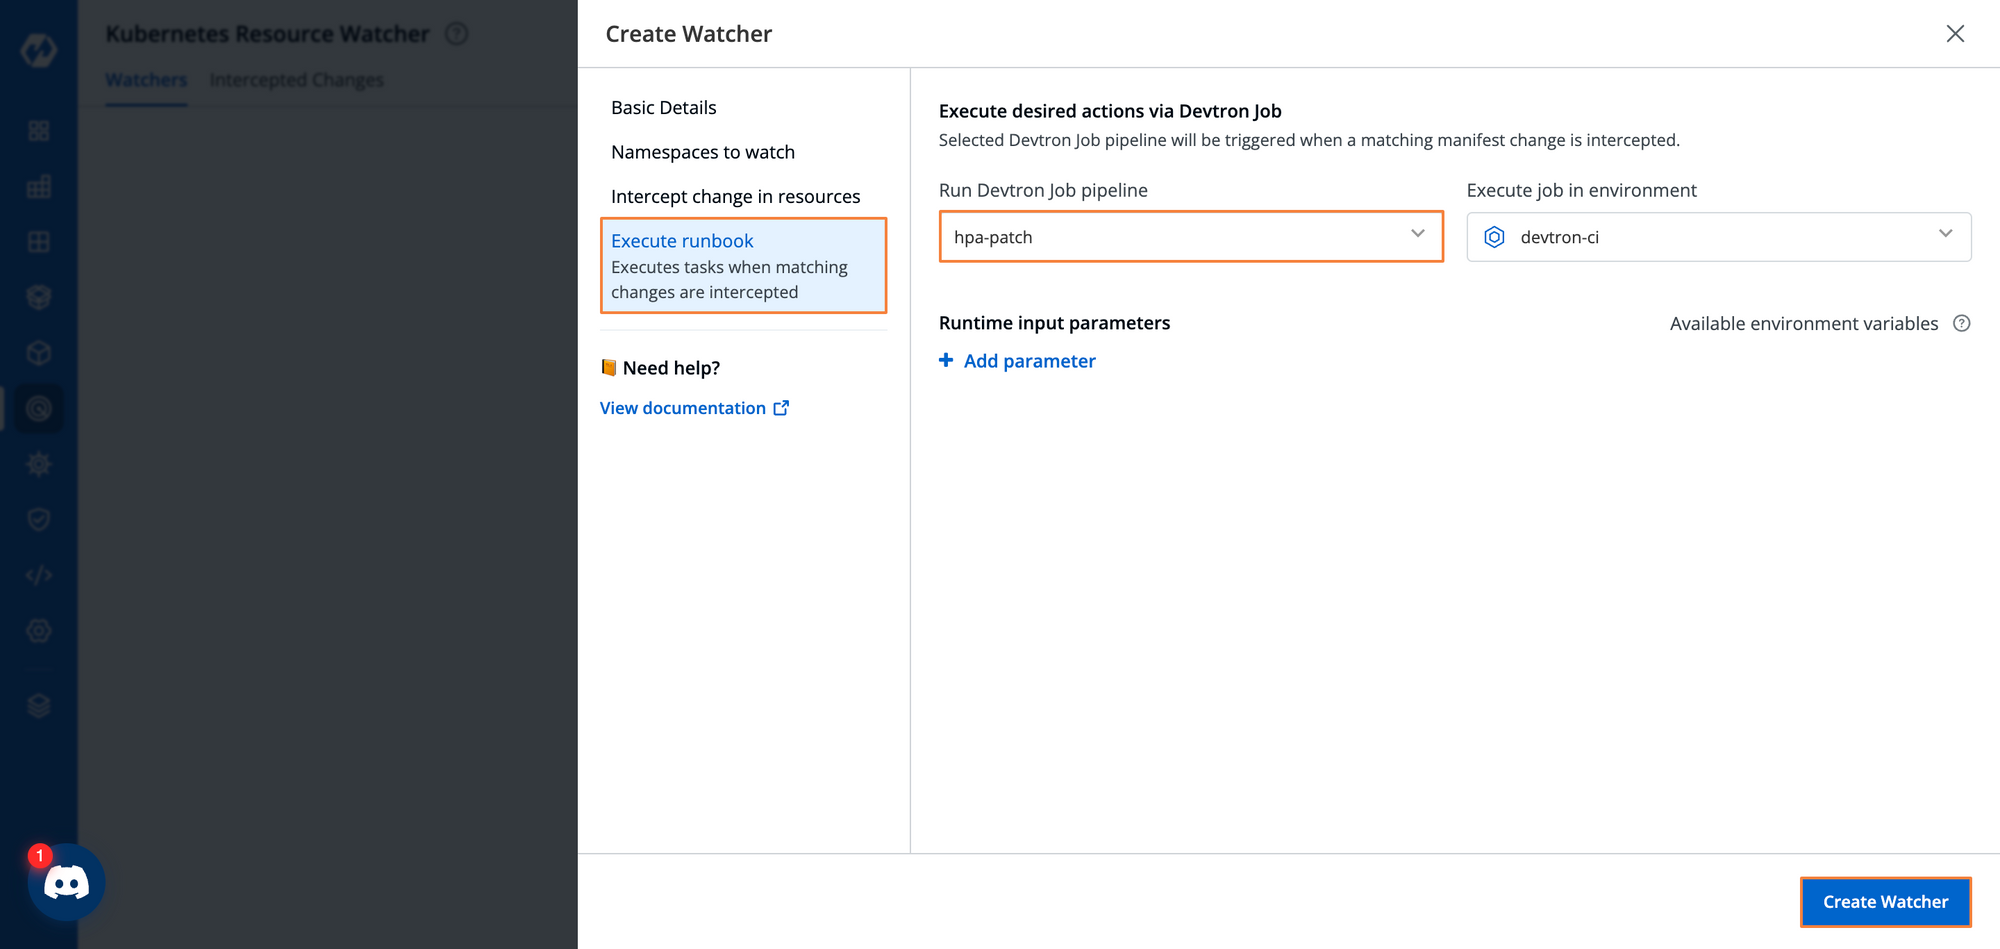
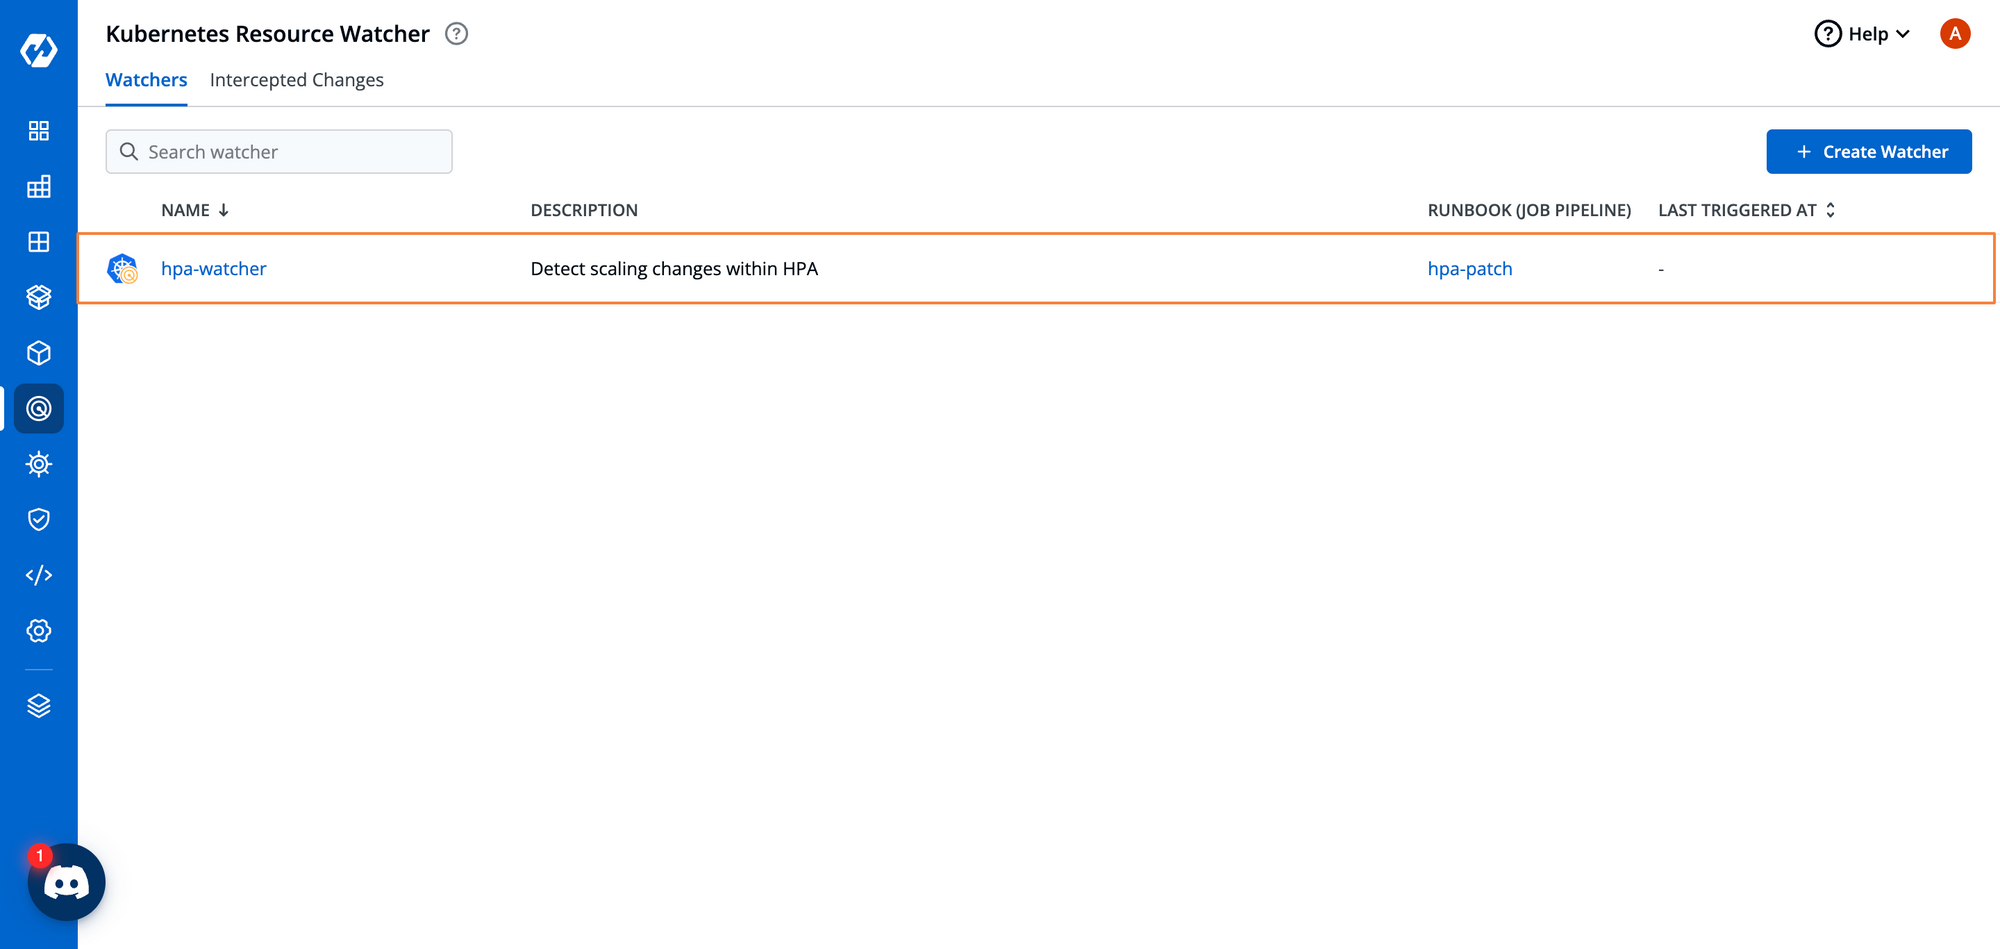
This created watcher will now constantly be observing the HPA resource, and in case the maximum limit is reached, the maximum number of pods will be increased by one.
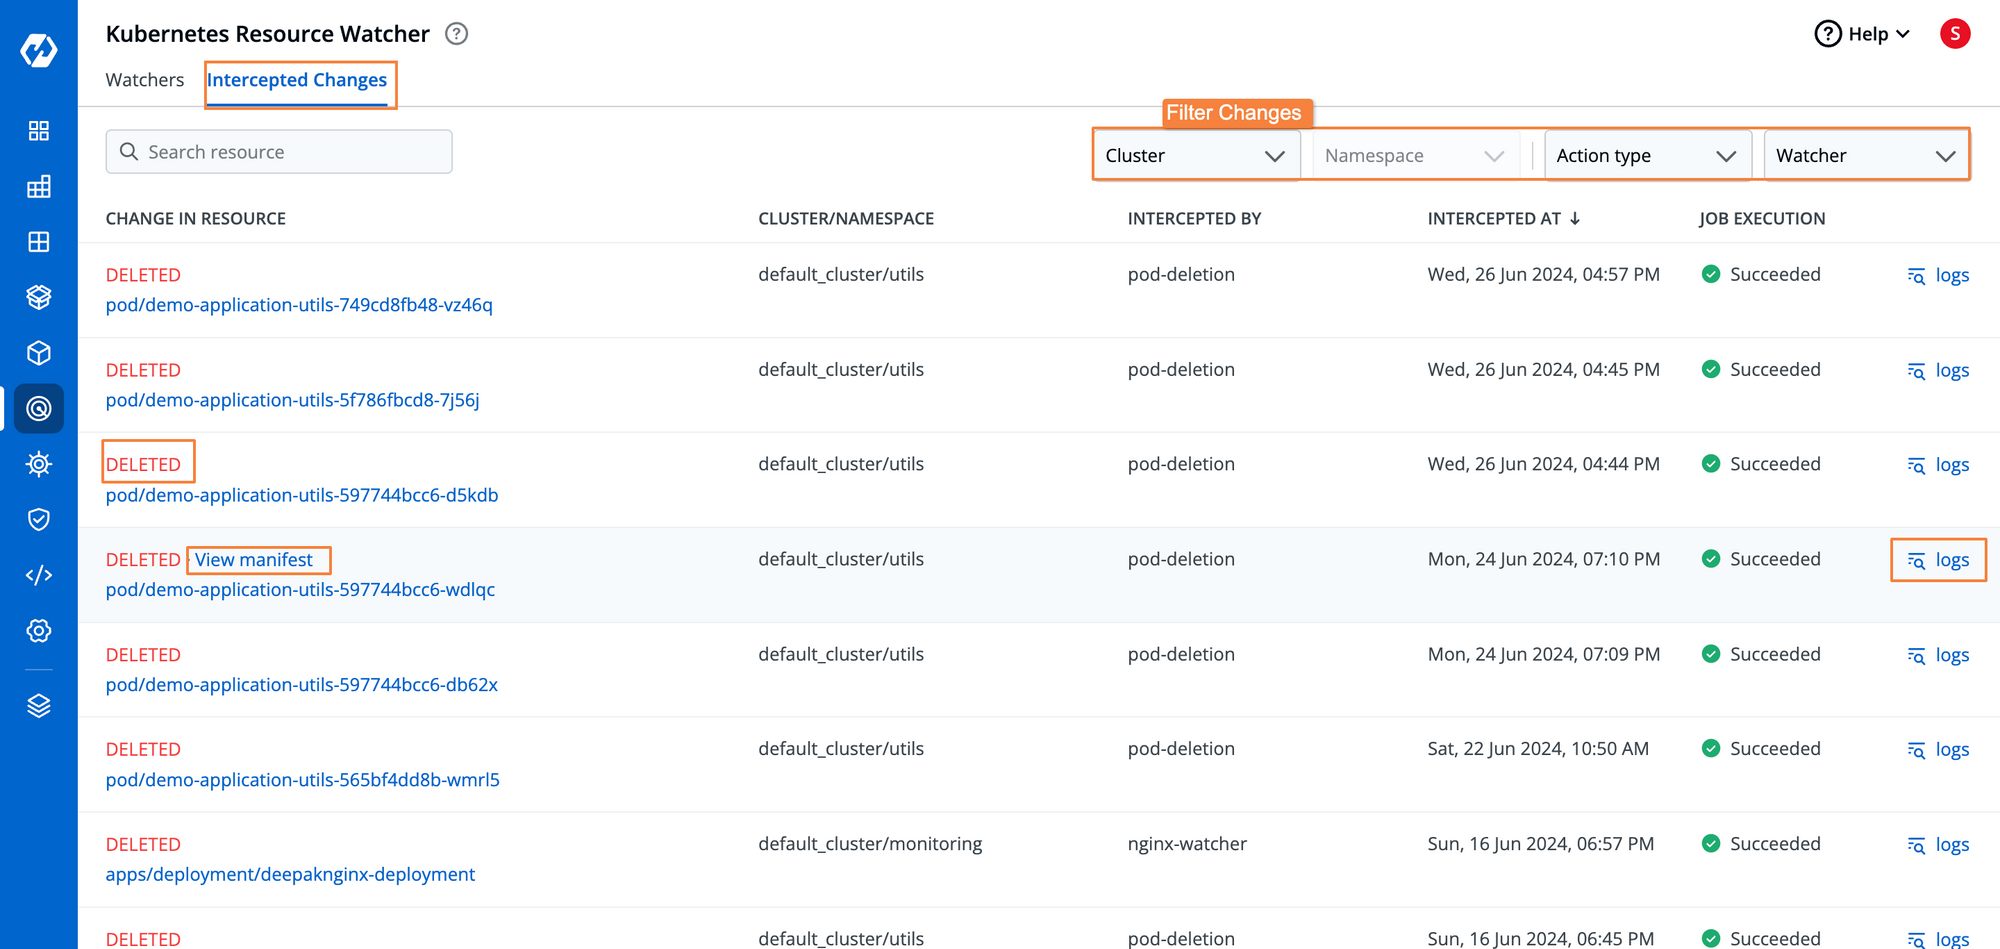
If the watcher detects any event within any of the resources, we can see the entire audit log for all the changes.
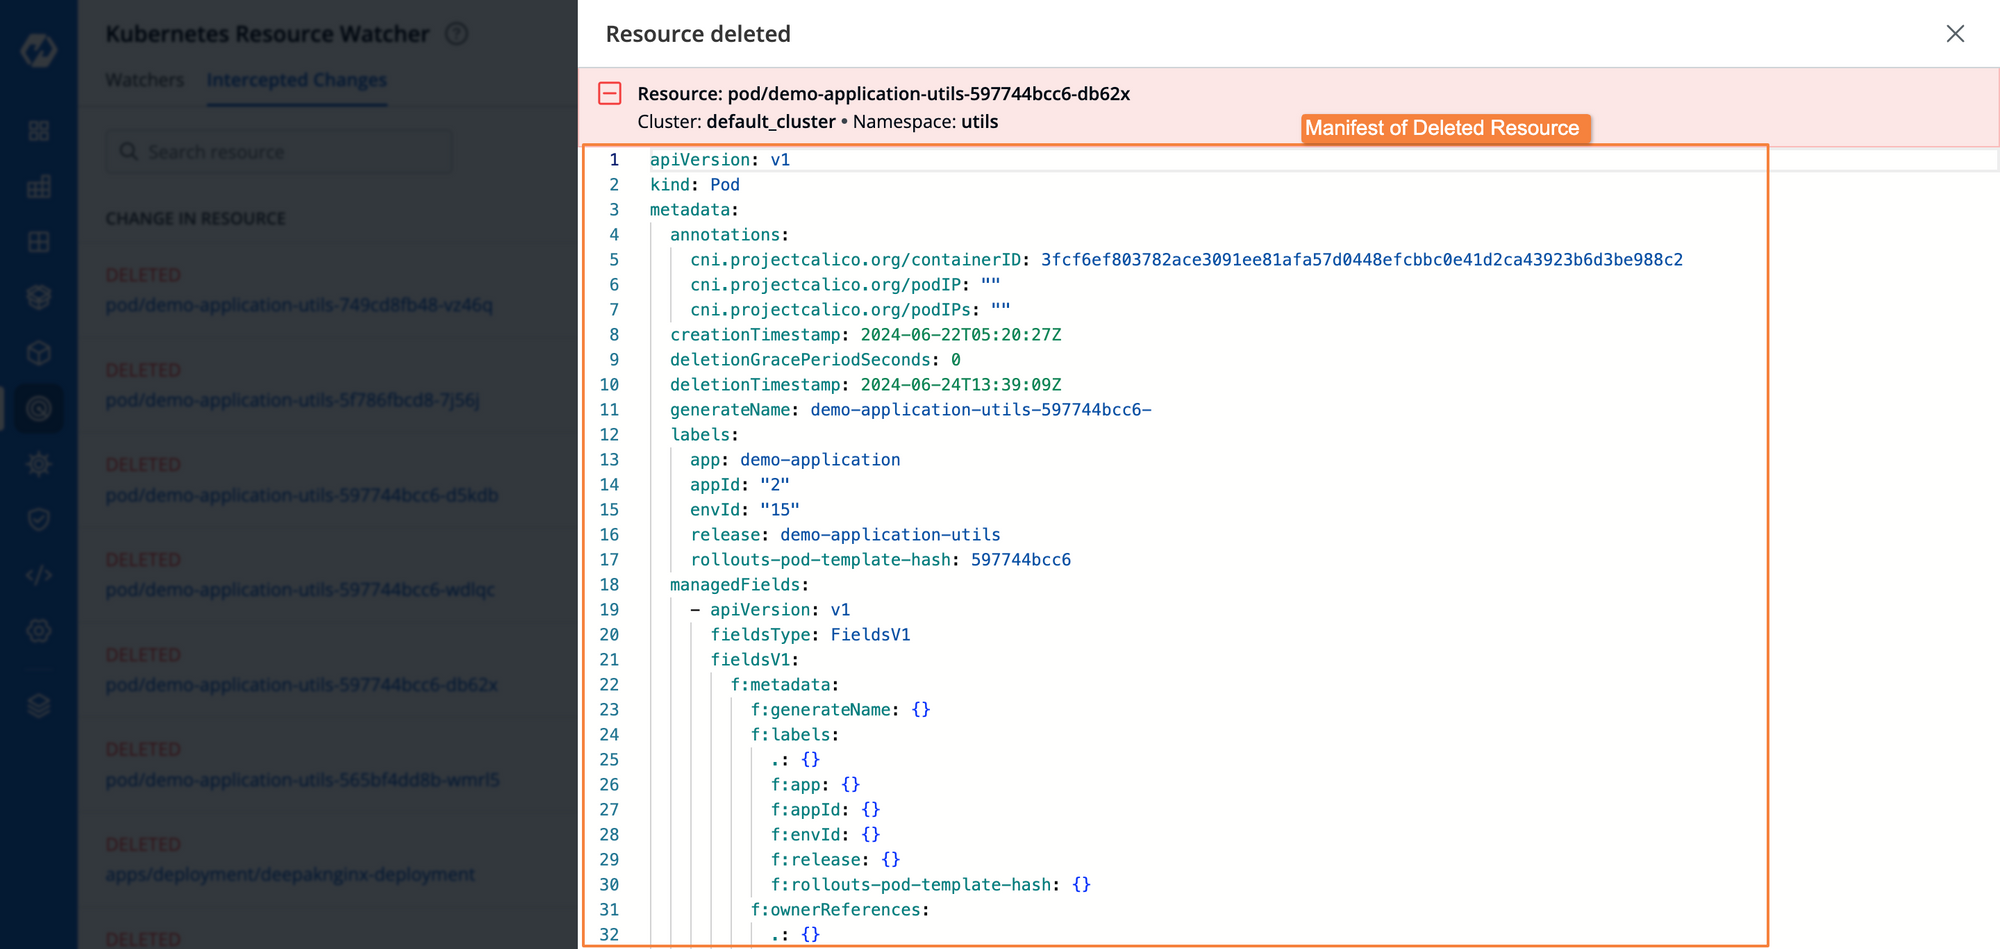
In case any manifest has been updated, we can also see the side-by-side comparisons of all the values that have been changed within the manifests of those resources
In this way, if the traffic of our applications increases suddenly, the problem will be automatically resolved without much intervention from a DevOps engineer, leading to swift remediation of such common issues.
Conclusion
Within Kubernetes, we often have a lot of common errors that can be fixed quite swiftly with a simple configuration change. However, whenever these problems occur, it can be quite a time-consuming and stressful process to determine where exactly the problem lies. For this kind of situation, having an entity to observe the state of the resources and make changes when certain conditions are met makes it a lot easier to resolve common issues such as an HPA scaling limit quickly.
Within Devtron, you can now leverage the power of the Resource Watcher and Kubernetes jobs to create an auto-remediation process for the common Kubernetes errors that you face. This will save developers from having to spend hours finding the problem and keep your users happy with stable performance and minimal service disruption.
If you have any queries feel free to connect with us or ask your queries in our actively growing Discord Community.

