1. KEDA enables event-driven autoscaling for Kubernetes workloads.
2. Scales pods from 0 to peak demand, reducing cloud costs.
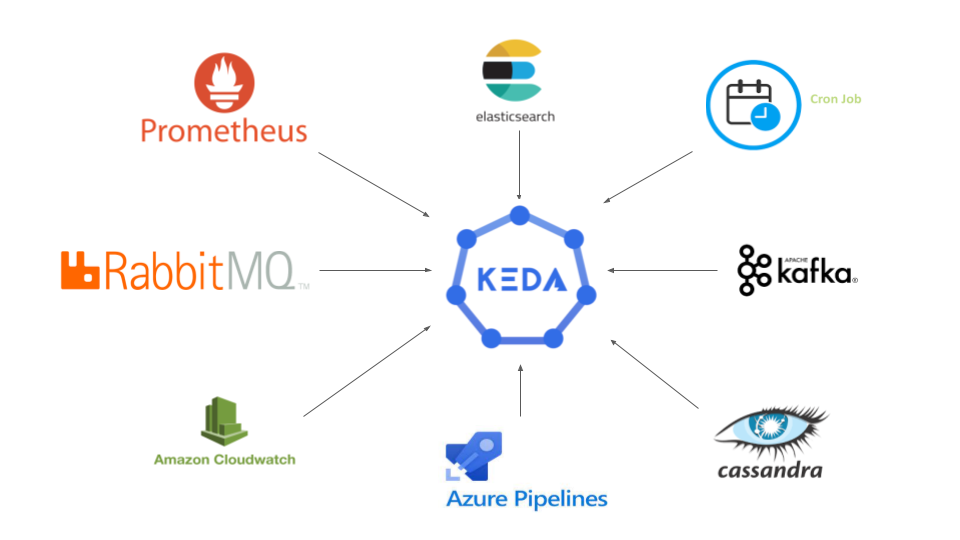
3. Supports 59+ event sources like Kafka, RabbitMQ, and Prometheus.
4. Integrates with HPA for more flexible scaling.
5. Devtron simplifies KEDA by offering a visual interface for configuring triggers, monitoring scaling events, and integrating with CI/CD pipelines.
What is KEDA Autoscaling?
KEDA (Kubernetes Event-Driven Autoscaler) is a lightweight, open-source component that enables horizontal pod autoscaling based on external event triggers. While HPA relies on CPU and memory metrics, KEDA listens to event sources like message queues, databases, and custom metrics to make smarter scaling decisions.
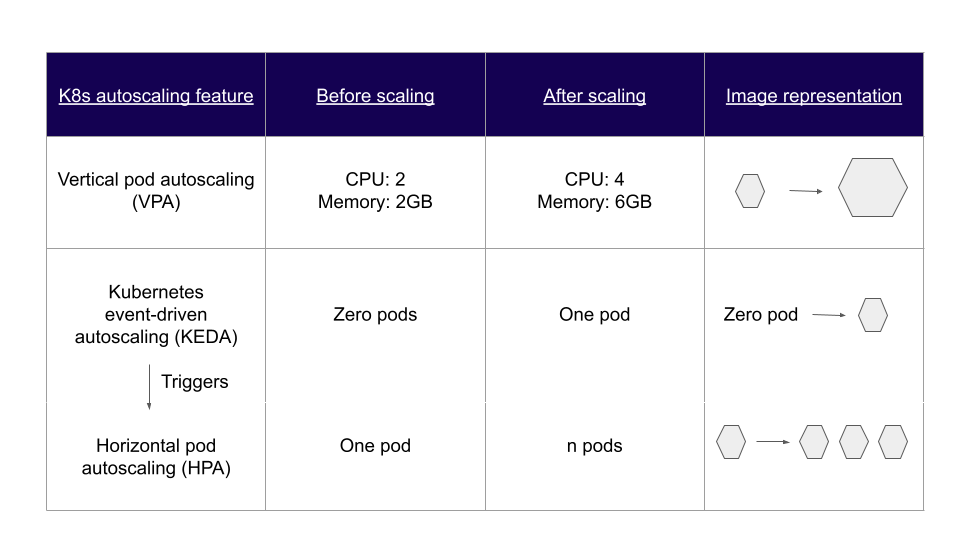
Built on top of Kubernetes HPA, KEDA scales pods based on signals from event sources like AWS SQS, Kafka, RabbitMQ, and more. These sources are tracked through KEDA scalers, which activate or deactivate deployments according to the defined rules. Scalers can also push custom metrics into the pipeline, enabling DevOps teams to track metrics that are most relevant to their application or infrastructure needs.
What problems does KEDA solve?
KEDA helps SREs and DevOps teams address several significant limitations of traditional Kubernetes autoscaling solutions:
Freeing up resources and reducing cloud cost:
KEDA scales down the number of pods to zero when there are no event requests to process. This level of granular control is difficult to achieve with standard HPA. As a result, KEDA ensures effective resource utilization, reduces unnecessary compute usage, and helps optimize cloud costs - making KEDA Autoscaling a more efficient alternative for event-driven workloads.
Interoperability with DevOps Toolchain
KEDA supports 59 built-in scalers and 4 external scalers, including KEDA HTTP and the Oracle DB Scaler. These enable efficient autoscaling for event-driven microservices such as payment gateways and order systems. Since KEDA can be extended to integrate with any external data source, it fits seamlessly into a wide range of DevOps toolchains, making it highly adaptable for modern engineering teams.
How KEDA Architecture and Components to Operate Efficiently
As mentioned earlier, KEDA works alongside Kubernetes HPA to deliver flexible autoscaling. Because of this architecture, KEDA only requires a few lightweight components to operate effectively in a Kubernetes cluster.
KEDA components
Refer to Fig. A and explore the core components that enable KEDA Autoscaling:
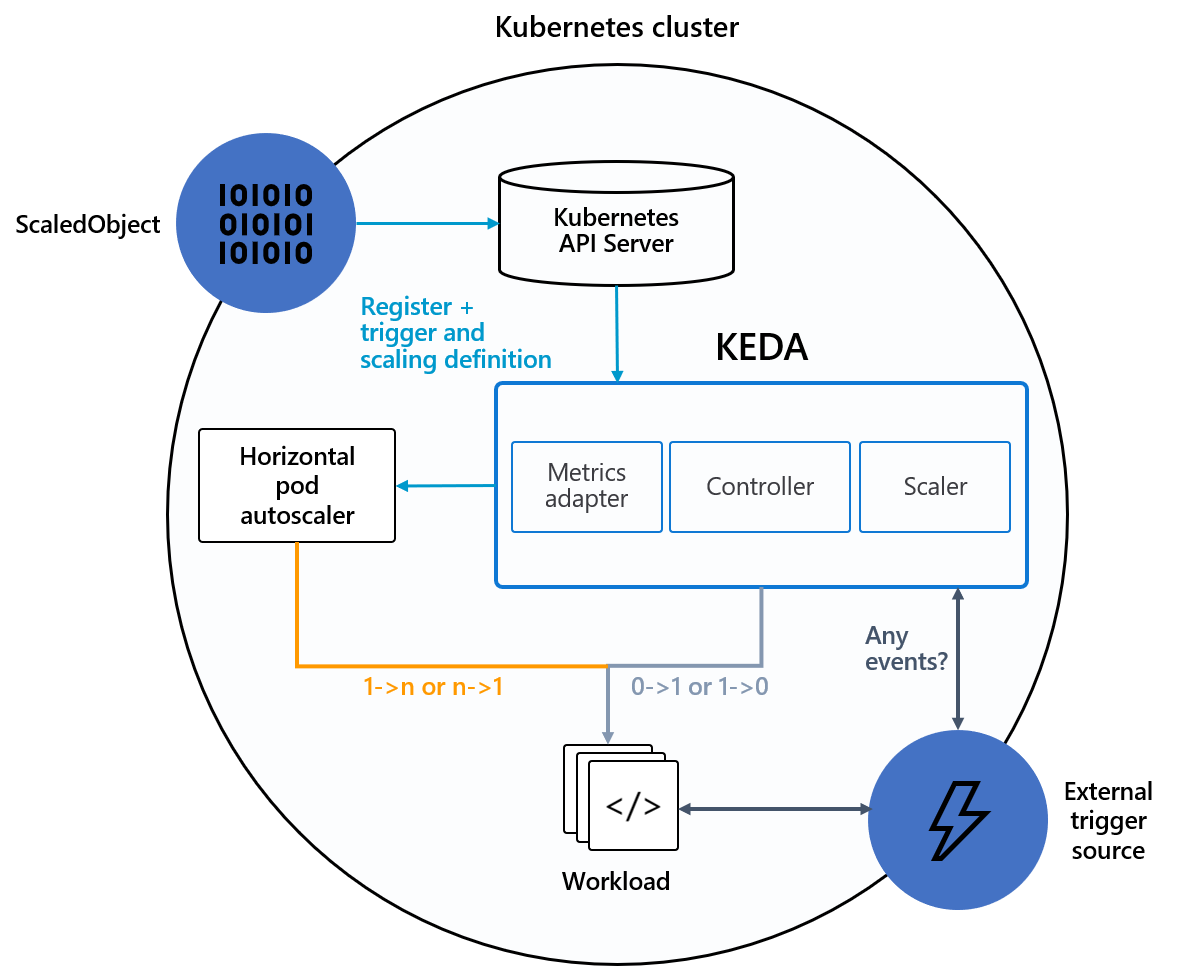
- Event Sources:These are external systems or services that emit metrics or triggers. Examples include Prometheus, RabbitMQ, and Apache Pulsar. KEDA uses these events to scale workloads dynamically.
- Scalers: Scalers monitor event sources and fetch the relevant metrics. Based on these metrics, they determine when to scale Kubernetes Deployments or Jobs.
- Metrics Adapter: This component acts as a translator, converting metrics from scalers into a format understood by Kubernetes HPA or controller components.
- Controller: The controller (or operator) processes metrics via the adapter and adjusts the number of replicas according to the rules defined in a ScaledObject.
KEDA CRDs
KEDA defines four Custom Resource Definitions (CRDs) that facilitate event-driven autoscaling:
- ScaledObject: This CRD maps event sources to Kubernetes workloads like Deployments, StatefulSets, or Jobs. It defines the rules for how a resource should scale.
- ScaledJob: Similar to ScaledObject, but specifically designed for Kubernetes Jobs.
Example: ScaledObject Using Prometheus Metrics
Below is a sample ScaledObject that configures KEDA Autoscaling using Prometheus metrics to scale a Kubernetes rollout:
apiVersion: keda.sh/v1alpha1
kind: ScaledObject
metadata:
  name: prometheus-scaledobject
  namespace: demo3
spec:
  scaleTargetRef:
    apiVersion: argoproj.io/v1alpha1
    kind: Rollout
    name: keda-test-demo3
  triggers:
    - type: prometheus
      metadata:
      serverAddress:  http://<prometheus-host>:9090
      metricName: http_request_total
      query: envoy_cluster_upstream_rq{appId="300", cluster_name="300-0", container="envoy", namespace="demo3", response_code="200" }
      threshold: "50"
  idleReplicaCount: 0
  minReplicaCount: 1
  maxReplicaCount: 10
- This configuration enables KEDA to scale from 0 to 10 replicas based on HTTP request volume.
- TriggerAuthentication and ClusterTriggerAuthentication manage secrets and credentials required to monitor external event sources securely.
How do KEDA components work?
Deploying KEDA on any Kubernetes cluster is easy, as it doesn’t require overwriting or duplicating existing functionality. Once deployed and the components are ready, event-based scaling begins from the external event source
The scaler continuously monitors for events defined in the ScaledObject. When a trigger condition is met, it passes metrics to the metrics adapter. The adapter reformats those metrics and forwards them to the controller, which then scales the workload up or down according to the rules defined in the ScaledObject.
KEDA activates or deactivates a deployment by scaling the number of replicas to zero or one, then hands off control to HPA to further scale from one to n based on available cluster resources.
This dynamic flow enables precise KEDA Autoscaling tailored to actual workload demands.
KEDA deployment and demo
KEDA can be deployed in a Kubernetes cluster using Helm charts, the OperatorHub, or manual YAML declarations. Below is the method using Helm to install KEDA:
#Adding the Helm repo
helm repo add kedacore https://kedacore.github.io/charts

#Update the Helm repo
helm repo update

#Install Keda helm chart
kubectl create namespace keda
helm install keda kedacore/keda --namespace keda
To verify if the KEDA Operator and Metrics API server are running after deployment, use:
kubectl get pod -n kedaWatch the demo video below to see KEDA Autoscaling in action. The hands-on example uses a sample application called TechTalks and leverages RabbitMQ as the message broker to trigger event-based autoscaling.
Integrate KEDA in CI/CD pipelines.
KEDA makes autoscaling of K8s workloads very easy and efficient. The vendor-agnostic approach of KEDA ensures flexibility in terms of event sources. It can help DevOps and SRE teams optimize the cost and resource utilization of their Kubernetes cluster by scaling up or down based on event sources and metrics of their choice.
Integrating KEDA in CI/CD pipelines enables DevOps teams to quickly respond to trigger events in their application’s resource requirements, further streamlining the continuous delivery process. And KEDA supports events generated by different workloads such as StatefulSet, Job, Custom Resource, and Job. All these help reduce downtime and improve the applications' efficiency and user experience.
Hands-on With KEDA Autoscaling
Explore real-world examples of KEDA Autoscaling in action using popular event sources like Kafka, Prometheus, and AWS ALB—demonstrating how KEDA dynamically adjusts workloads based on actual application demand.
Autoscaling using Kafka Lag
Kafka is a distributed message streaming platform that uses a publish and subscribe mechanism to stream the records or messages. For horizontal pod autoscaling, we will use KEDA's readily available Kafka scaler to achieve auto-scaling needs—such as starting a job as soon as possible when the request is received, cost-effectively, and eliminating or shutting down all unnecessary jobs.
Read here on how you can use Kafka Lag for autoscaling.
Autoscaling using Prometheus metrics
Prometheus is an open-source tool used for metrics-based monitoring and alerting. It offers a simple yet powerful data model and a query language (PromQL). With the right query, Prometheus provides detailed and actionable metrics, allowing teams to analyze application performance.
Using these metrics, we can define autoscaling triggers with KEDA, enabling dynamic scaling in Kubernetes environments based on real-time application insights.
Read more on how to implement KEDA for autoscaling using Prometheus.
Autoscaling using ALB metrics
An Application Load Balancer (ALB) distributes incoming traffic among multiple applications, typically routing HTTP and HTTPS requests to specific targets such as Amazon EC2 instances, containers, or IP addresses.
ALB publishes data points to AWS CloudWatch, where they are tracked as time-ordered metrics. Using these ALB metrics, we can configure KEDA Autoscaling to automatically scale application workloads based on traffic patterns and load distribution.
Read more on how to implement KEDA for autoscaling using ALB Metrics.
How Devtron Simplifies KEDA Autoscaling
Managing KEDA manually often requires creating multiple YAML files for ScaledObject, ScaledJob, and trigger configurations. Devtron eliminates this complexity by providing:
- Visual KEDA Integration in Deployment Template
- Configure
kedaAutoscalingdirectly from the Devtron UI. - Set min/max replicas, idle replica count, and scaling thresholds without writing CRDs.
- Configure
- Pre-Built Trigger Support
- Quickly attach triggers for Prometheus metrics, Kafka lag, HTTP/ALB traffic, AWS SQS, and more via the dashboard.
- Supports 59+ native scalers and external scalers through the UI.
- Real-Time Monitoring & Logs
- View scaling events, active replicas, and historical metrics in one dashboard.
- No need to check KEDA pods or kubectl logs for troubleshooting.
- Seamless CI/CD Integration
- Combine event-driven autoscaling with existing Devtron deployment pipelines.
- Reduces manual interventions and enables cost-efficient, hands-off scaling.
FAQ
What is KEDA Autoscaling?
KEDA Autoscaling refers to event-driven scaling in Kubernetes using external triggers like message queues, custom metrics, or cloud monitoring data. It enables scaling beyond CPU/memory metrics, including the ability to scale down to zero pods.
How does KEDA differ from HPA in Kubernetes?
KEDA extends Kubernetes HPA by allowing autoscaling based on external events (like Kafka lag or Prometheus metrics). HPA only works with CPU and memory, while KEDA supports 50+ scalable event sources.
Can KEDA scale down to zero?
Yes. One of KEDA’s major benefits is its ability to scale workloads down to zero replicas when no activity is detected — reducing idle resource usage and saving cloud costs.
What are KEDA Scalers?
Scalers are components in KEDA that monitor external event sources (like RabbitMQ, Prometheus, AWS SQS, etc.) and push metrics to trigger autoscaling actions based on custom thresholds.
Is it easy to integrate KEDA with CI/CD pipelines?
Absolutely. KEDA is flexible, vendor-neutral, and can easily be integrated into DevOps workflows and CI/CD pipelines — especially with platforms like Devtron that offer built-in visibility and no-code scaling configuration.

