Kubernetes has become a de facto standard as an orchestration tool for containerized applications, it has changed the way organizations deploy, manage, and scale their services across regions. Some advanced features of Kubernetes that make this possible are Portability, Efficiency, Scalability, Automated Rollbacks, and Self-Healing.
While Kubernetes provides powerful capabilities for scaling and managing services, it becomes complex for teams as they start to scale their operations from single Kubernetes clusters to multiple Kubernetes clusters. This complexity often leads to new operational challenges for teams, particularly when traditional practices and tools (command-line tool (CLI) like kubectl) are employed to manage Kubernetes.
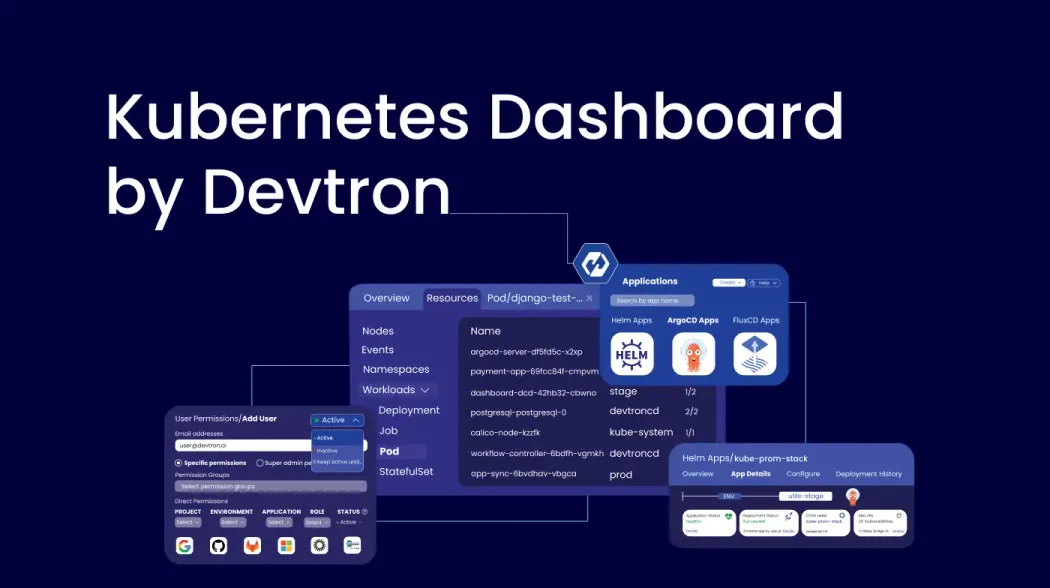
The Kubernetes Dashboard, a UI for managing Kubernetes, comes in handy to address the operational challenges of Kubernetes at scale and enable teams to operate efficiently and effectively. In this blog, we will explore the Kubernetes Dashboard and look at the Modern Kubernetes Dashboard offered by Devtron, focusing on its advanced capabilities and how we can quickly adapt to using it.
Why Kubernetes Dashboard?
As organizations adopt Kubernetes to achieve scale, efficiency, and high availability for their services, they often encounter complexities at certain scales where Kubernetes itself becomes a challenge for scaling. Managing multiple Kubernetes clusters spread across multiple regions using only CLI tools like 'kubectl' becomes tedious and error-prone for teams, as teams have to go through several challenges like:
- Limited visibility across multiple Kubernetes clusters and their workloads.
- The manual and repetitive tasks increase operational overhead and the risk of errors.
- Complex access control management affecting security and collaboration.
- Inefficient root-cause analysis and problem-resolution processes.
- Complex configuration management that leads to configuration drifts and unexpected downtime.
Moreover, managing applications across multiple Kubernetes clusters presents a significant challenge for teams. While tools like Helm, ArgoCD, and FluxCD excel in deploying applications, post-deployment management is primarily conducted through command-line interface (CLI) tools. ArgoCD stands out by offering a dashboard, which has its advantages and disadvantages.
For example, when developers test an application deployed via Helm, they use the CLI tool to initiate the deployment. However, after executing the helm apply command, the developer lacks visibility into the deployment process, such as whether the application is being deployed successfully or if any pods are restarting unexpectedly. Moreover, the real challenge for developers is waiting for post-deployment. When developers need to debug or troubleshoot issues in Kubernetes environments, they face significant hurdles and have to navigate the intricacies of Kubernetes.
What is the Kubernetes Dashboard?
The default Kubernetes dashboard is a centralized management platform that enables teams to gain visibility for the Kubernetes cluster through a simplified UI. It abstracts the complexities of CLI tools that lack visibility, have error-prone operations, and require multiple context switching. The Kubernetes dashboard helps teams like DevOps, SRE, and Operations to efficiently manage their Kubernetes clusters through an intuitive interface that simplifies resource creation and modification. By abstracting the complexities of CLI tools it provides application visibility and capabilities like editing existing resources and creating new ones. To read more about the Kubernetes dashboard refer to this blog.
While the default Kubernetes Dashboard provides visibility for our cluster, it falls short when providing operational efficiency for teams to manage multiple Kubernetes clusters. Some of the key limitations of the default Kubernetes Dashboard are:
- The default Kubernetes dashboard is designed to manage a single Kubernetes cluster, so managing an entire dashboard for each Kubernetes cluster becomes an overhead and tedious task.
- The default dashboard lacks intuitive interfaces for managing Role-Based Access Control (RBAC), making it difficult to implement and maintain fine-grained access policies
- The Kubernetes dashboard provides only basic troubleshooting support for developers, such as viewing logs and manifests. However, it lacks integrated terminal-like functionality, which is required to perform actual troubleshooting and debugging activities. Developers have to rely on CLI tools like ‘kubectl,’ where again, they have to deal with the intricacies of Kubernetes.
- When managing applications over a Kubernetes cluster (Helm, ArgoCD, FluxCD) the default Kubernetes dashboard does not provide inbuilt or extended support.
- The dashboard does not provide audit logs or reports detailing actions taken within the cluster, such as who deployed what and when. This lack of visibility can hinder compliance and accountability efforts
Devtron's Kubernetes Dashboard
Devtron is an open-source platform that helps you manage your multiple Kubernetes clusters at scale through a single interface. The Modern Kubernetes Dashboard of Devtron provides an intuitive graphical interface with advanced features, giving you 360-degree visibility across multiple Kubernetes clusters while enhancing operational efficiency. Let’s look at its capabilities and how Devtron Kubernetes Dashboard can help you manage Kubernetes clusters and accelerate your journey.
Features of Devtron’s Kubernetes Dashboard
Visibility for Multiple Kubernetes Clusters
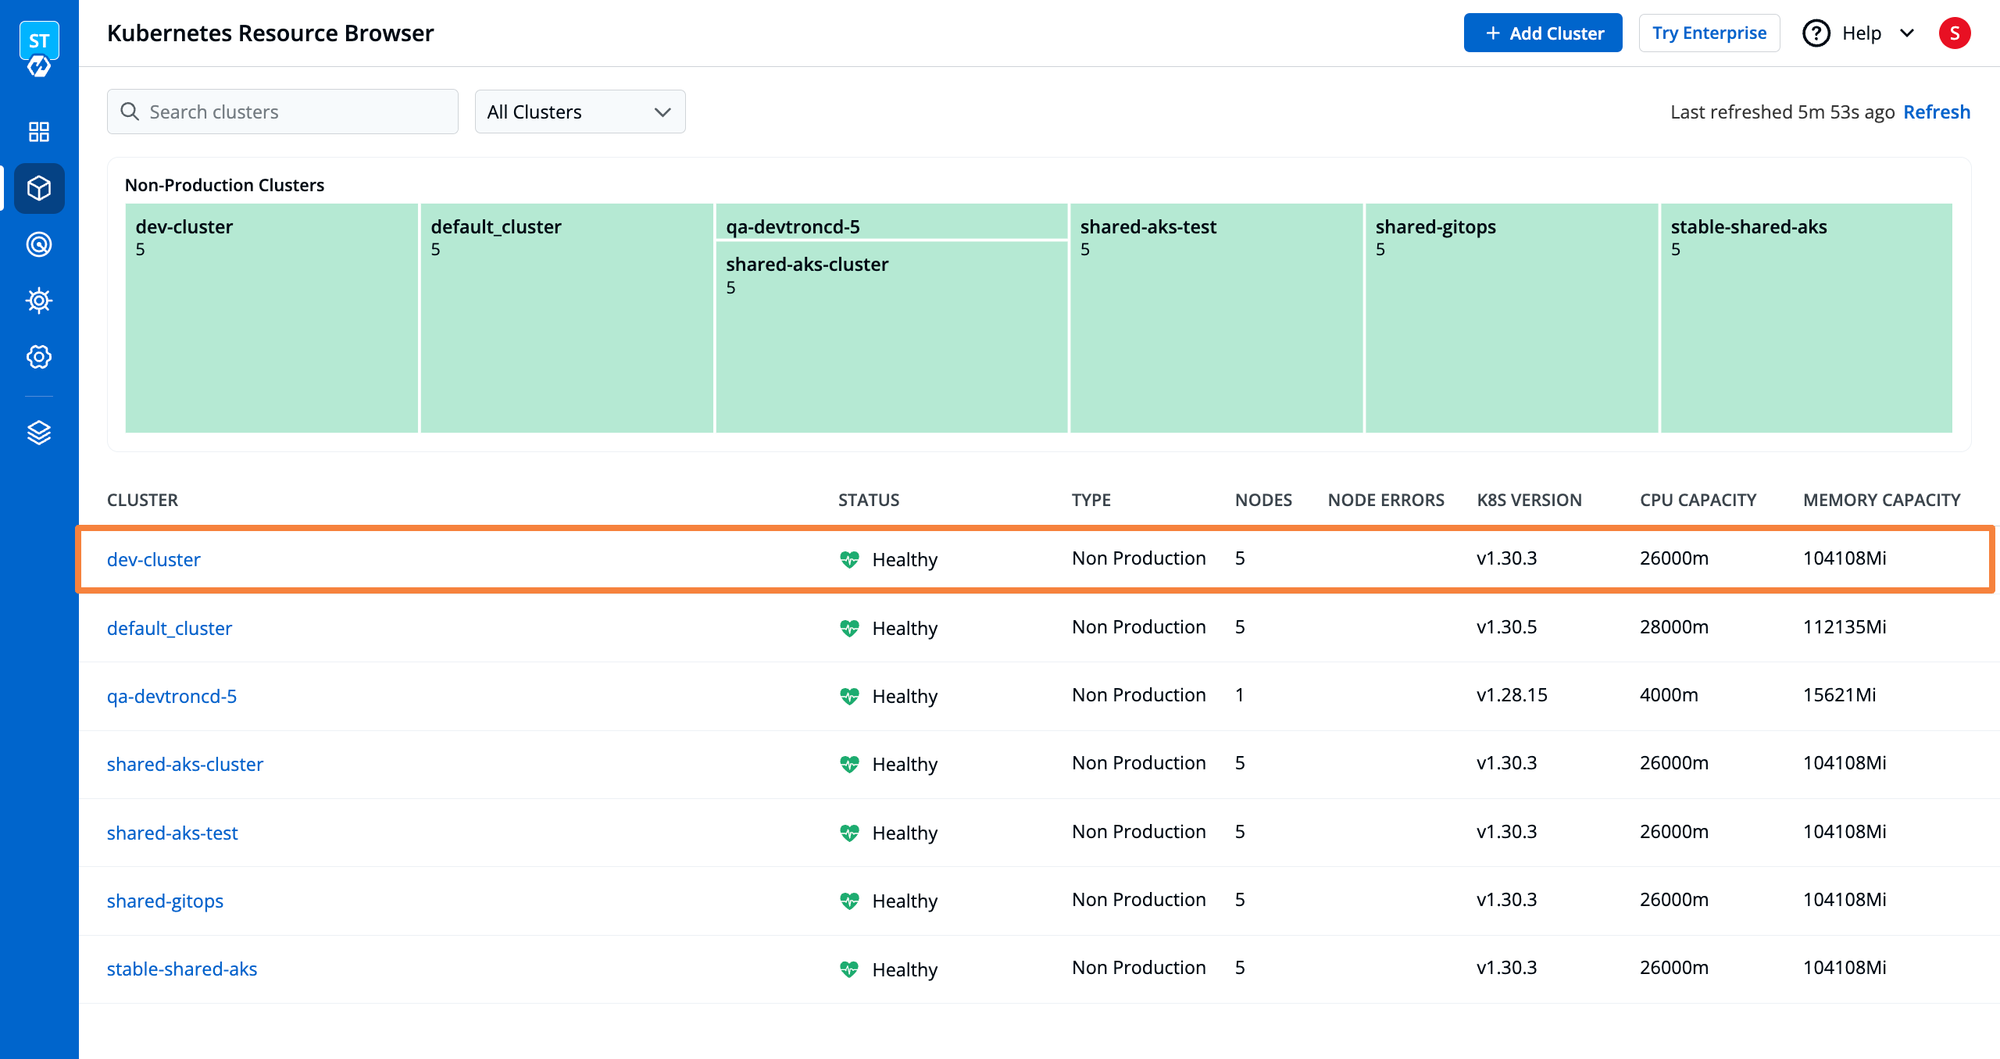
The Modern Kubernetes Dashboard of Devtron allows you to onboard multiple Kubernetes clusters and provides a single unified dashboard for all your Kubernetes clusters. The Resource Browser entity of Devtron lists out all the connected Kubernetes clusters and displays essential metrics like connection status, nodes, errors, K8s version, and resource capacity of each Kubernetes cluster.
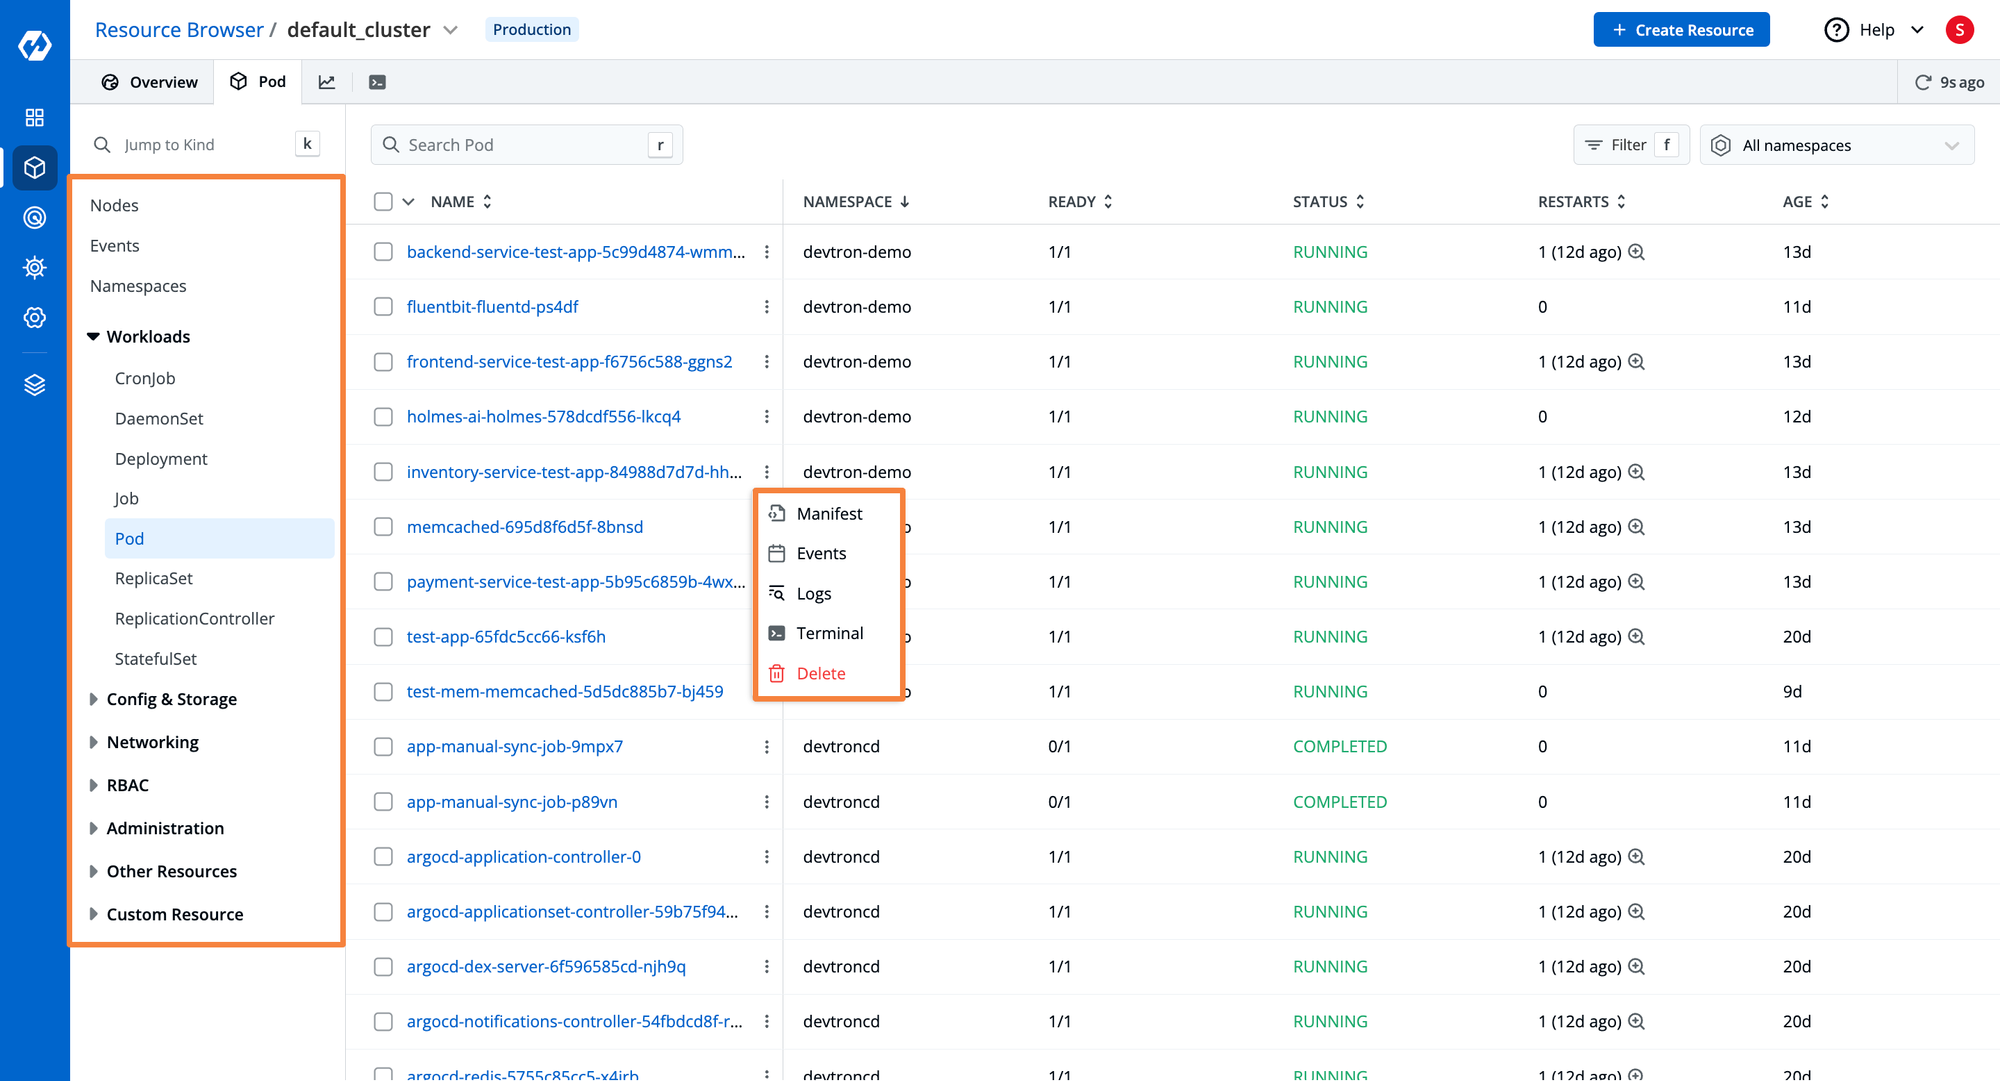
If you navigate to the specific Kubernetes cluster you can visualize all the Kubernetes workloads associated with that cluster and the capability to execute actions like visualizing and editing live Manifest, checking Events, Logs, and a dedicated Terminal for debugging specific pods.
Kubernetes Application Management
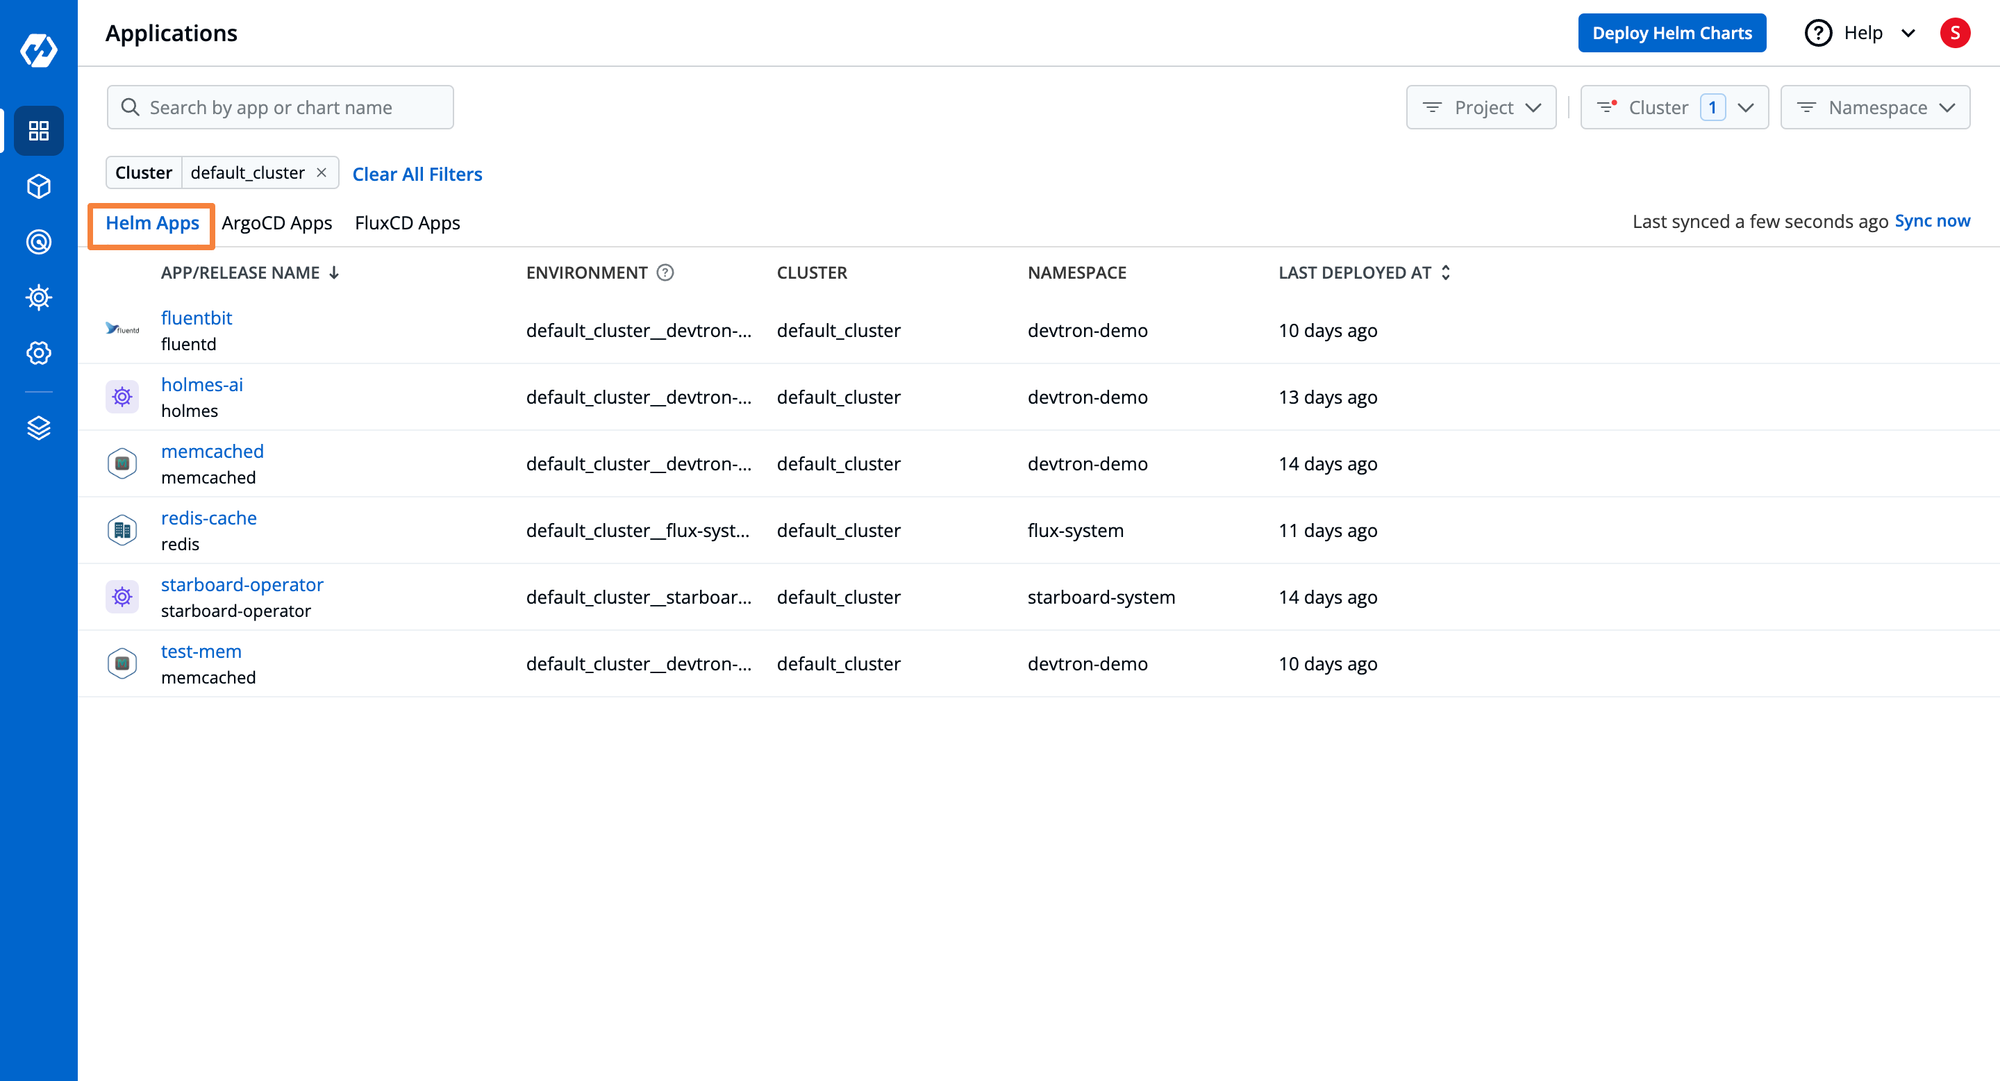
Devtron's Modern Kubernetes Dashboard addresses the challenge of managing applications over multiple Kubernetes clusters. The dashboard provides a 360-degree view of all applications deployed through Helm, ArgoCD, and FluxCD, these applications can be spread across multiple Kubernetes clusters. Moreover, it provides a marketplace for Helm charts i.e. Chart Store from where you can quickly configure and deploy applications to specific Kubernetes clusters.
Advance Debugging Capabilities
Once an application is deployed or even for existing applications within your Kubernetes clusters the Kubernetes Dashboard by Devtron offers a logical grouping of application workloads. This logical grouping enables teams to quickly trace issues and capabilities like log streaming, integrated terminal, event tracking, and live manifest editing. These features facilitate faster debugging and troubleshooting, helping teams to resolve issues more efficiently.
Configuration Management
The Devtron Kubernetes Dashboard tracks help you to track configuration drifts and enable single-click rollbacks. It also maintains a deployment history that shows all details of deployment with the user and the configurations used for it.
Fine-grained Resource Based Access Control (RBAC)
Security is paramount in any software environment, and the Kubernetes Dashboard by Devtron addresses this by providing a capability to configure a robust RBAC through a UI. The dashboard allows administrators to implement least-privileged access control by defining permission groups with specific roles and adding users accordingly. Developers can also generate API tokens with fine-grained RBAC attached, enabling secure CLI access to their application workloads without the need to share kubeconfig files. Read this blog to learn more about Devtron's RBAC.
Install Kubernetes Dashboard by Devtron: Quick Guide
Now that we've covered the theory, it's time to deep dive into Devtron's Kubernetes Dashboard. Let’s get hands-on and explore how effectively it manages Kubernetes clusters and applications.
Note: The only prerequisite for installing the Kubernetes Dashboard by Devtron is you need a Kubernetes cluster, it can be any Kubernetes cluster managed or self-managed (minikube, K3s, RKE2, or EKS, etc).
Step 1: Installation
- Once a Kubernetes cluster is up and running, execute the following commands to install Devtron’s dashboard.
helm repo add devtron https://helm.devtron.ai
helm repo update devtron
helm install devtron devtron/devtron-operator \
--create-namespace --namespace devtroncd
- Once the installation is complete, access the dashboard using the following command
kubectl get svc -n devtroncd devtron-service -o jsonpath='{.status.loadBalancer.ingress}'
- The username is admin and we need to run the following command to get the admin password
kubectl -n devtroncd get secret devtron-secret \ -o jsonpath='{.data.ADMIN_PASSWORD}' | base64 -d
Step 2: Onboarding a Kubernetes Cluster
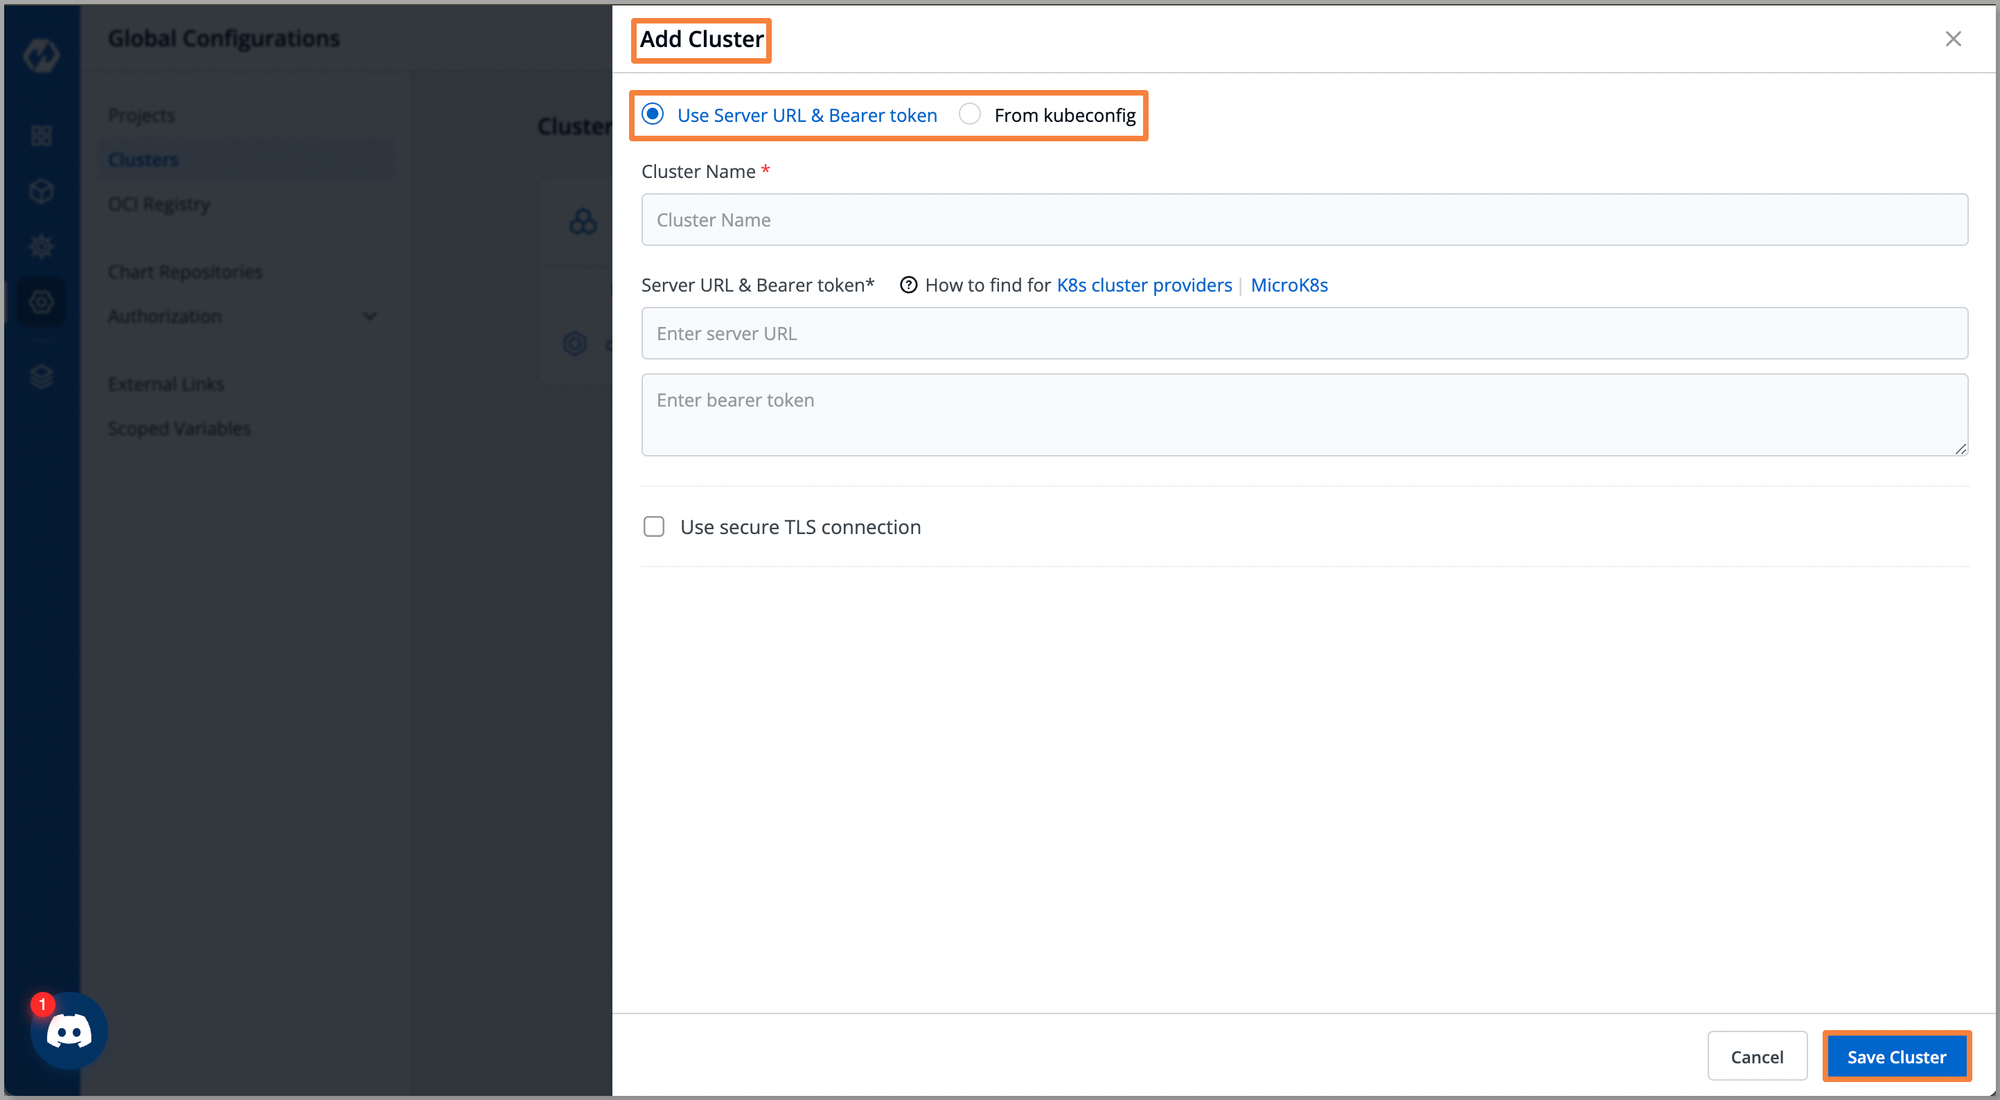
- To onboard a Kubernetes cluster to Devtron's Kubernetes dashboard, navigate to Global Configurations > Clusters > + Add Cluster.
- To add a Kubernetes Cluster, choose between two authentication methods: Use Server URL & Bearer token or From kubeconfig. Fill in the required fields, click Save Cluster and your Kubernetes cluster will be onboarded.
Step 3: Navigating Through the Kubernetes Cluster
- Now that our cluster is on-boarded on Devtron, navigate to the Resource Browser on the dashboard, and we can see the listing of all the Kubernetes clusters.
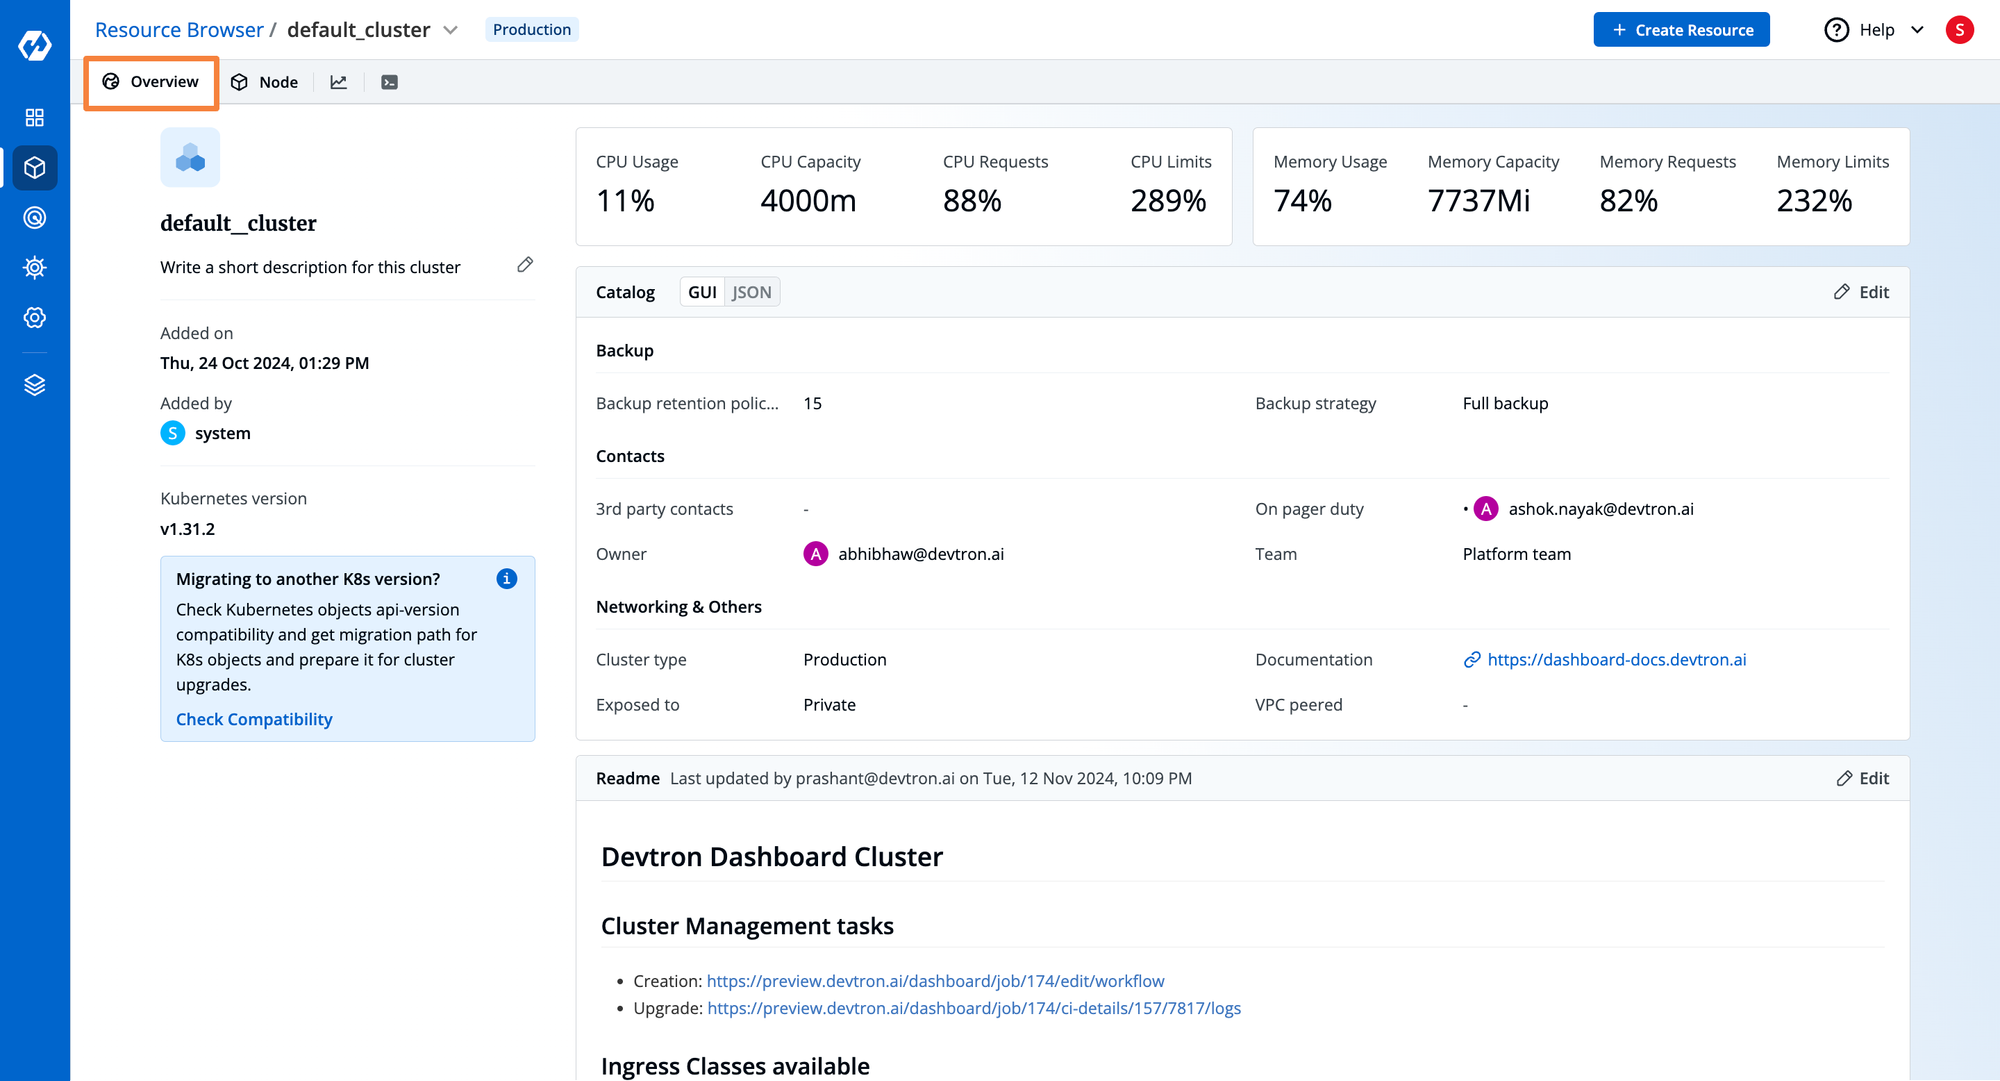
- Click the specific Kubernetes cluster to get an overview of the cluster. Where you can visualize information about the utilization and availability of assigned resources, the owner of the cluster, and a Readme file where you can describe the cluster.
- Click on Node to visualize all Kubernetes Components such as Nodes, Namespaces, Workloads, Configurations, and Storage.
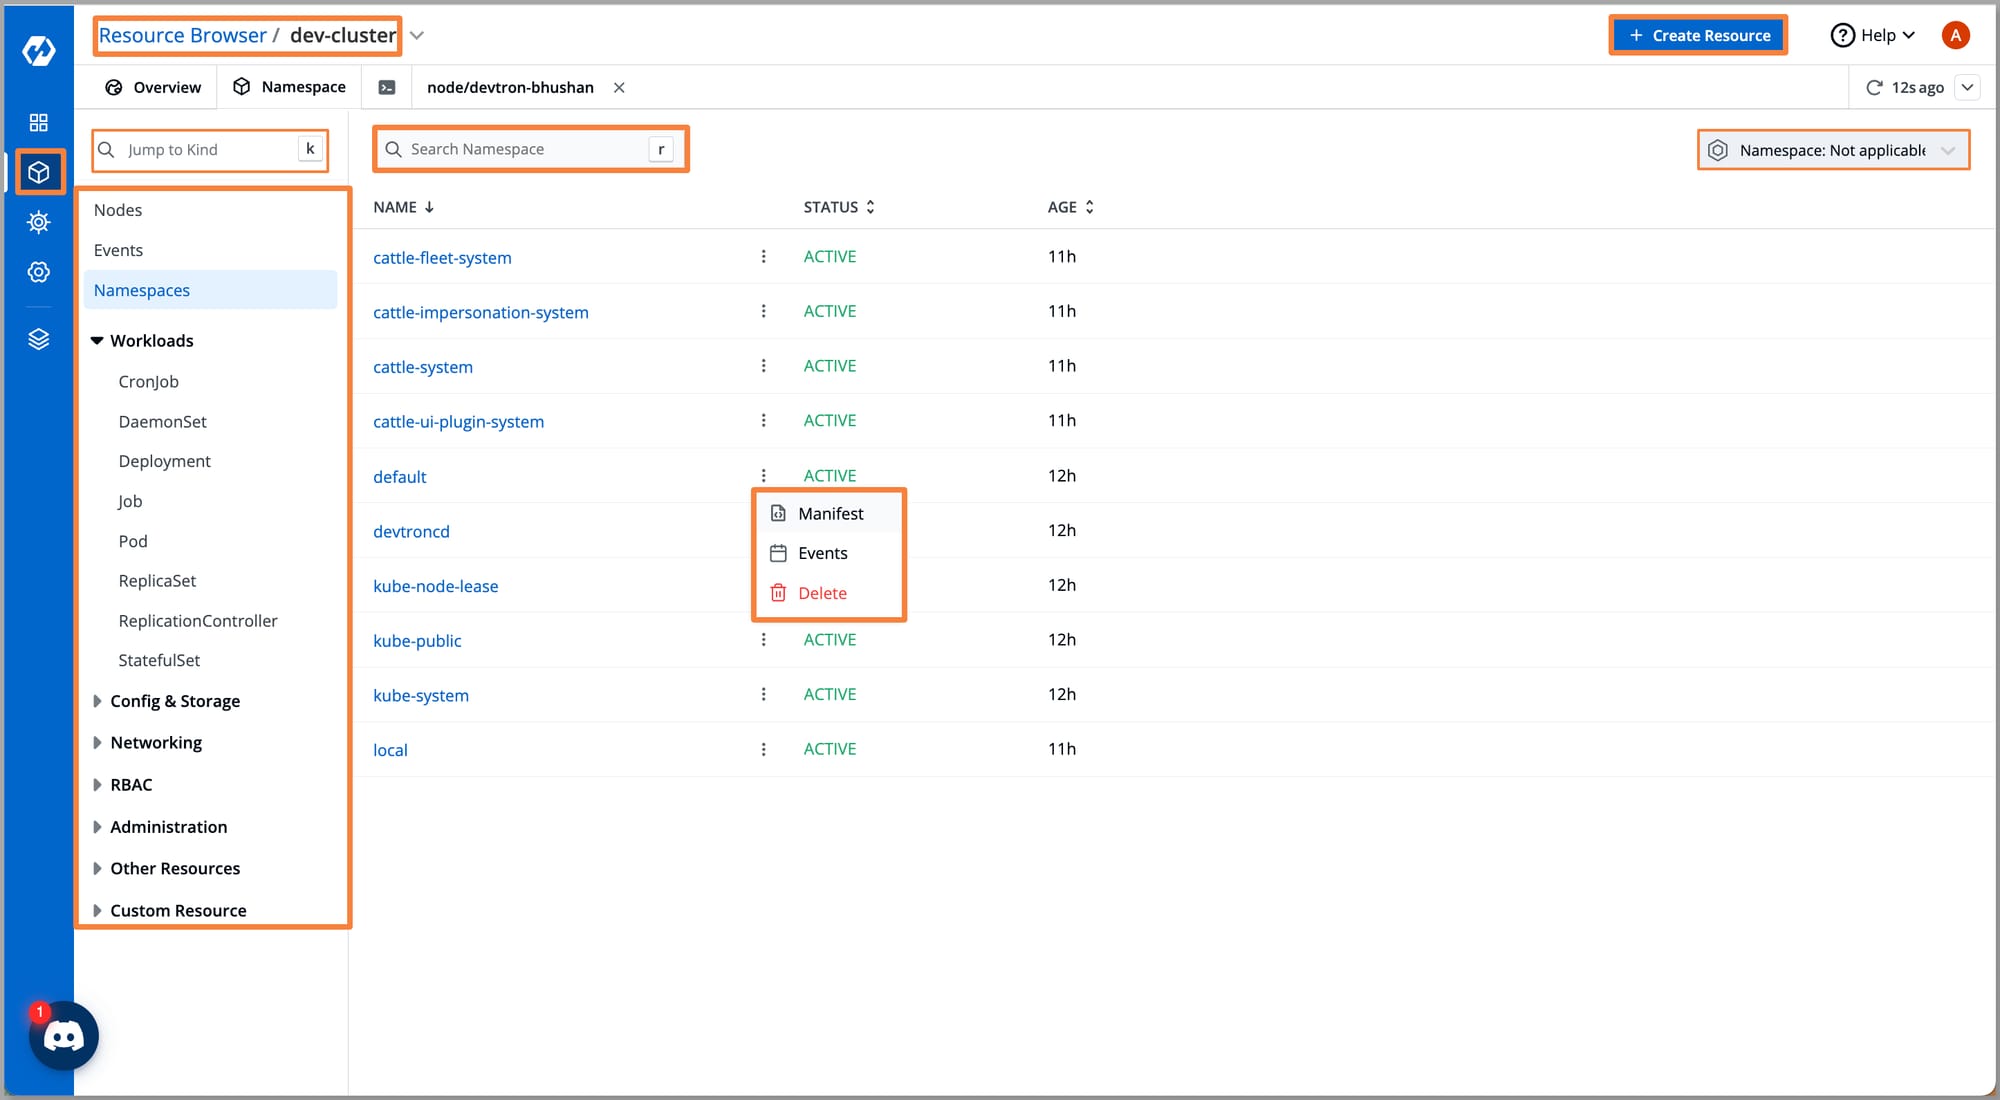
- For Kubernetes workloads, you can perform actions such as visualizing and editing live Manifests, checking Events, and Logs, and using a dedicated Terminal for debugging.
Step 4: Managing Applications over Kubernetes
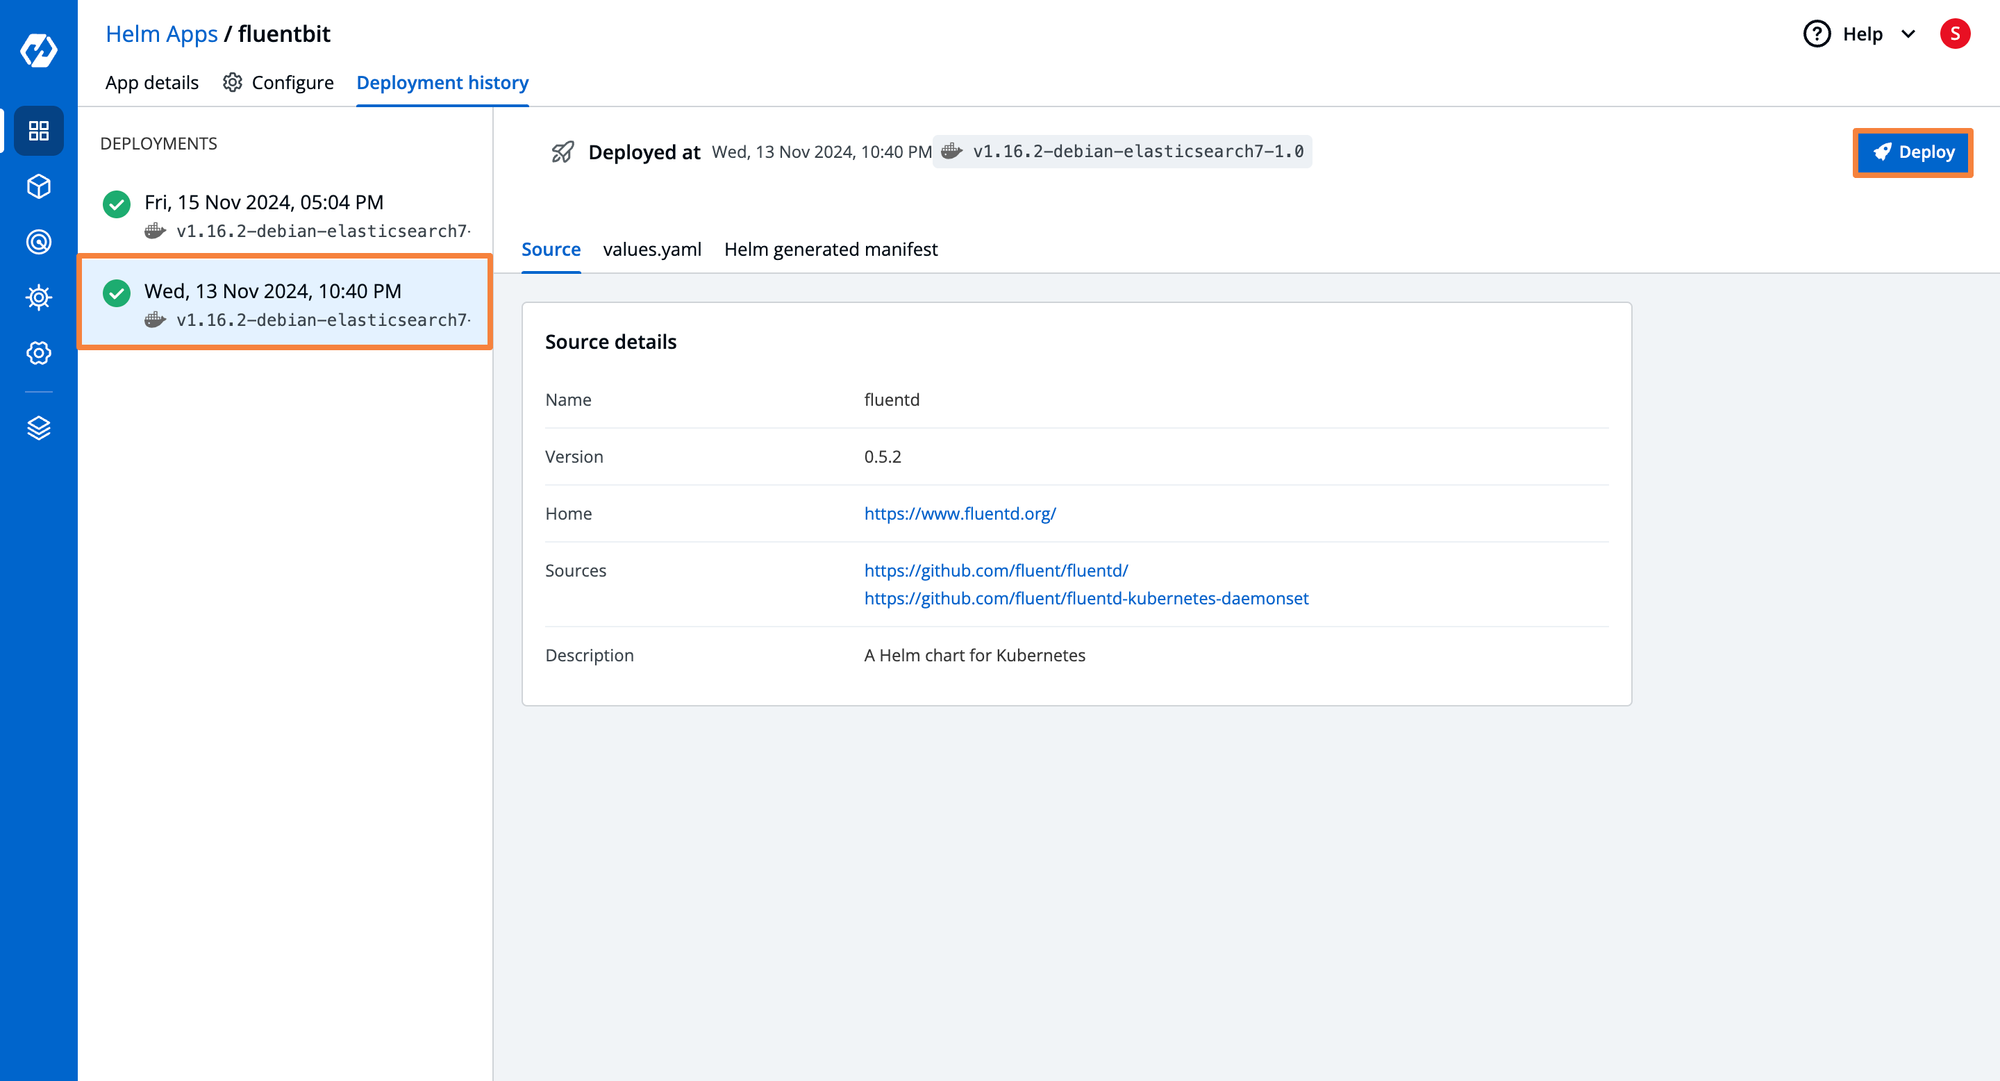
Helm Applications
- Let’s see how we can manage and visualize our Kubernetes applications through Devtron's Kubernetes dashboard.
- Navigate to the Applications tab to view a listing of Helm applications deployed across multiple Kubernetes clusters.
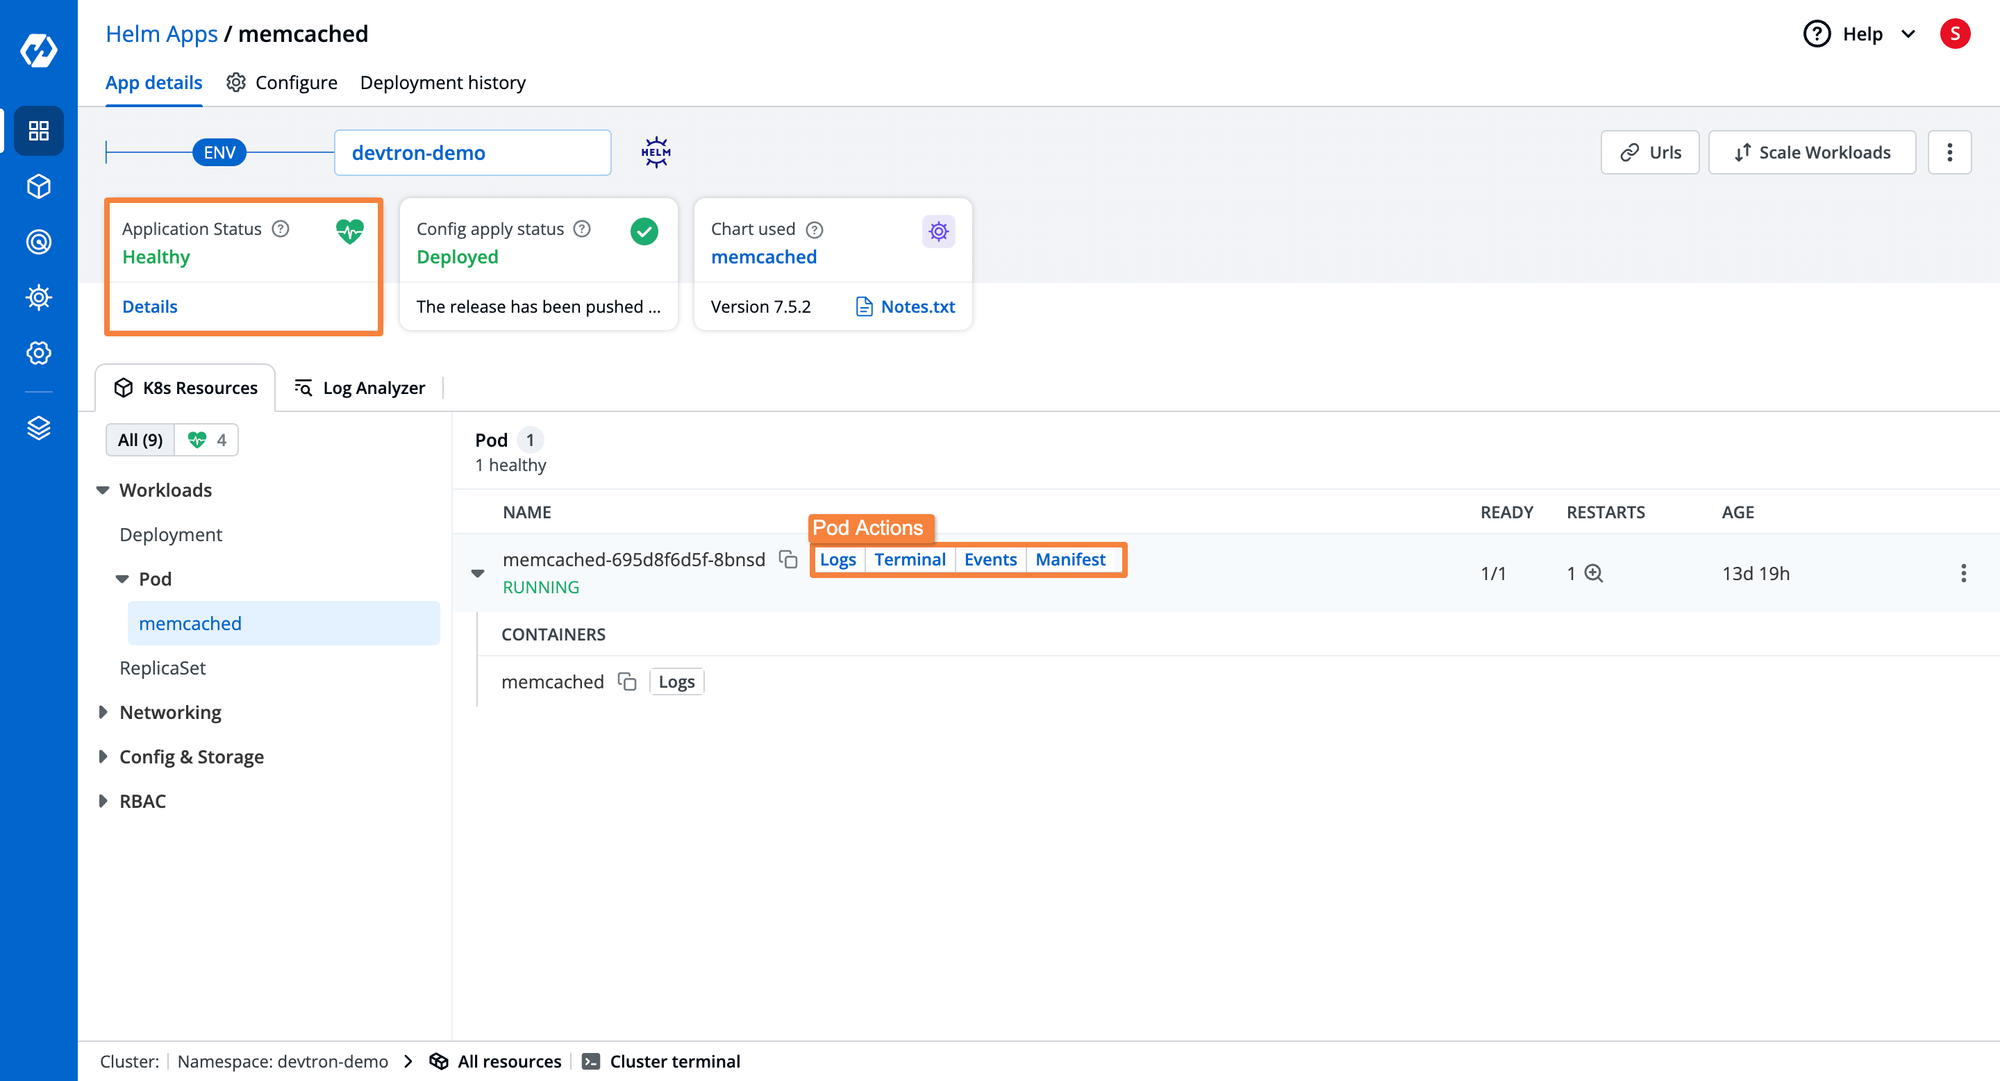
- Selecting a specific Helm application provides a 360-degree view, including Kubernetes resource grouping, current status, deployment history, and configuration drift management.
- The dashboard offers advanced capabilities like visibility for logs, events, manifests, and terminal access for troubleshooting applications.
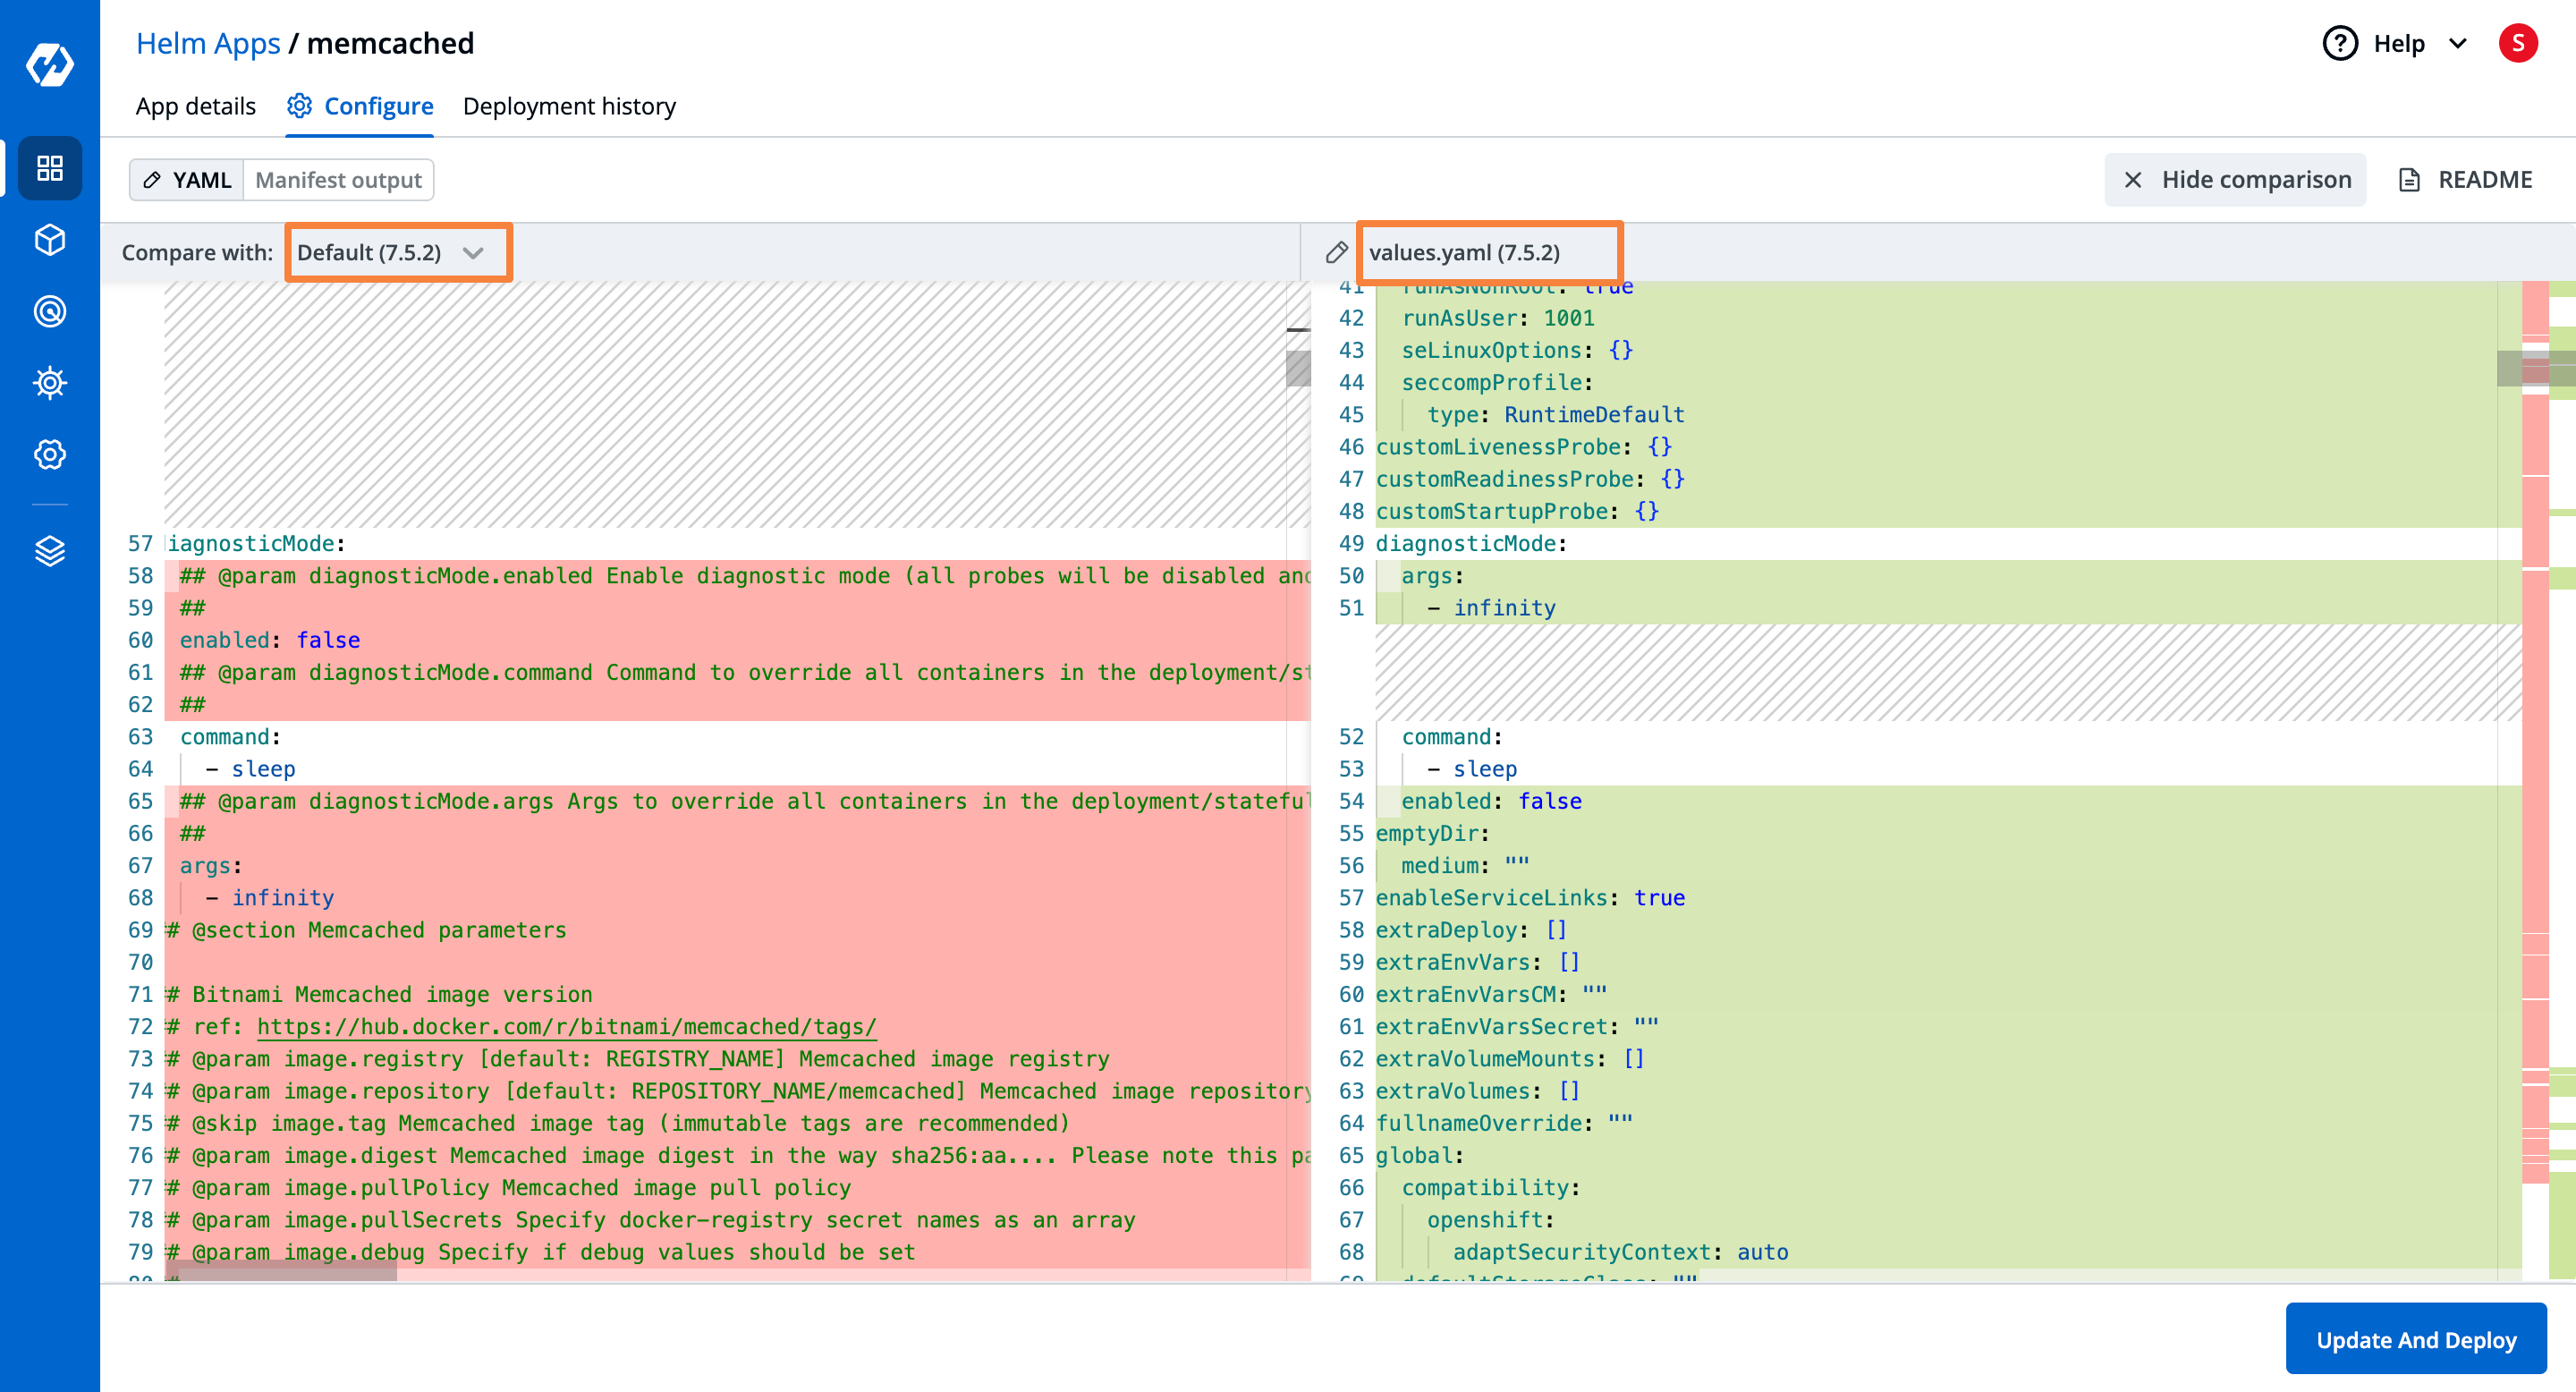
- By navigating to the Configure tab you can visualize the current configuration YAML file. Moreover, you can also compare the configurations of different deployments.
- To keep the trace and accountability of deployments and their configuration, navigate to the Deployment history tab. Here, you can visualize all the details regarding the specific deployment.
ArgoCD Applications
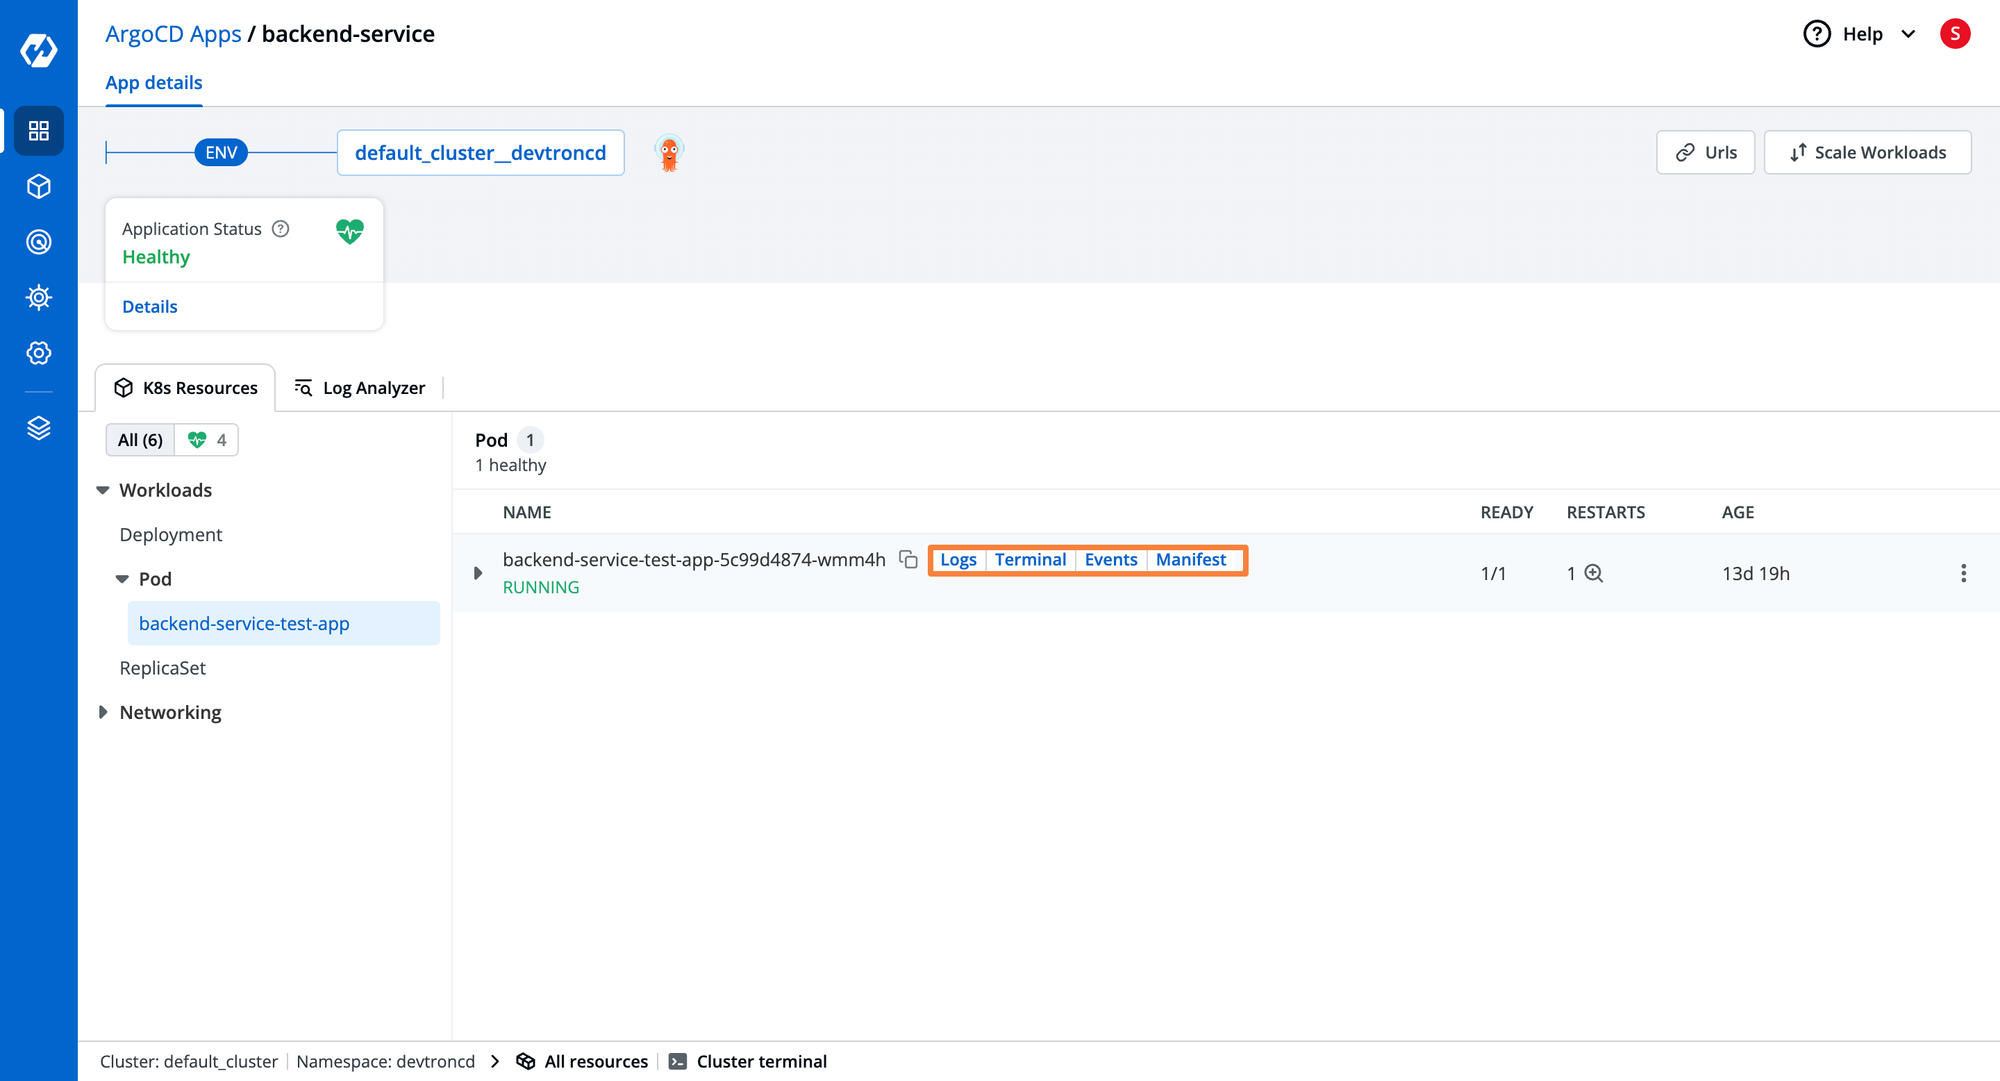
- To view applications deployed via ArgoCD on Kubernetes clusters, click ArgoCD Apps on the dashboard.
- Here, we can visualize the listing of all ArgoCD applications deployed across multiple environments and clusters.
- Navigating to a specific ArgoCD application shows its current status, and grouped Kubernetes workloads.
- Some of the advanced capabilities that you get are visualization of logs, events, app manifest, and terminal support for the selected application.
FluxCD Applications
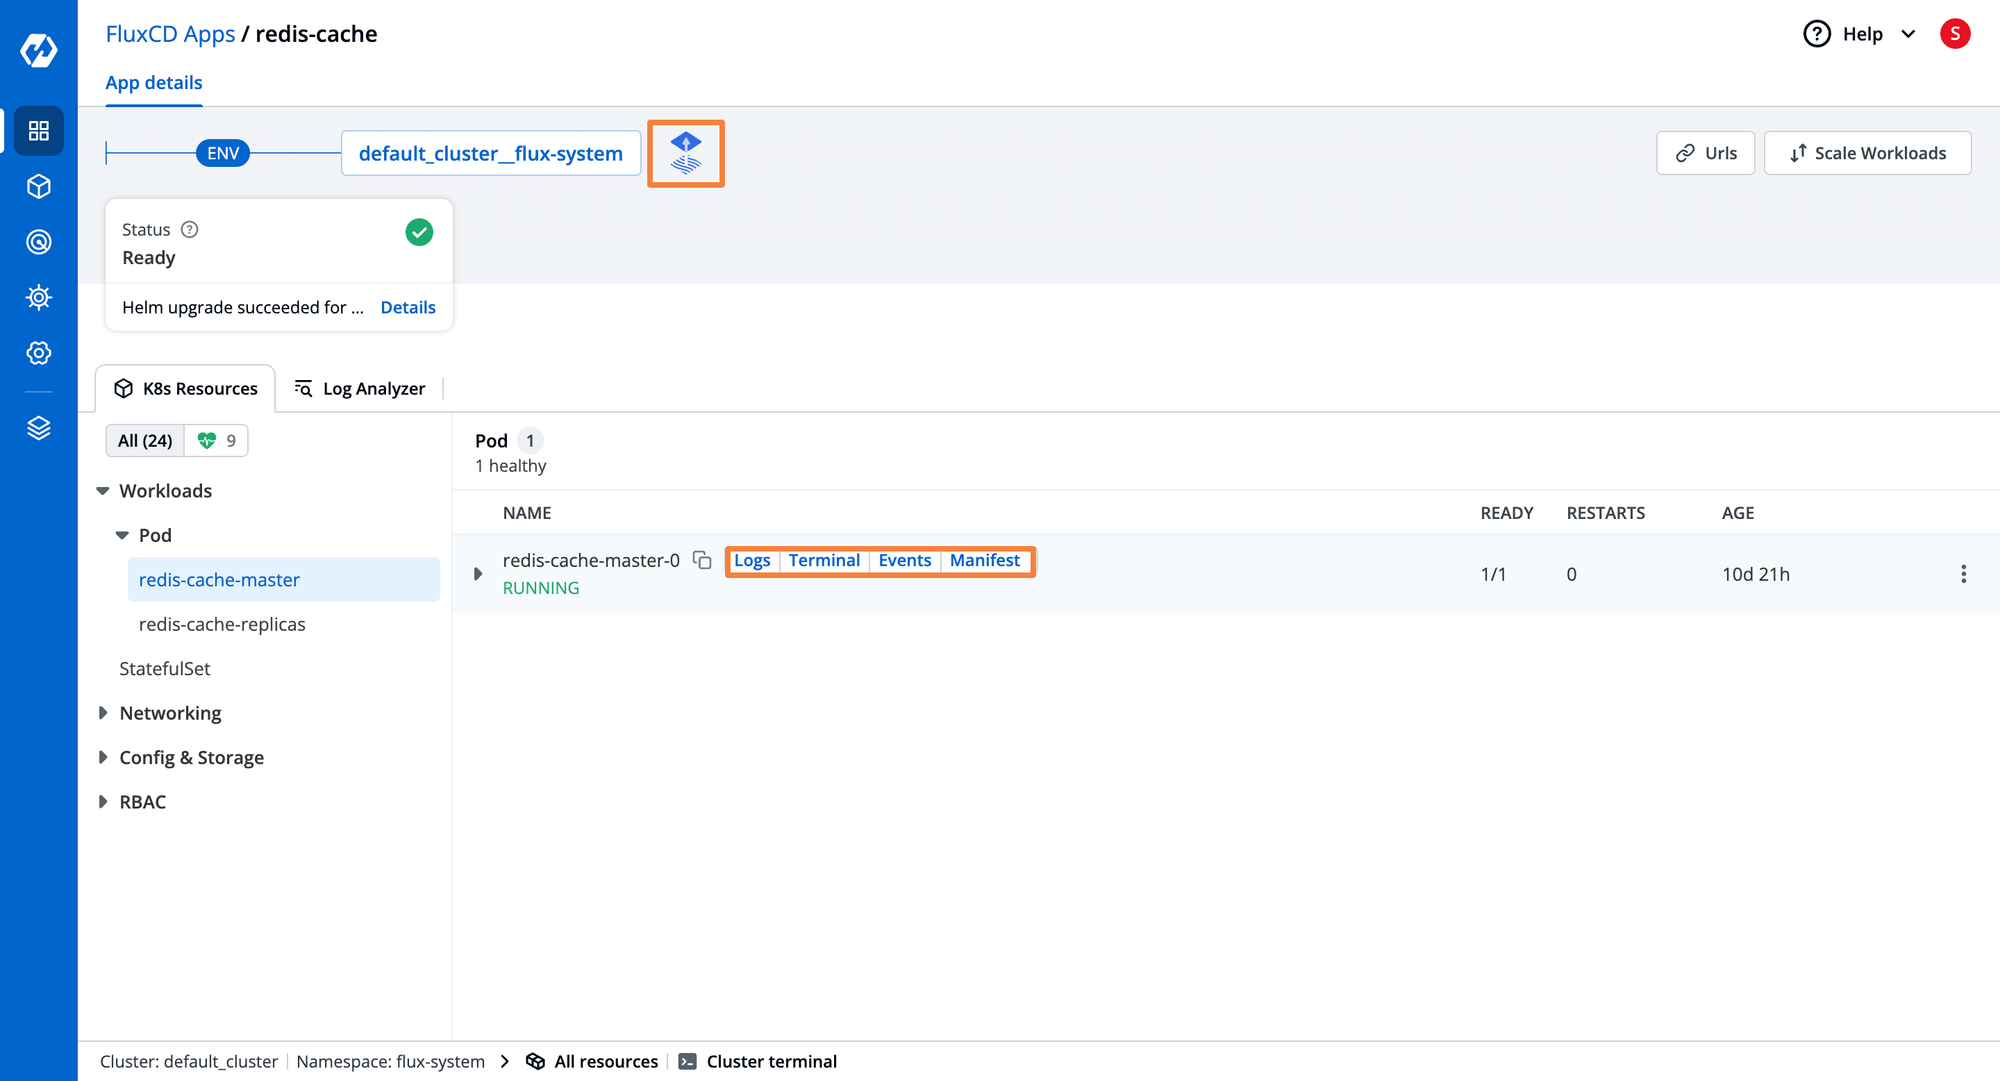
- To visualize applications deployed through FluxCD over Kubernetes clusters, click FluxCD Apps on the dashboard.
- Here, you can visualize listing all FluxCD applications deployed across multiple environments and clusters.
- Selecting a specific FluxCD application displays its current status, logical grouping of related Kubernetes workloads, and advanced capabilities.
- The dashboard lets you visualize the logs, events, and manifests and provides terminal support for troubleshooting applications.
- Devtron's Kubernetes dashboard adds significant value by providing visual insights for FluxCD, primarily a CLI tool, enhancing observability and management.
Step 4: Setting a Robust RBAC
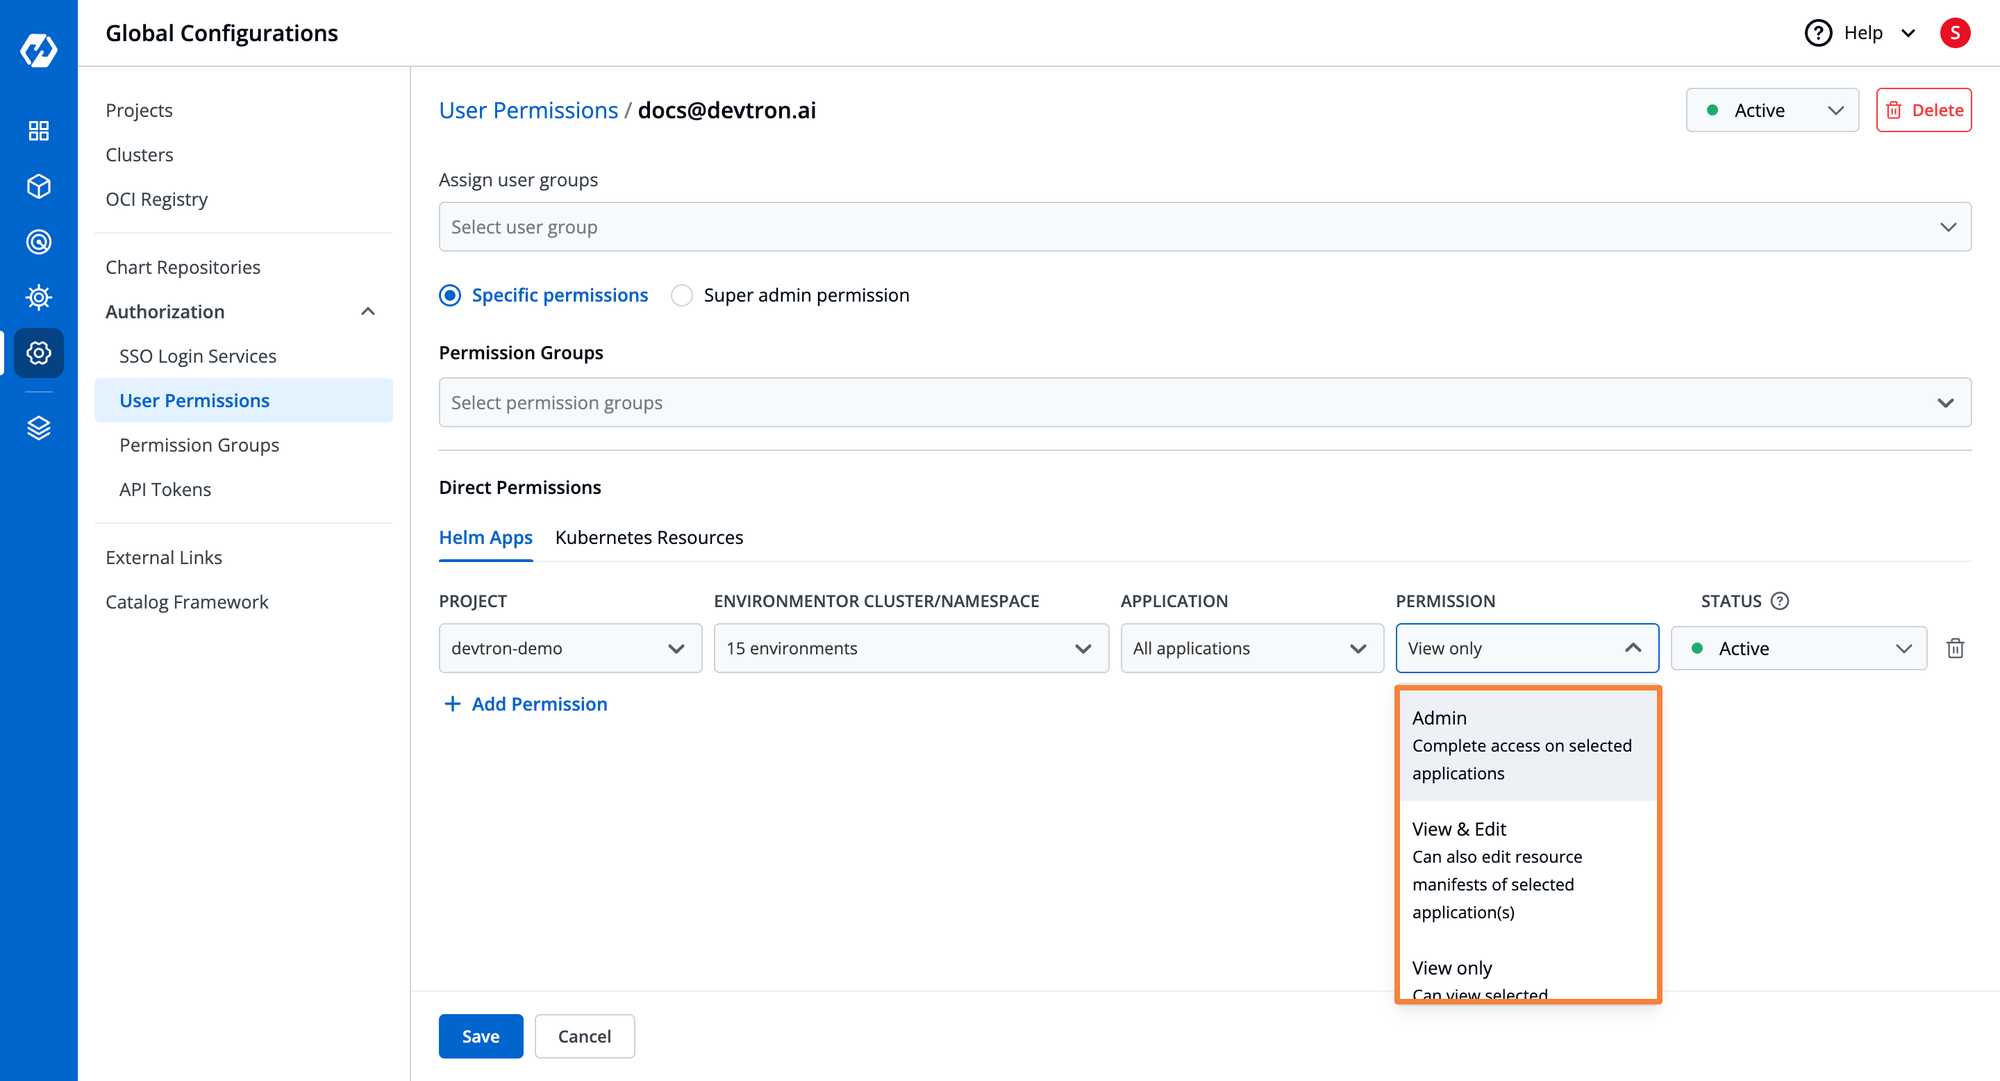
- To configure robust access control for your Kubernetes environment, navigate to the Global Configuration > Authorization > User Permissions > + Add Users.
- Here, you can get the option to configure access control, you can either provide an Super admin permission or Specific permissions.
- At Specific permissions, you can create Permission Groups and add users to them or provide Direct Permissions to users.
- In case you need to provide kubectl access to developers, you can generate API tokens with controlled access and share them with developers. For access through API tokens refer to this blog.
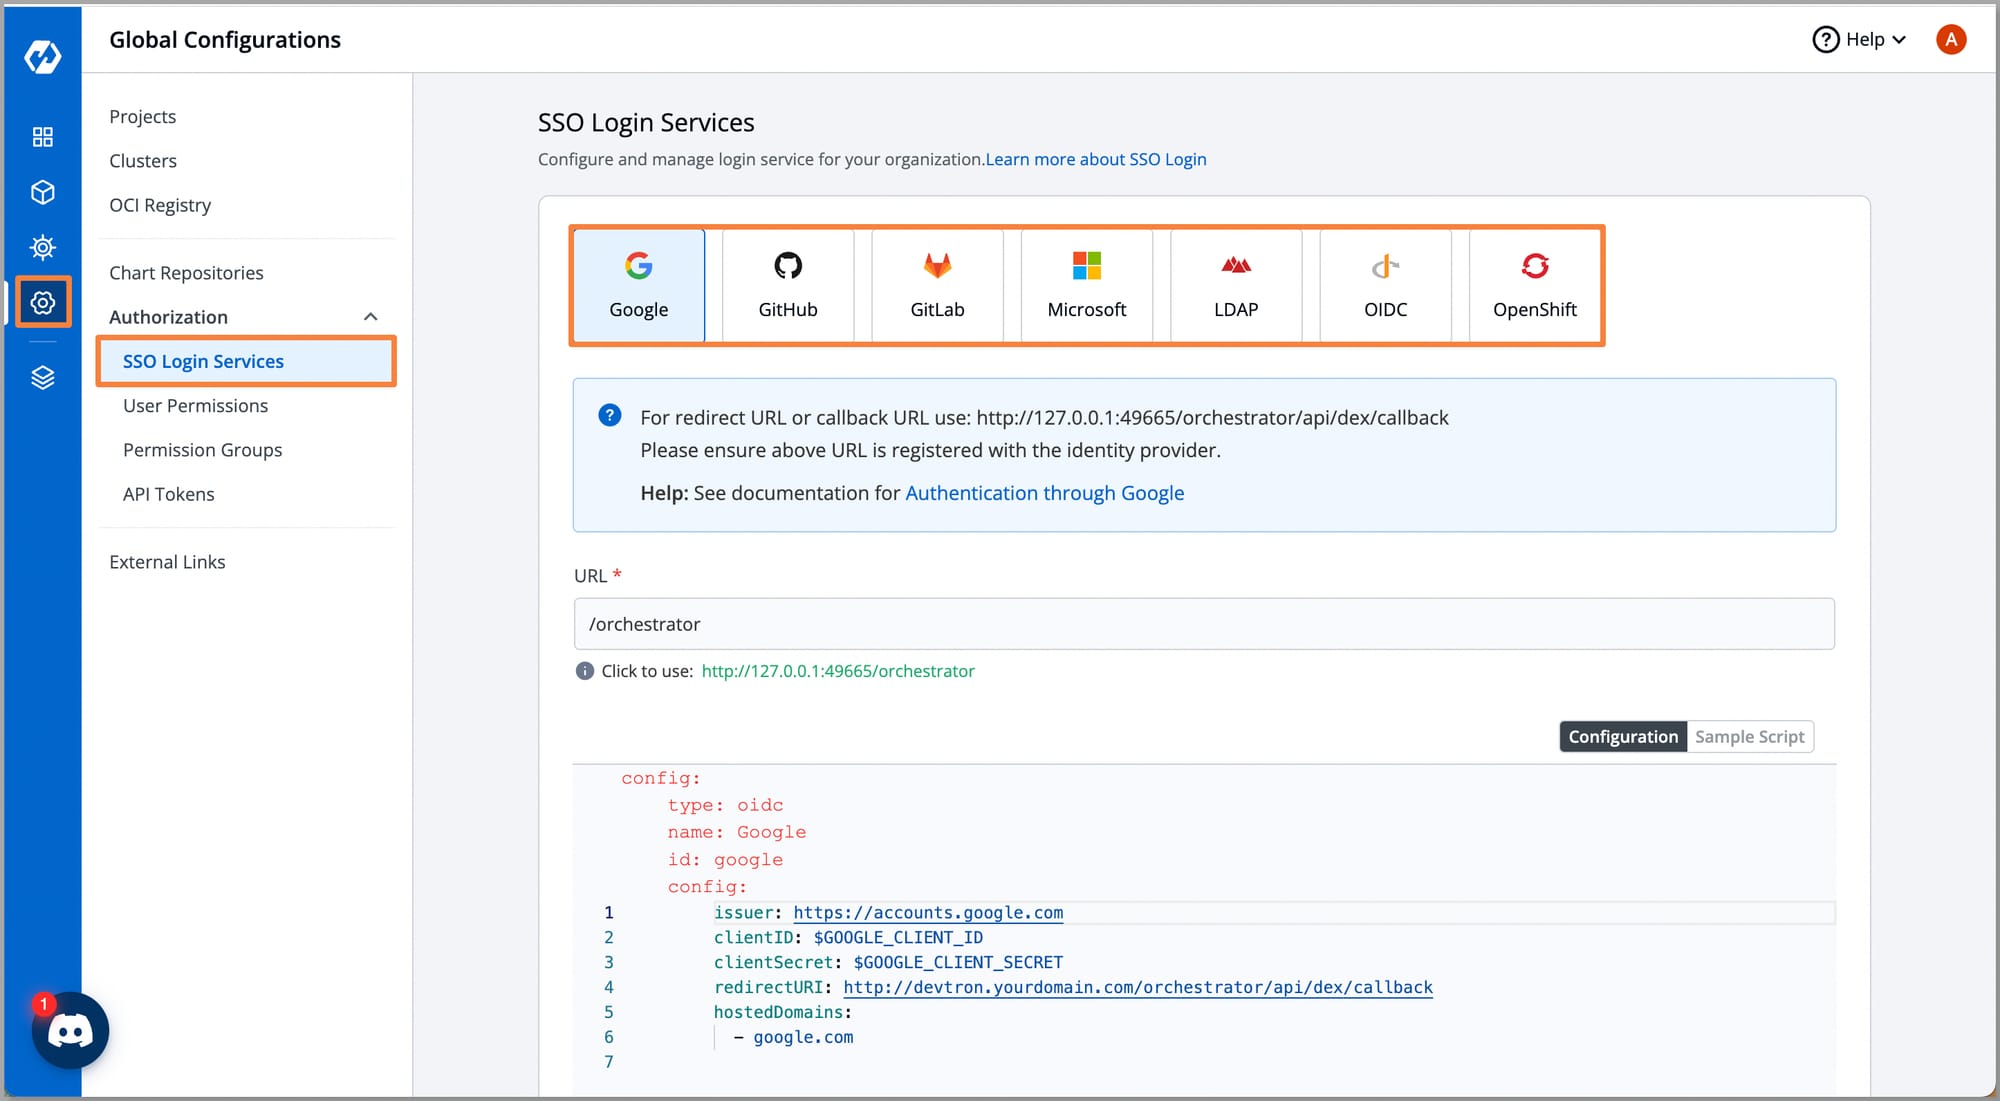
- Once the access for the user is configured you can configure an SSO, which provides an ease to access the Kubernetes environment. To configure an SSO you can refer to this blog.
That’s the Modern Kubernetes Dashboard By Devtron, it provides us with a unified and intuitive interface that streamlines complex Kubernetes management across multiple clusters. From a single pane of glass, we get comprehensive visibility and control over the entire Kubernetes infrastructure, it also provides real-time metrics and advanced debugging capabilities. The Devtron’s Kubernetes Dashboard sprints the extra mile and provides the ability to manage Kubernetes applications by extending support for Helm deployments and complete visibility for ArgoCD and FluxCD applications. Moreover, with features like robust RBAC, live manifest editing, configuration drift handling, logs streaming, and built-in terminals for troubleshooting, Devtron eliminates the complexities of CLI-based tools like ‘kubectl’ and enhances operation efficiency.
Conclusion
In today's rapidly evolving cloud-native landscape, managing Kubernetes at scale using a CLI tool become cumbersome and error-prone. The complexities of the CLI tools can be eliminated through an intuitive UI that provides complete visibility and operational efficiency. The Devtron’s Kubernetes Dashboard stands out by providing unified visibility across multiple Kubernetes clusters and their workloads. Features like robust RBAC, manifest editing, configuration management, configuration drift handling, and deployment history help teams manage their Kubernetes infrastructure more efficiently. Moreover, capabilities like Helm application deployment and complete visibility for ArgoCD and FluxCD allow teams to manage their Kubernetes application smoothly. Whether you're scaling your Kubernetes operations or seeking to improve developer productivity, Devtron's Modern Kubernetes Dashboard offers a comprehensive solution.

