Cluster terminal access is an essential feature that enables DevOps Engineers to manage clusters and troubleshoot applications on the go. The engineers at Devtron understand the need for such a component and have incorporated it into the latest open-source release of Devtron for the community to use. This capability will now allow the users of Devtron to troubleshoot your cluster right from the Devtron dashboard without direct access into the Kubernetes cluster as a standard security best practice.
What is Devtron?
Devtron is an advanced Kubernetes dashboard that helps users gain visibility into application workloads and manage them easily without any context switching. In addition to gaining visibility into application workloads, Devtron's Kubernetes dashboard also provides support for installing and easily configuring Helm applications.
To install Devtron, please follow the following steps
Pre-requisites
After your Kubernetes cluster is running, you can install Devtron using its Helm chart. Please run the below command to fetch Devtron’s latest Helm chart.
helm repo add devtron https://helm.devtron.ai
helm repo update
To install Devtron, please run the below command. This will install Devtron’s Kubernetes Dashboard using the above helm chart
helm install devtron devtron/devtron-operator \
--create-namespace --namespace devtroncd
You may need to wait upto 5 minutes for Devtron to be fully installed and ready to use. Please wait for all the pods to be running. You can check the status by using
kubectl get pods -n devtroncdOnce all the pods are running, you can access the Devtron Dashboard by port forwarding the Devtron service. Please use the below command to make the dashboard accessible on localhost:8080
kubectl port-forward svc/devtron-service -n devtroncd 8080:80You also require the admin password for logging into the dashboard. You can obtain the password by running the following command
kubectl -n devtroncd get secret devtron-secret \
-o jsonpath='{.data.ADMIN_PASSWORD}' | base64 -d
You will now have access to Devtron’s dashboard. Let’s see how you can create and use a Cluster-wide terminal through Devtron.
If you wish to explore how to install Devtron on a managed cluster or a VM, or wish to check out some of the advanced installation methods, please check out the installation documentation.
How to launch a Cluster-Wide Terminal?
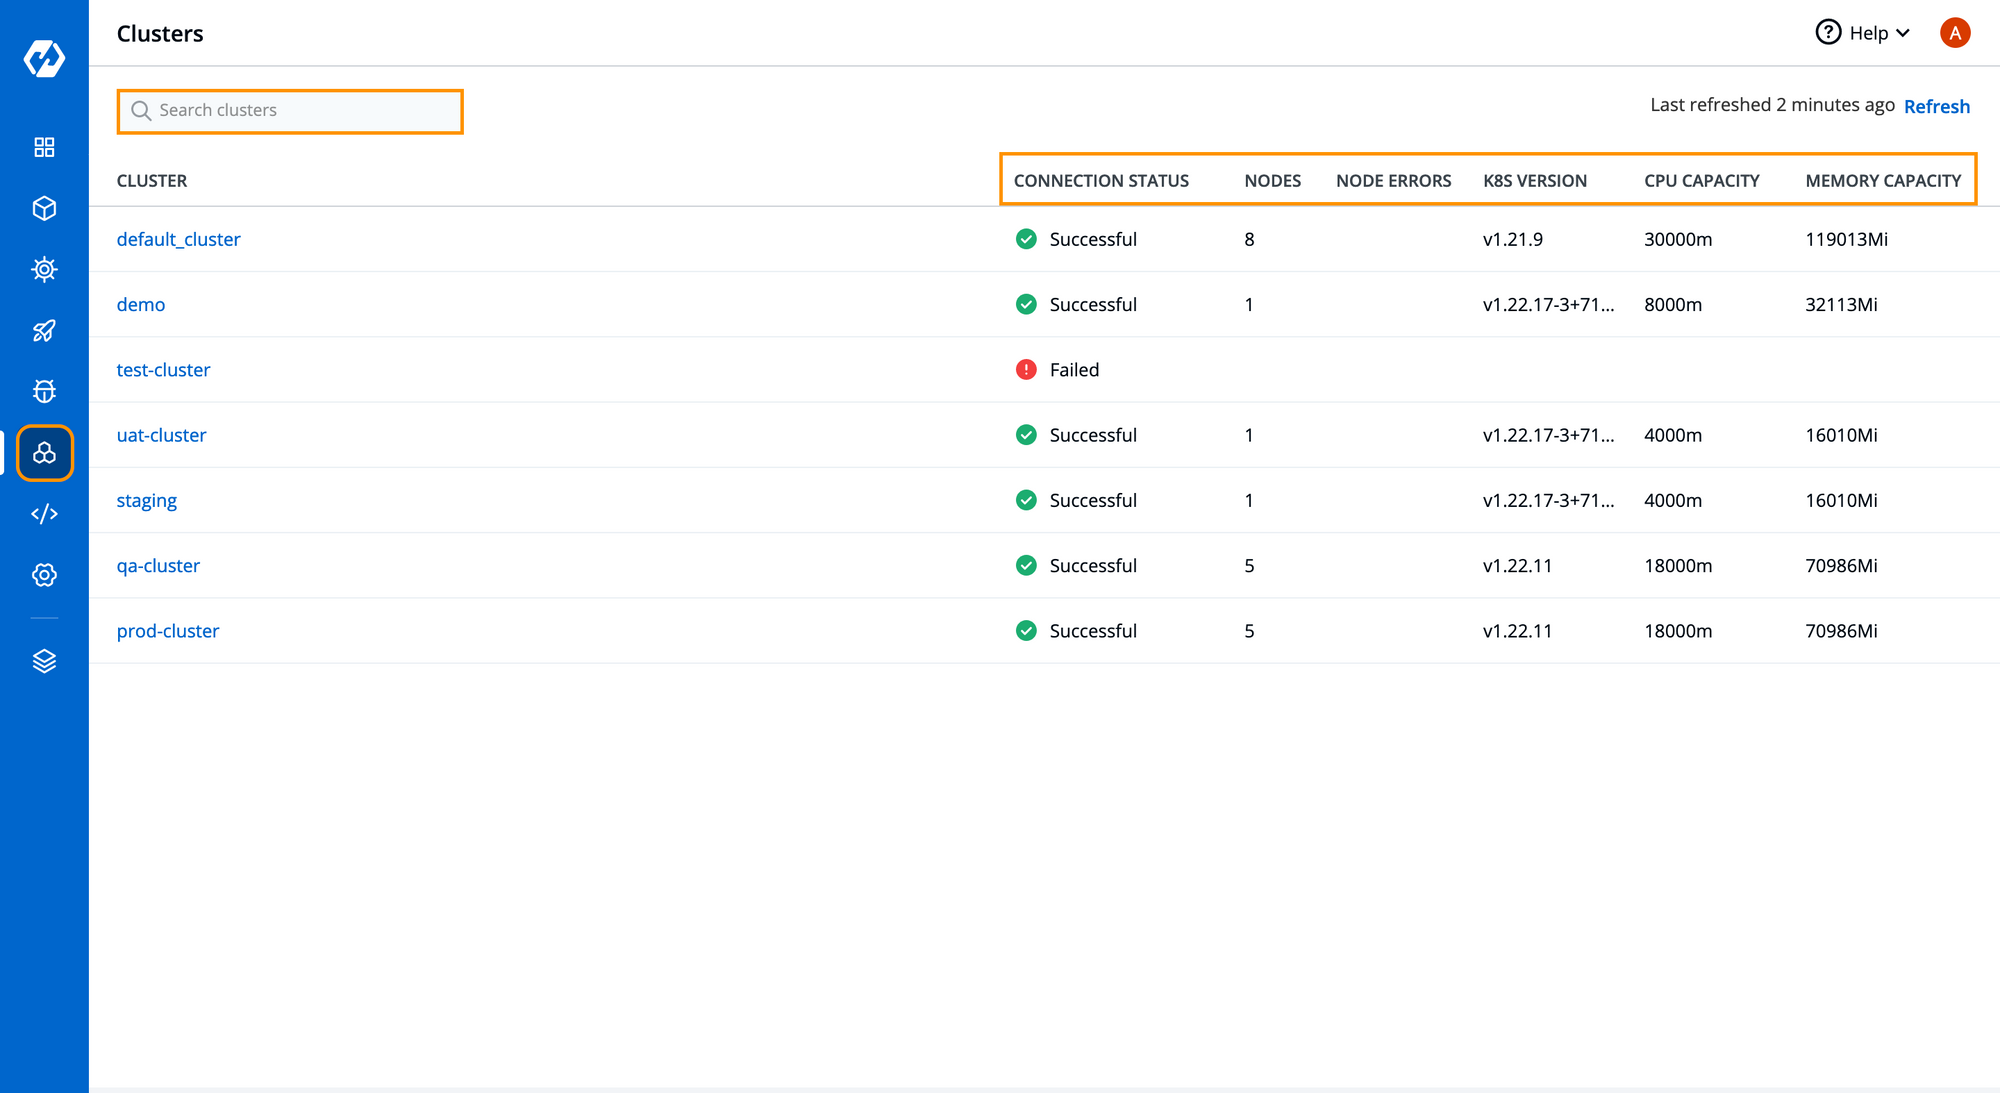
Step 1: Go to the Clusters Overview sections by clicking on the Clusters icon from the left menu as highlighted in the image below. You’ll be able to see all your clusters with some minor details such as Connection Status, Nodes, Resources etc added to Devtron dashboard on this page.
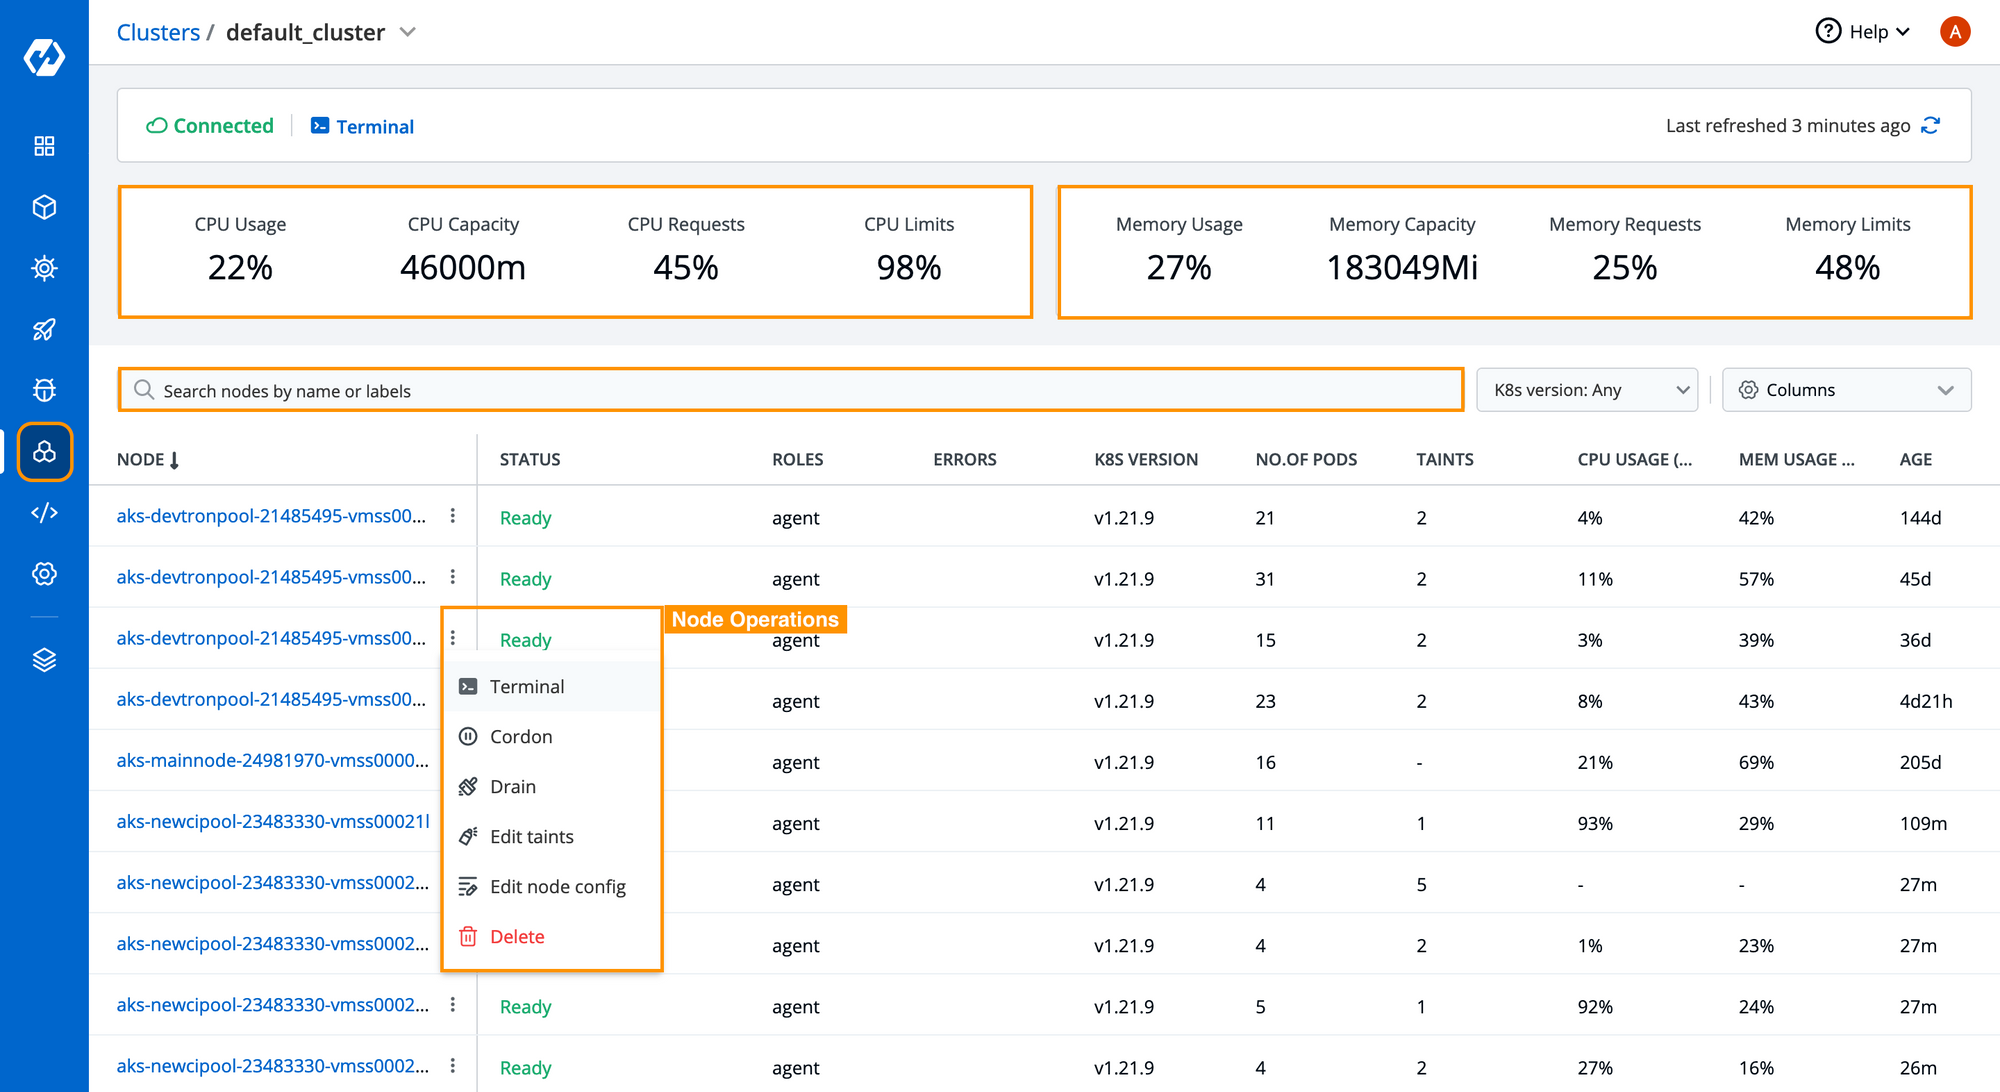
Step 2: Click on any Cluster to view all nodes added in that cluster. We can also observe metrics related to clusters and each nodes. This given a brief overview of a cluster with its Resource Usage, real-time status of nodes, Kubernetes version and a lot more as mentioned in below image.
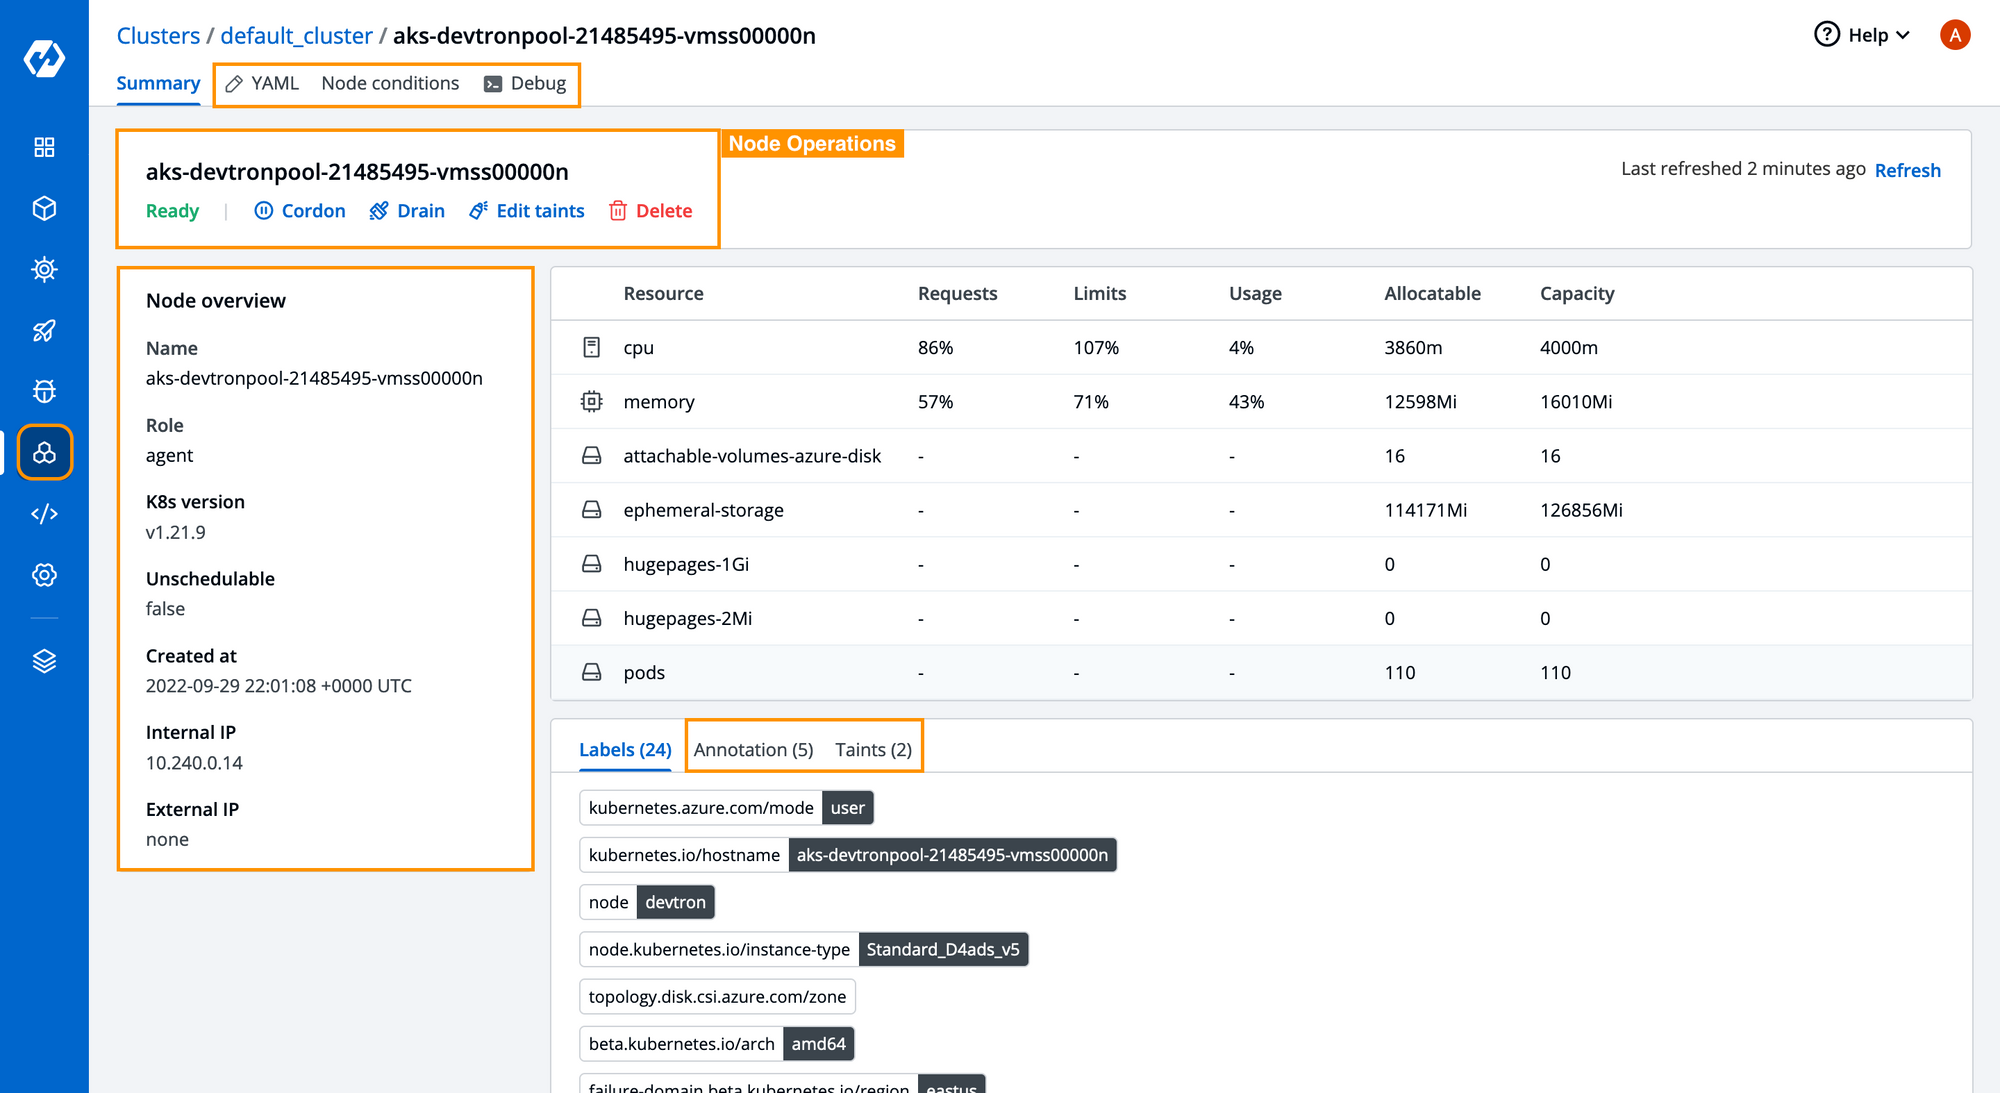
Step-3: Click on any node, it will open the detailed node metrics where you can observe resource usages, annotations available, labels, number of pods and lot more as seen in below image. It also shows all the node operations that can be performed such as taint, cordon, drain node, real-time node conditions as well as it allows you to exec into node and launch the terminal to debug that cluster.
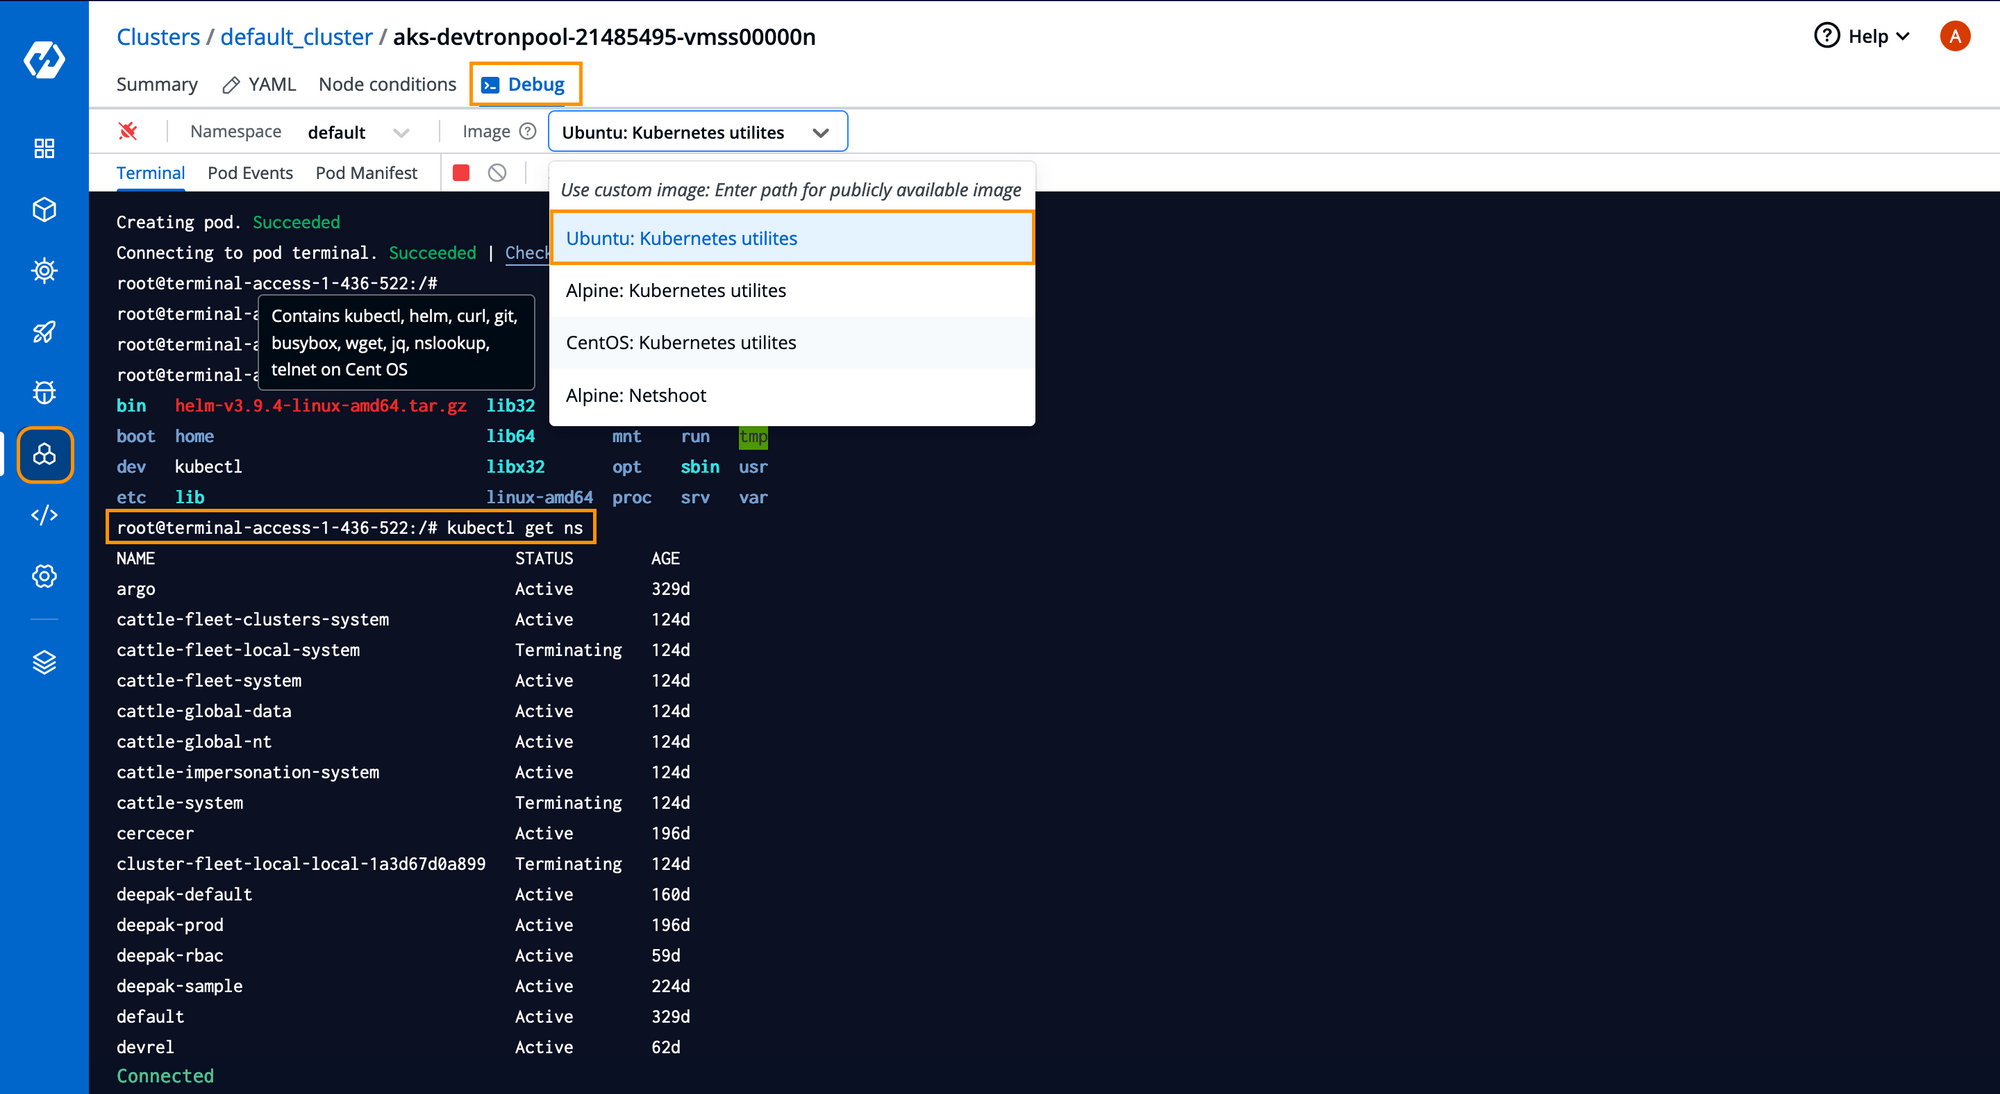
Step-4: To open the terminal of any of the Node, click on debug as seen in below image. Cluster wide terminal can be opened either by opening any specific node, or just from the terminal option available at the top-left in Clusters Overview.
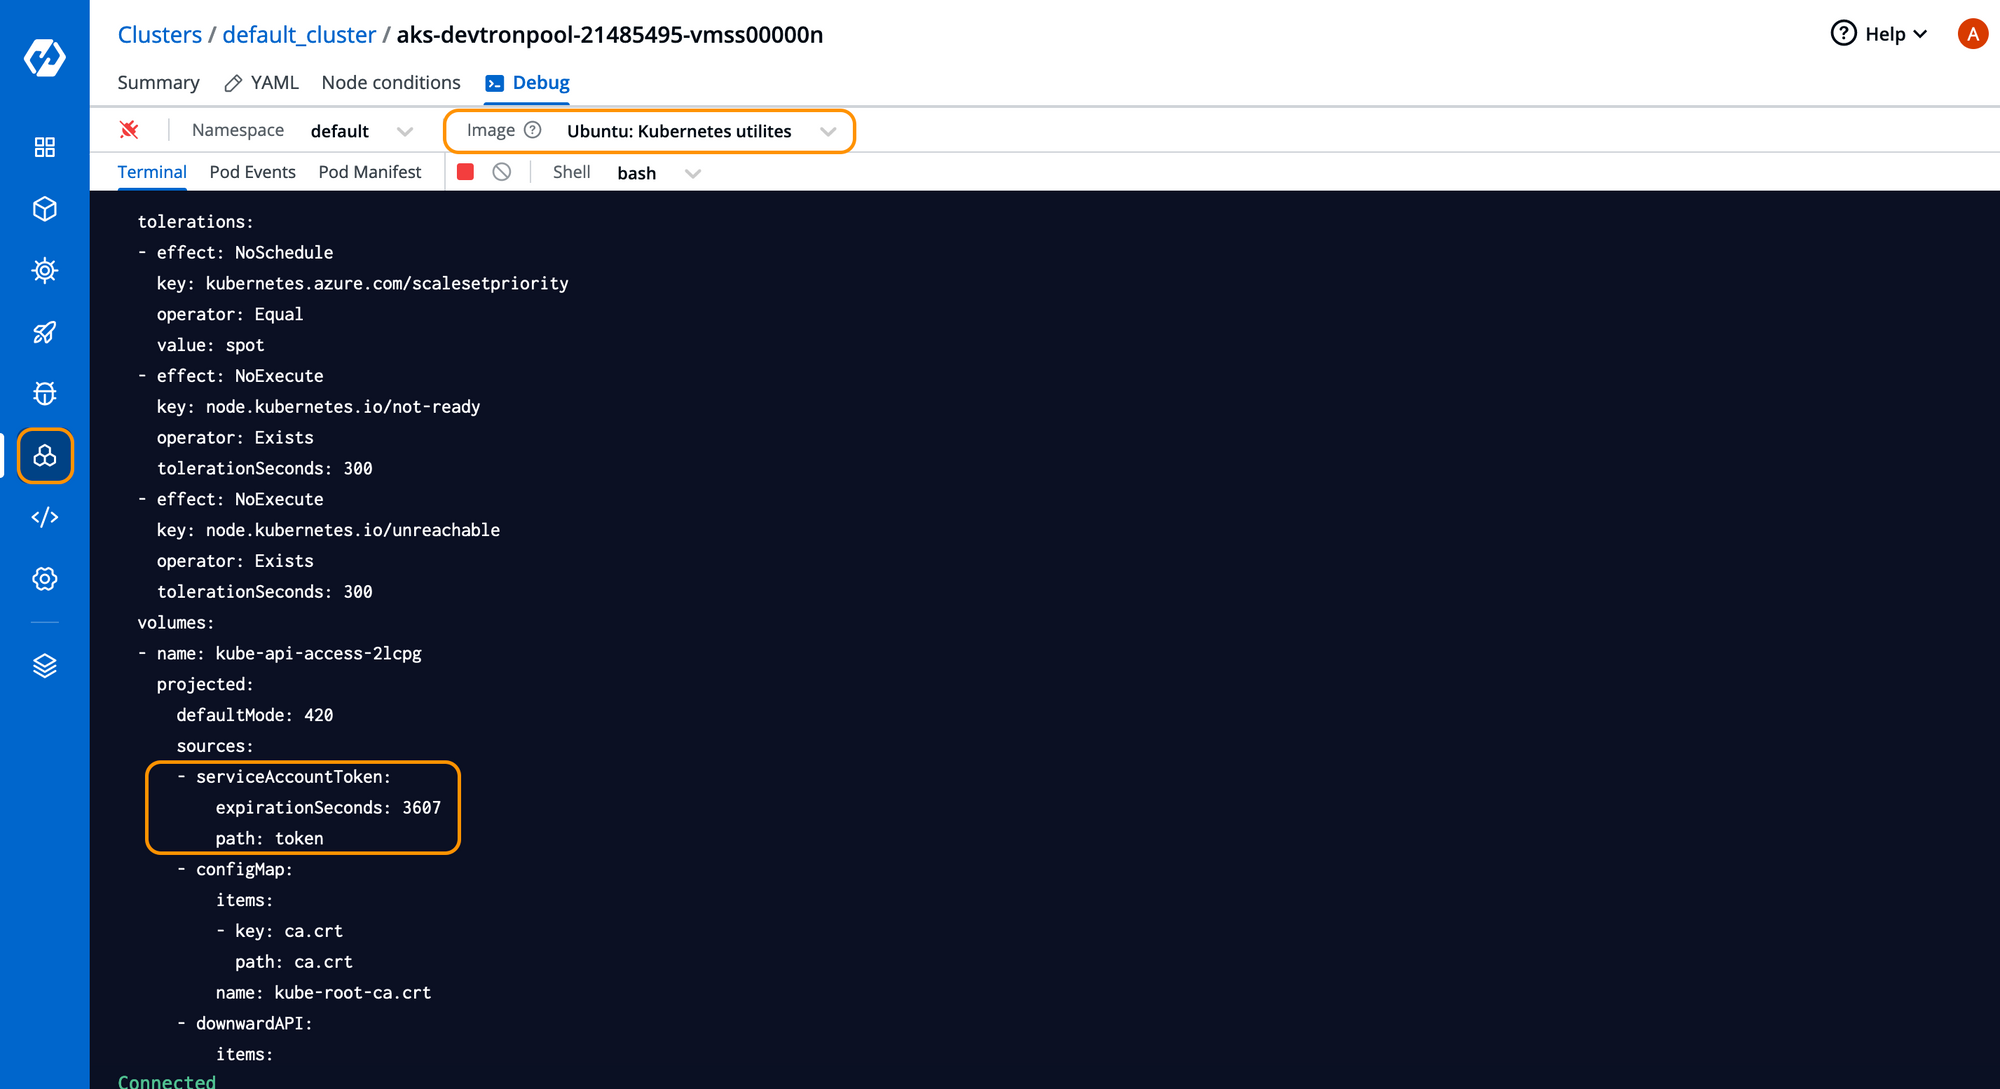
Currently Devtron comes with four default images packaged with utilities like kubectl, netshoot, helm, curl, busybox and a lot other. We have used Ubuntu:Kubernetes utilities as you can see in the below image. Devtron also allows you to use your own custom images publically hosted in any container registry like DockerHub, Quay, etc.
How to use a Custom Image in Terminal?
Apart from the default images, it also gives you the flexibility to use your own custom images with your favorite tools to start debugging the cluster.
For instance, in this blog we took the k9s image publicly available at dockerhub. We just need to provide the image name that is publically hosted and Devtron will automatically pull the image and attach it to the cluster. It can come really handy when you already have your custom images with tools you use regularly for debugging or checking cluster reachability. As you can see in the below image, we have launched derailed/k9s image and from the Devtron dashboard itself, we are able to access the cluster and use the choice of CLI utility.
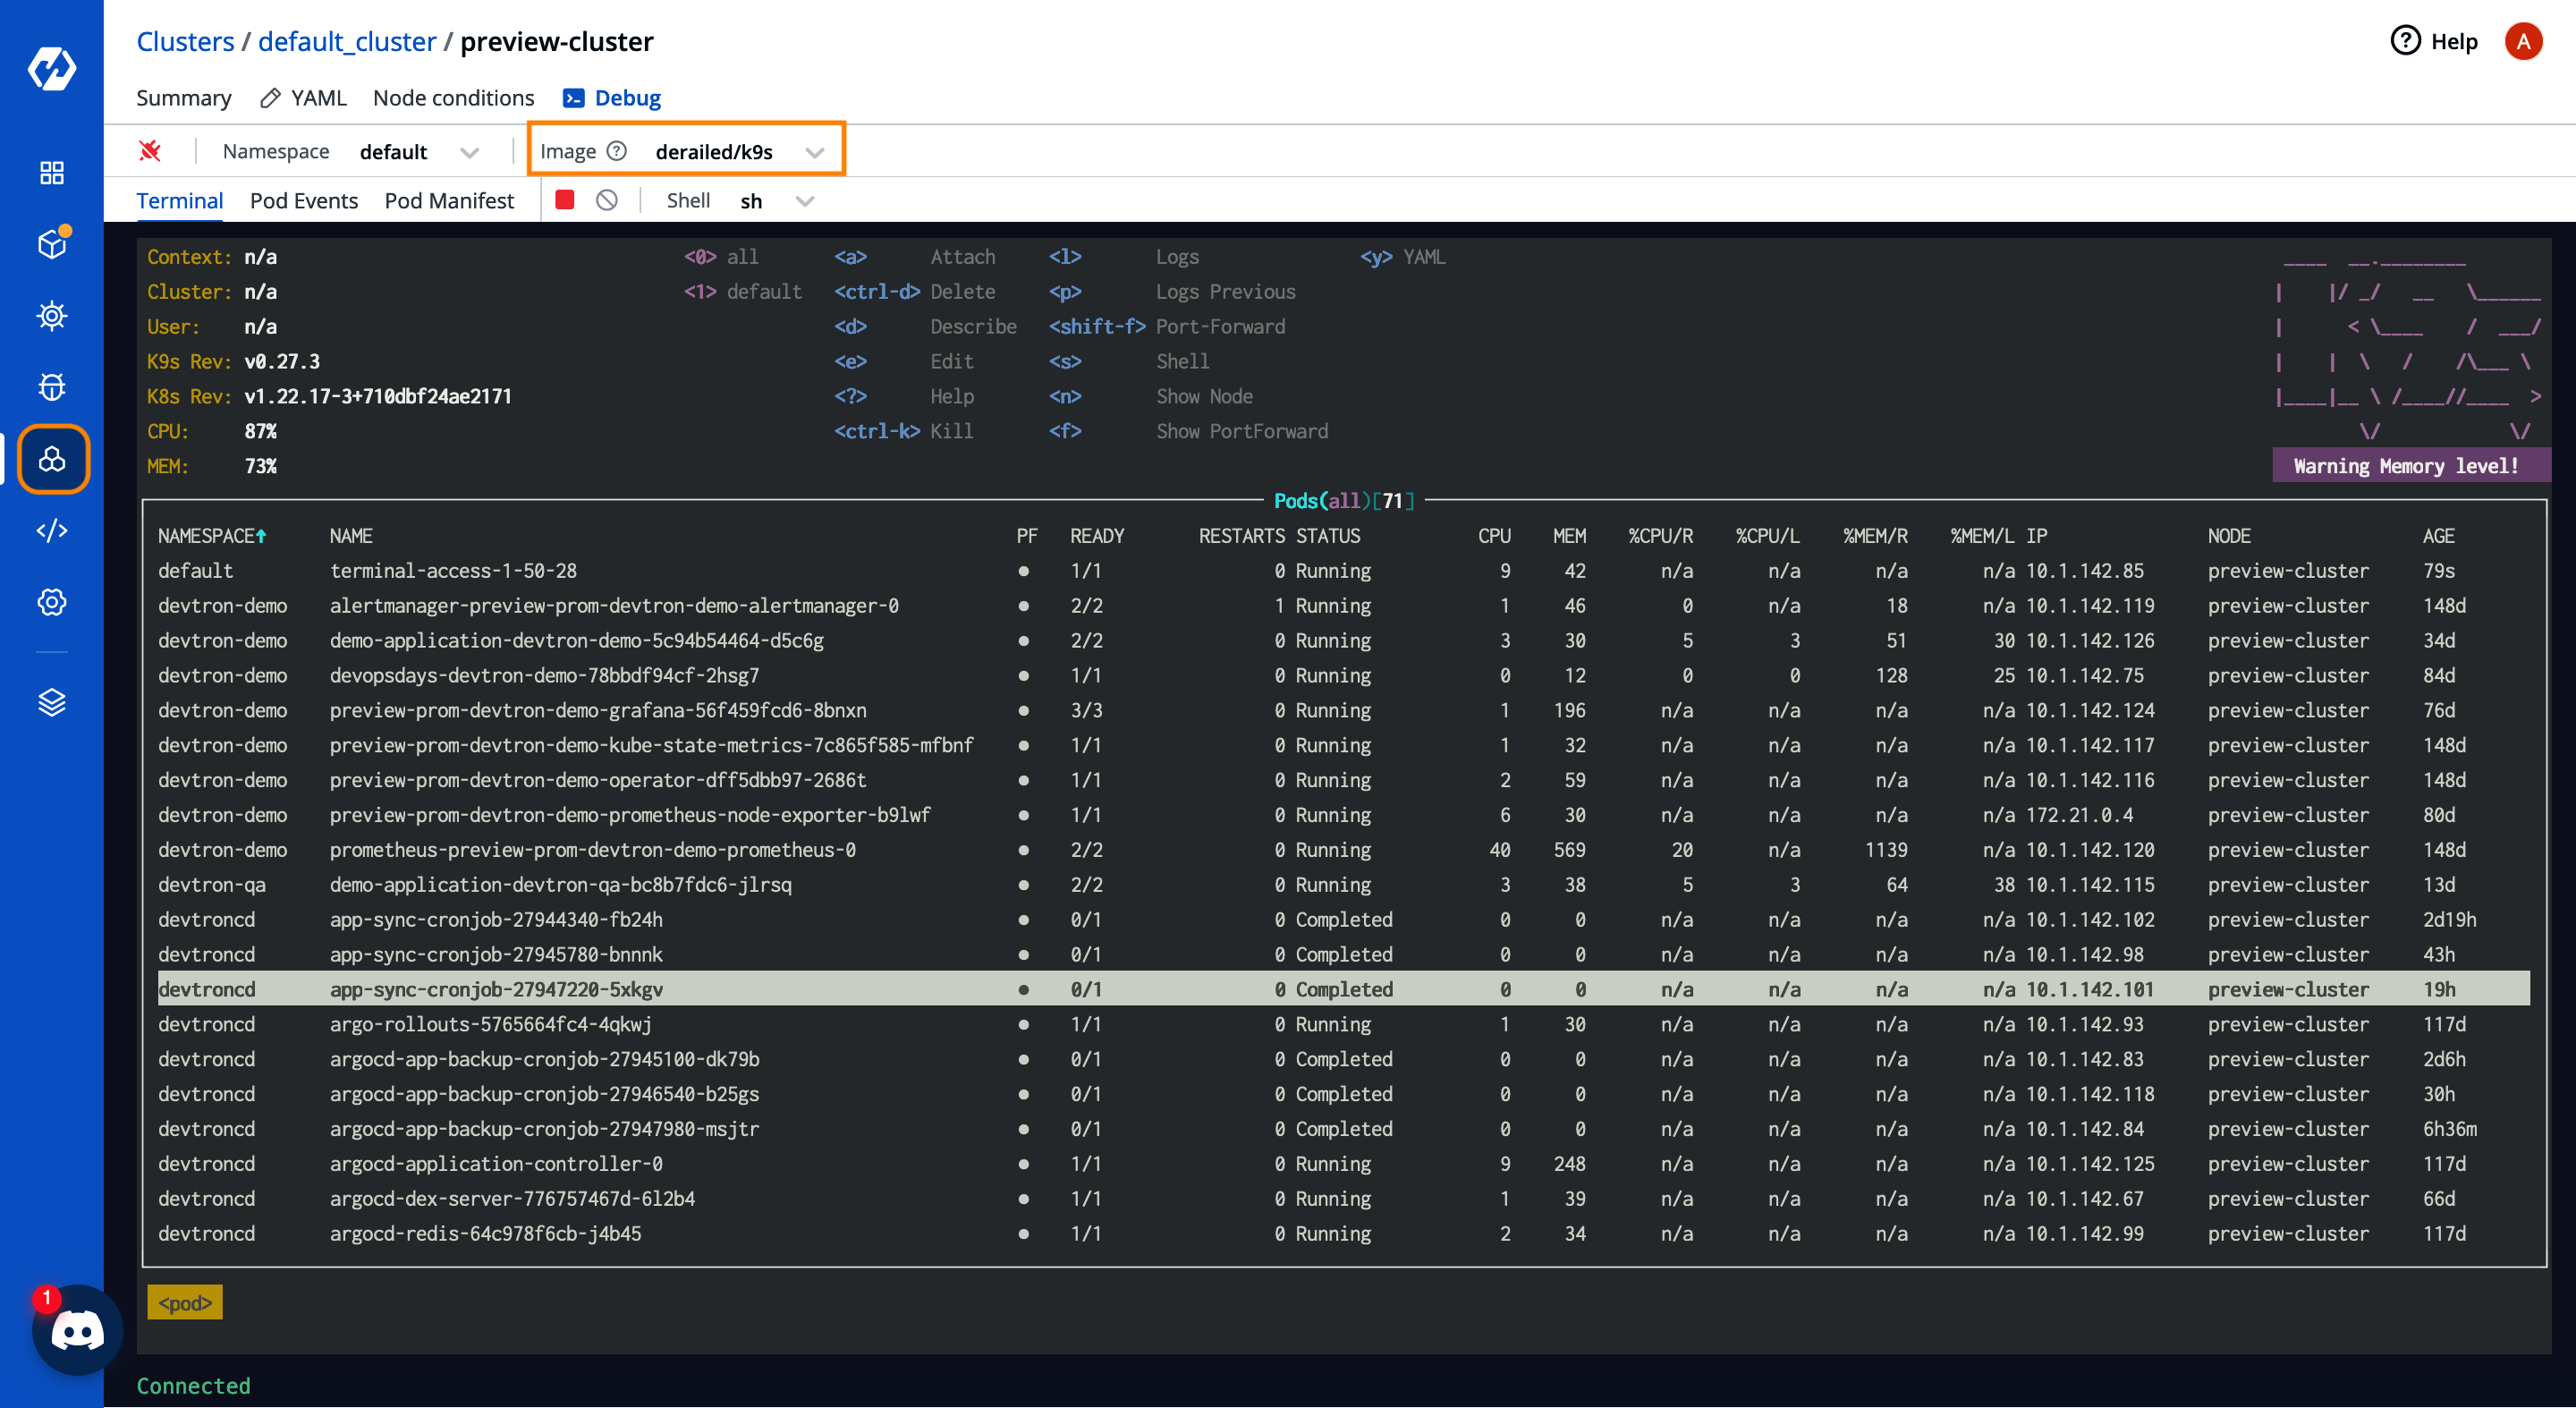
Please note that here you’ll need to installkubectlfrom the package manager, as this image doesn’t ship withkubectlinstalled. You can download kubectl by following the instructions present at Kubernetes docs.
To harden the security, the access to cluster terminal is limited to one hour of inactivity, after which the service account token will expire, and you will no longer be able to communicate with the API server. Additionally, it can only be accessed by the relevent users i.e, superadmin users that has access to Devtron dashboard.
Why Cluster Terminal Access?
With Cluster Terminal Access, we can easily troubleshoot the cluster if there's any issue with nodes. It provides an easy way to exec into any node without worrying about vanilla complexities of SSH or firing kubectl commands. It can help us to debug any OS-level issues, check-out logs, troubleshoot network connectivity and lot more. Here are some use-cases that can be easily solved by cluster wide terminal:
Use-Case 1: Network Troubleshooting
Using the traditional methods to check if a node is connected to the internet and properly configured for networking had been a long and laborious process involving security risks. One have to add kubeconfig of the cluster, ssh into a node or spin up a pod and attach it to the cluster, install required debugging tools like nmap, netsoot, curl, etc and then try to check the node's reachability.
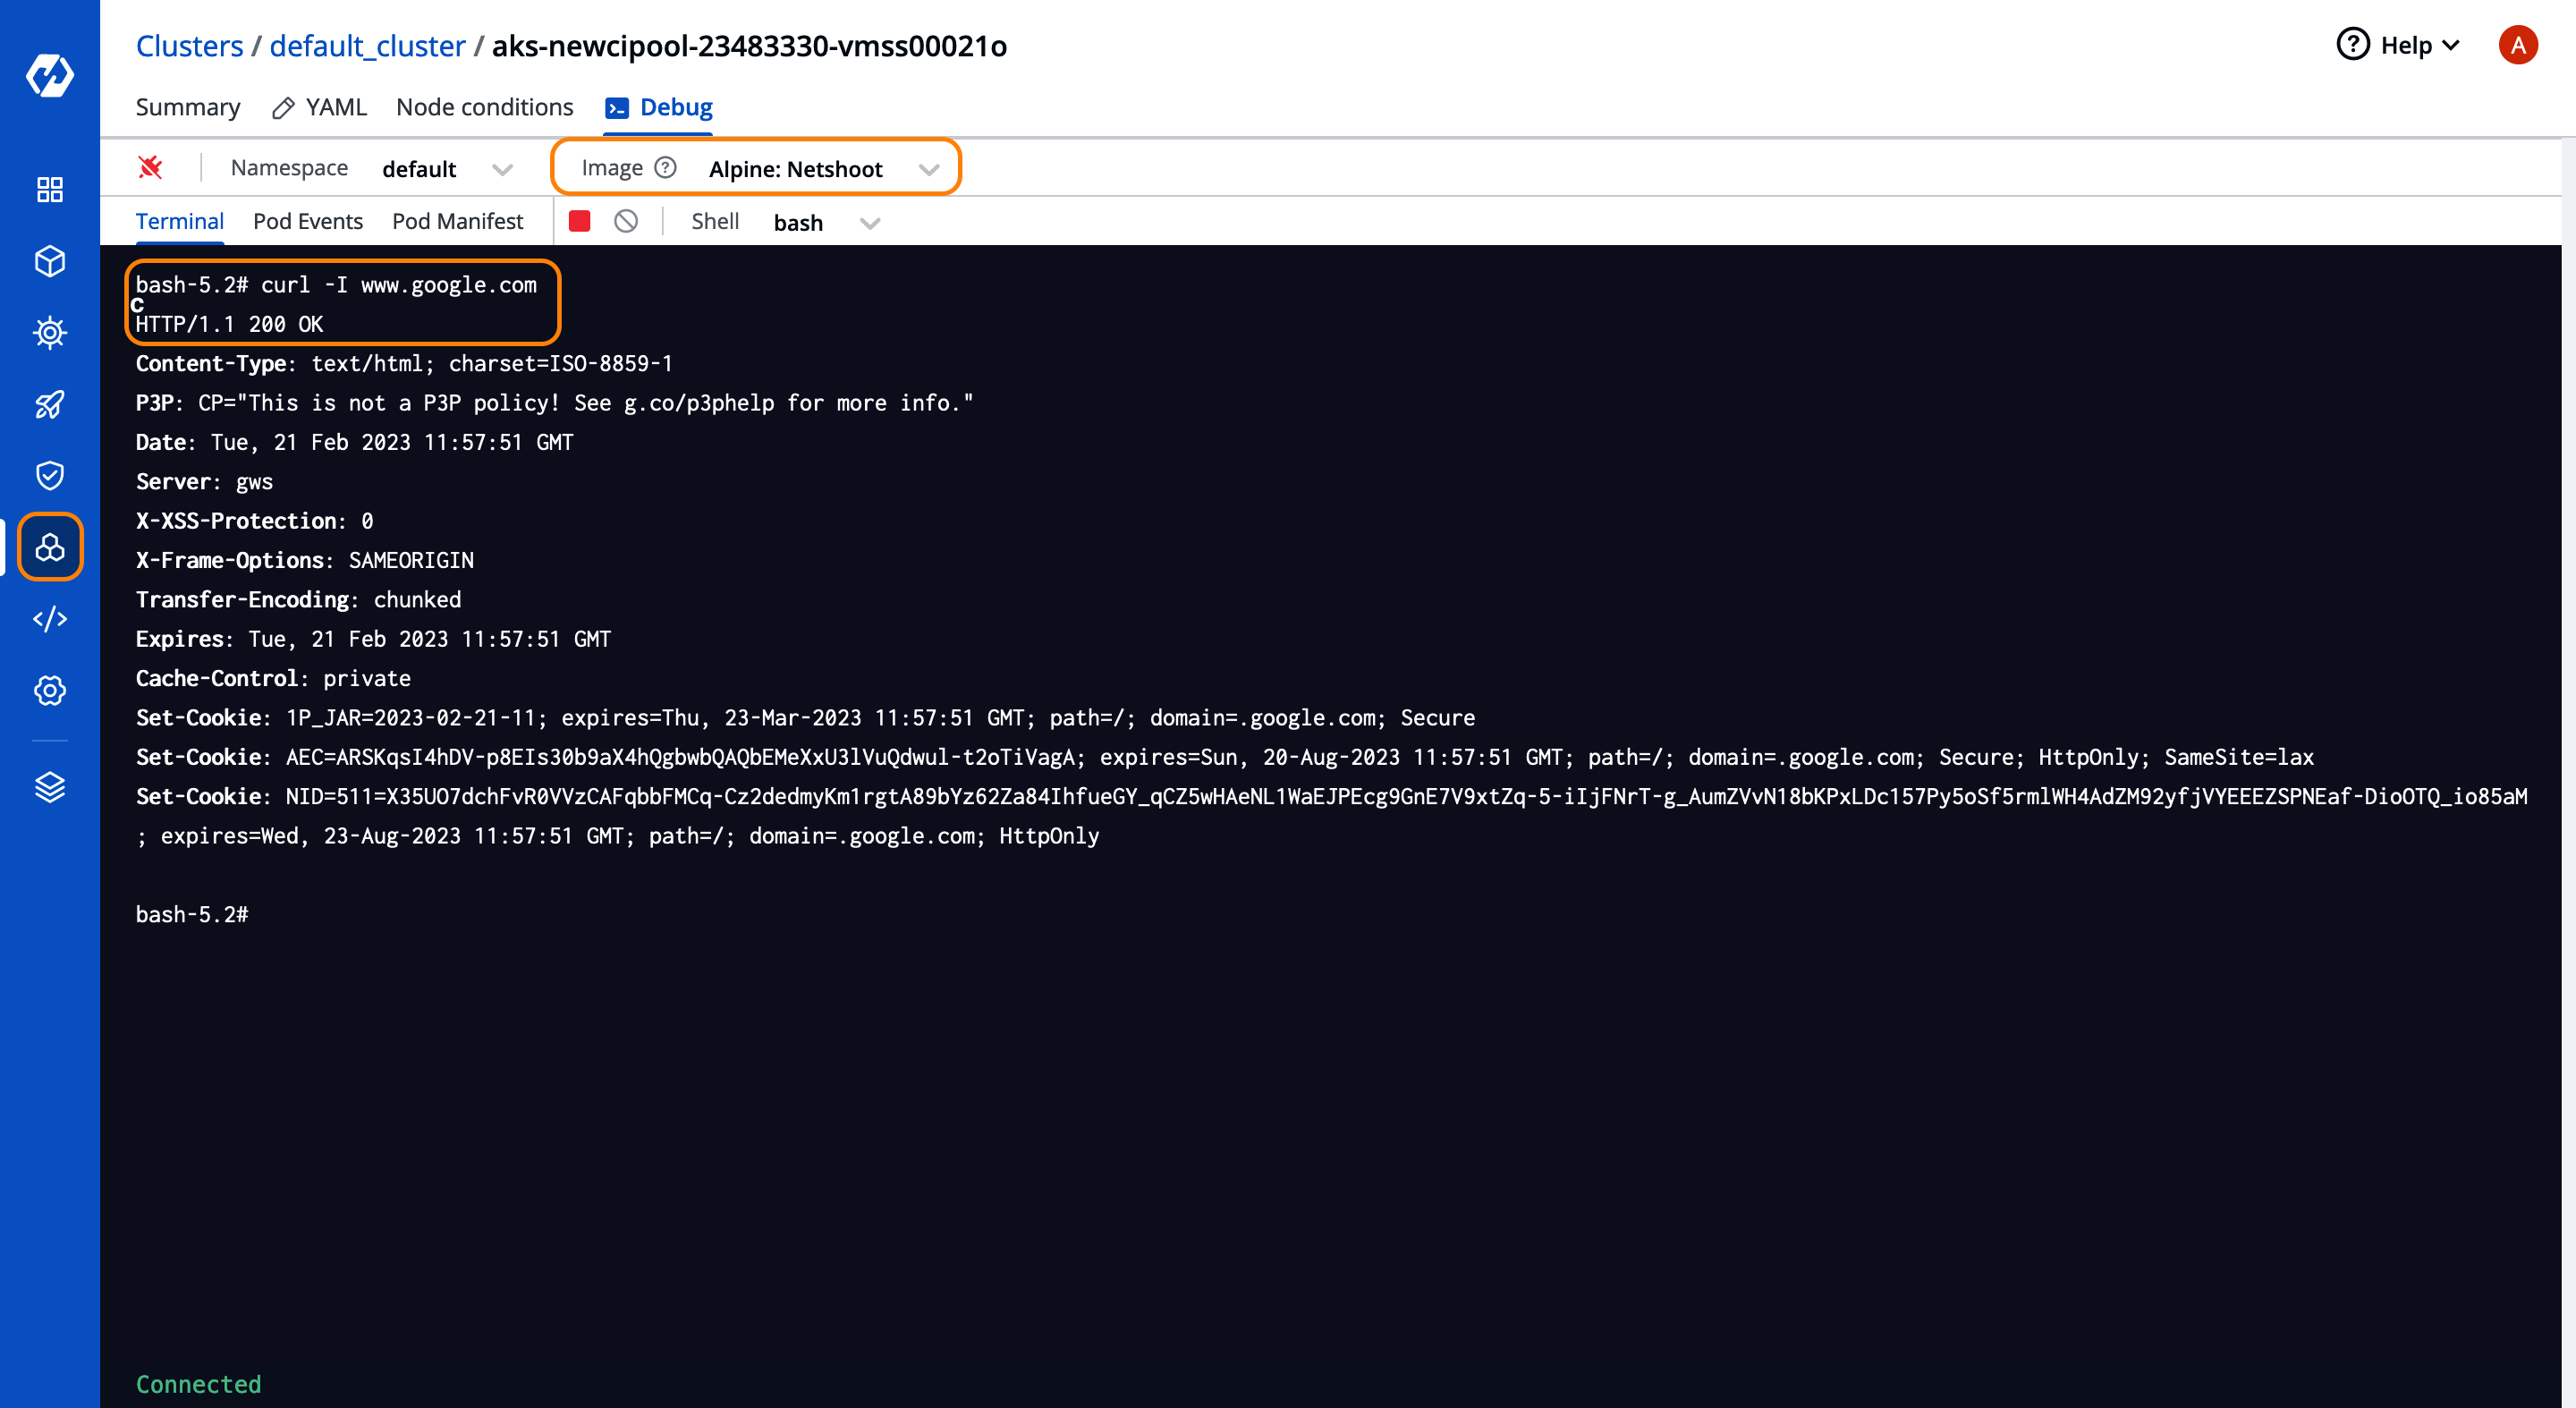
Now you can simply open the cluster wide terminal in any node you want to and figure out with all the pre-installed net-tools command line utilities you get in different images. Additional tasks like verifying if the pod can resolve the DNS and checking pod communications across namespaces have become a breeze. If you want to troubleshoot the network you can choose the netshoot image while creating the pod for debugging. It ships with all the network debugging tools like nmap, tcpdump, iptables, tshark etc.
Let's run a check and see if the node can resolve www.google.com or not. We can execute a curl command i.e, curl -I www.google.com from inside the terminal of the node. This will ensure that we are connected to the wider internet.
Use-Case 2: Fix an entry in DNS ConfigMap
To triage issues related to DNS ConfigMaps, you can edit the coredns configmap using kubectl command right from the node terminal. As you can see in the below image, you can select the namespace and image where you want to launch this terminal and execute your traditional kubectl commands.
kubectl edit configmap coredns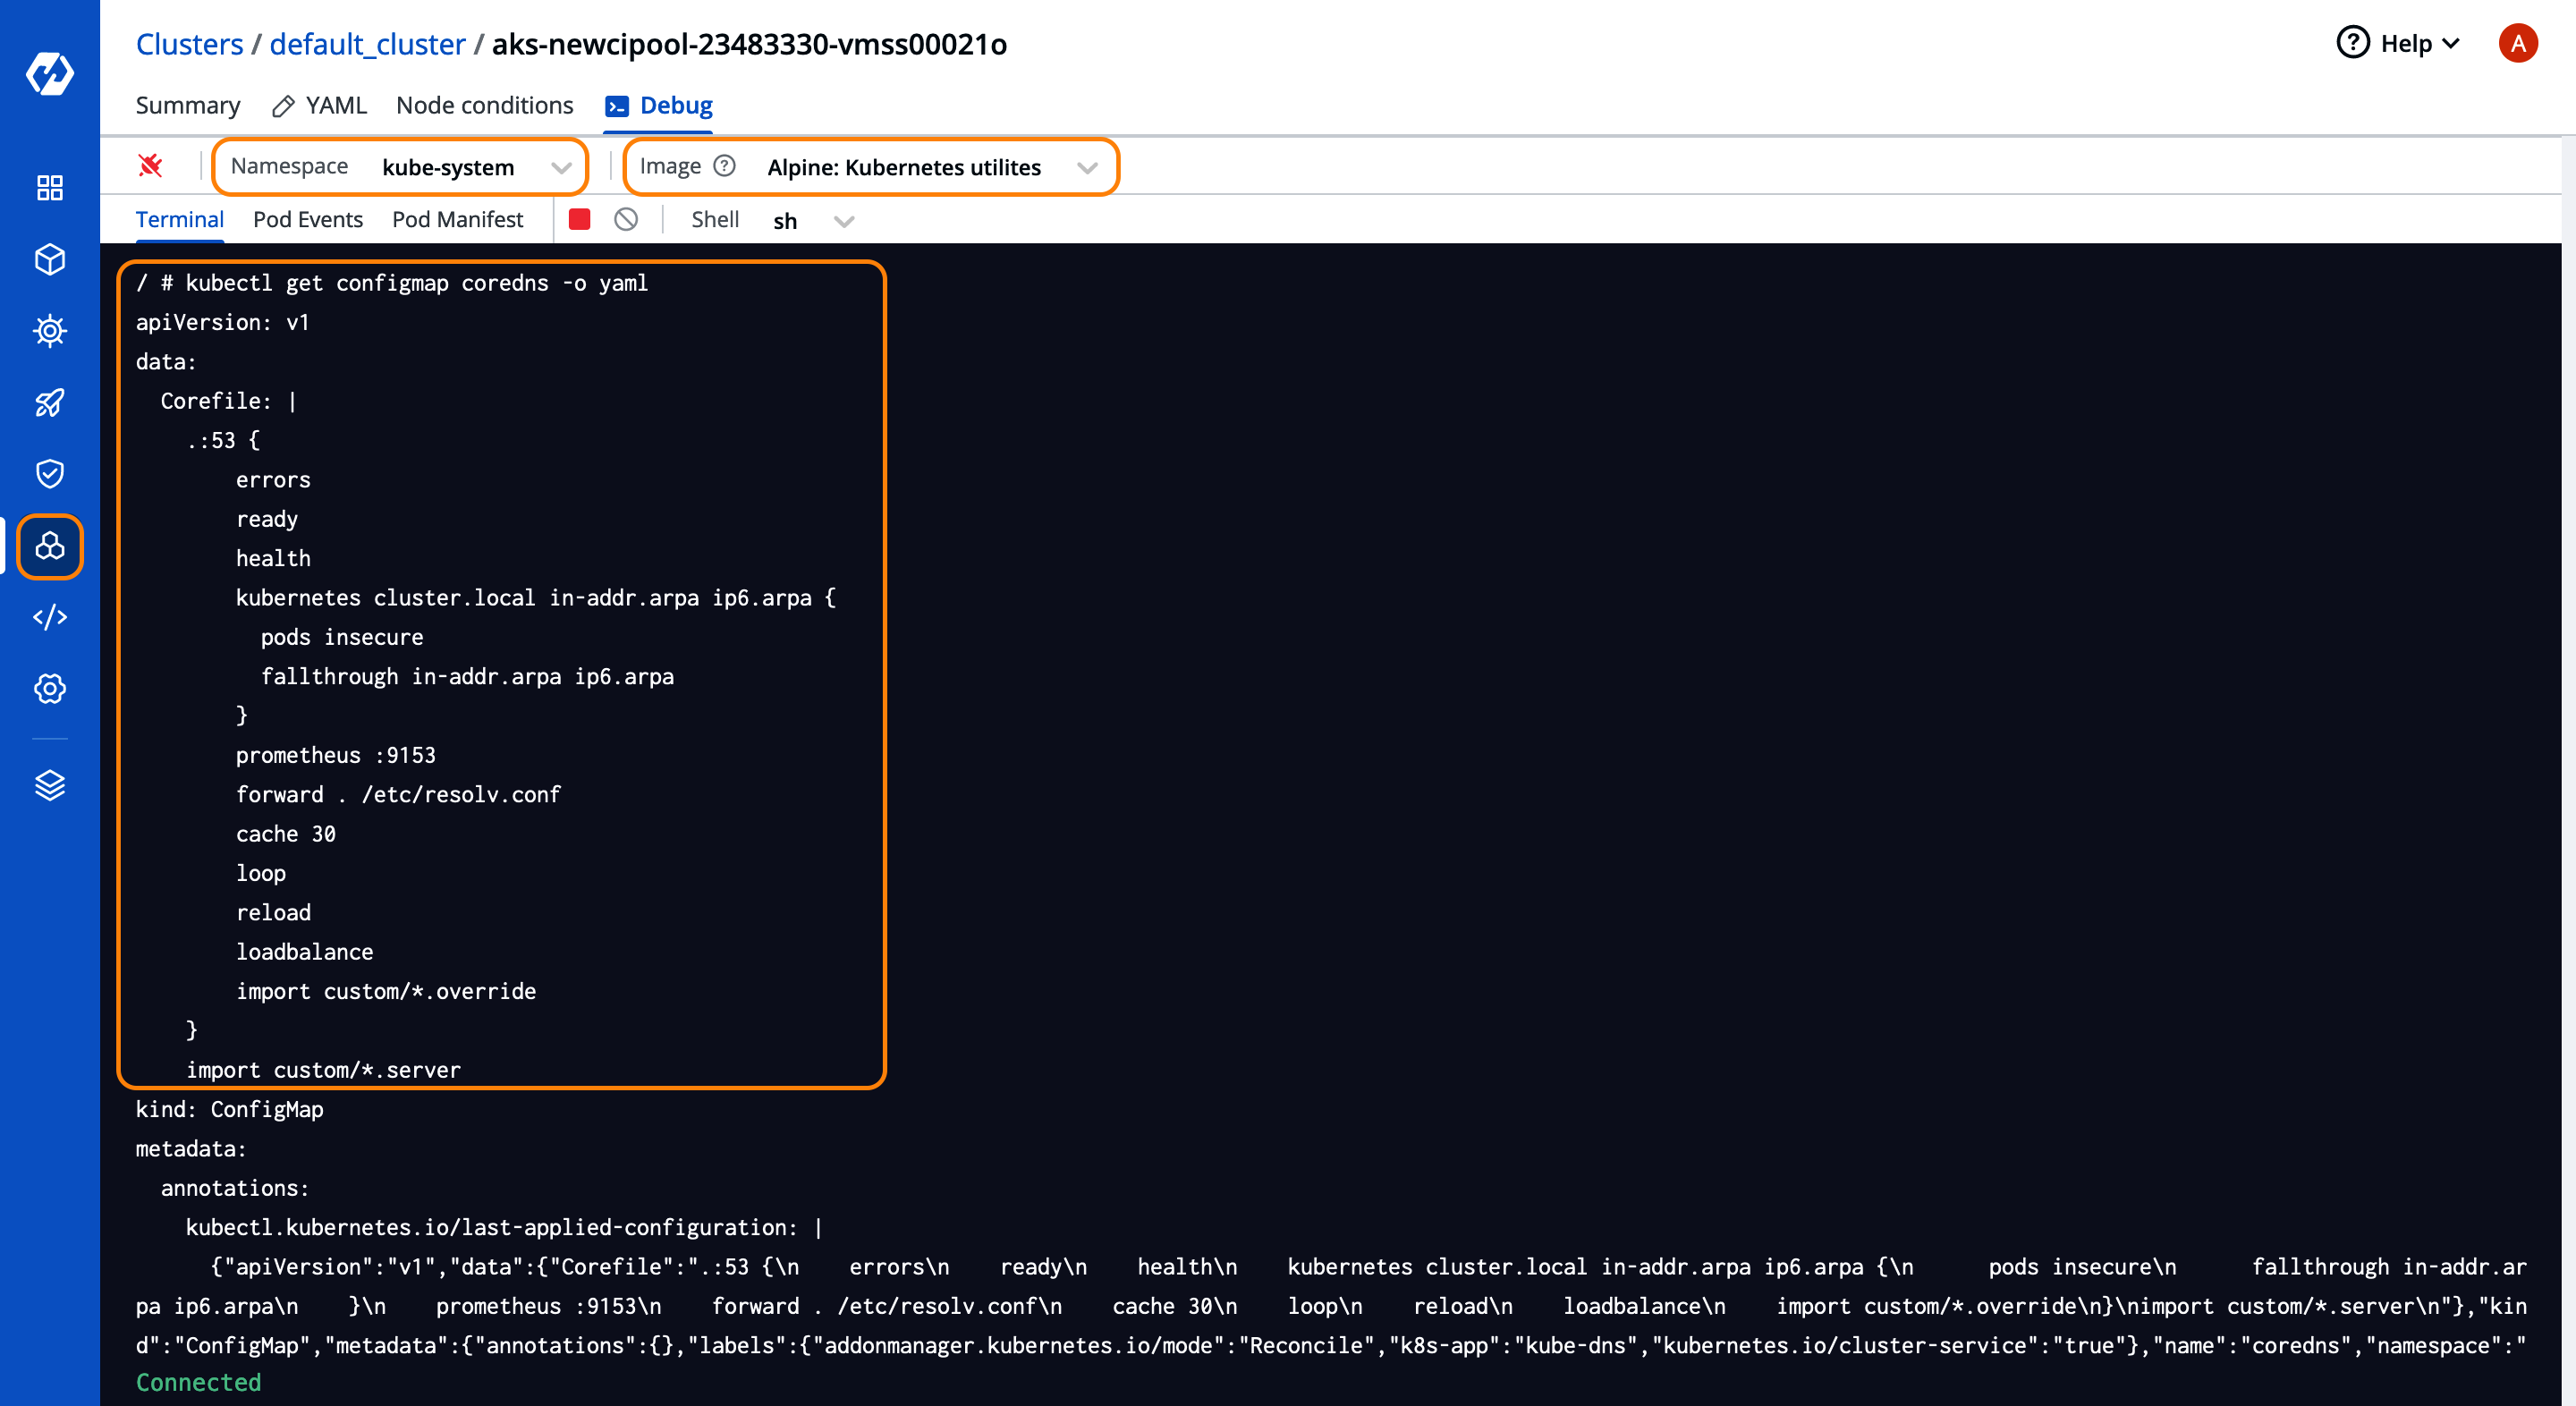
Use-Case 3: Authentication to the API server
If you’re interested in knowing more about how we are authenticating with api-server you can execute the following command.
kubectl get pods -v 7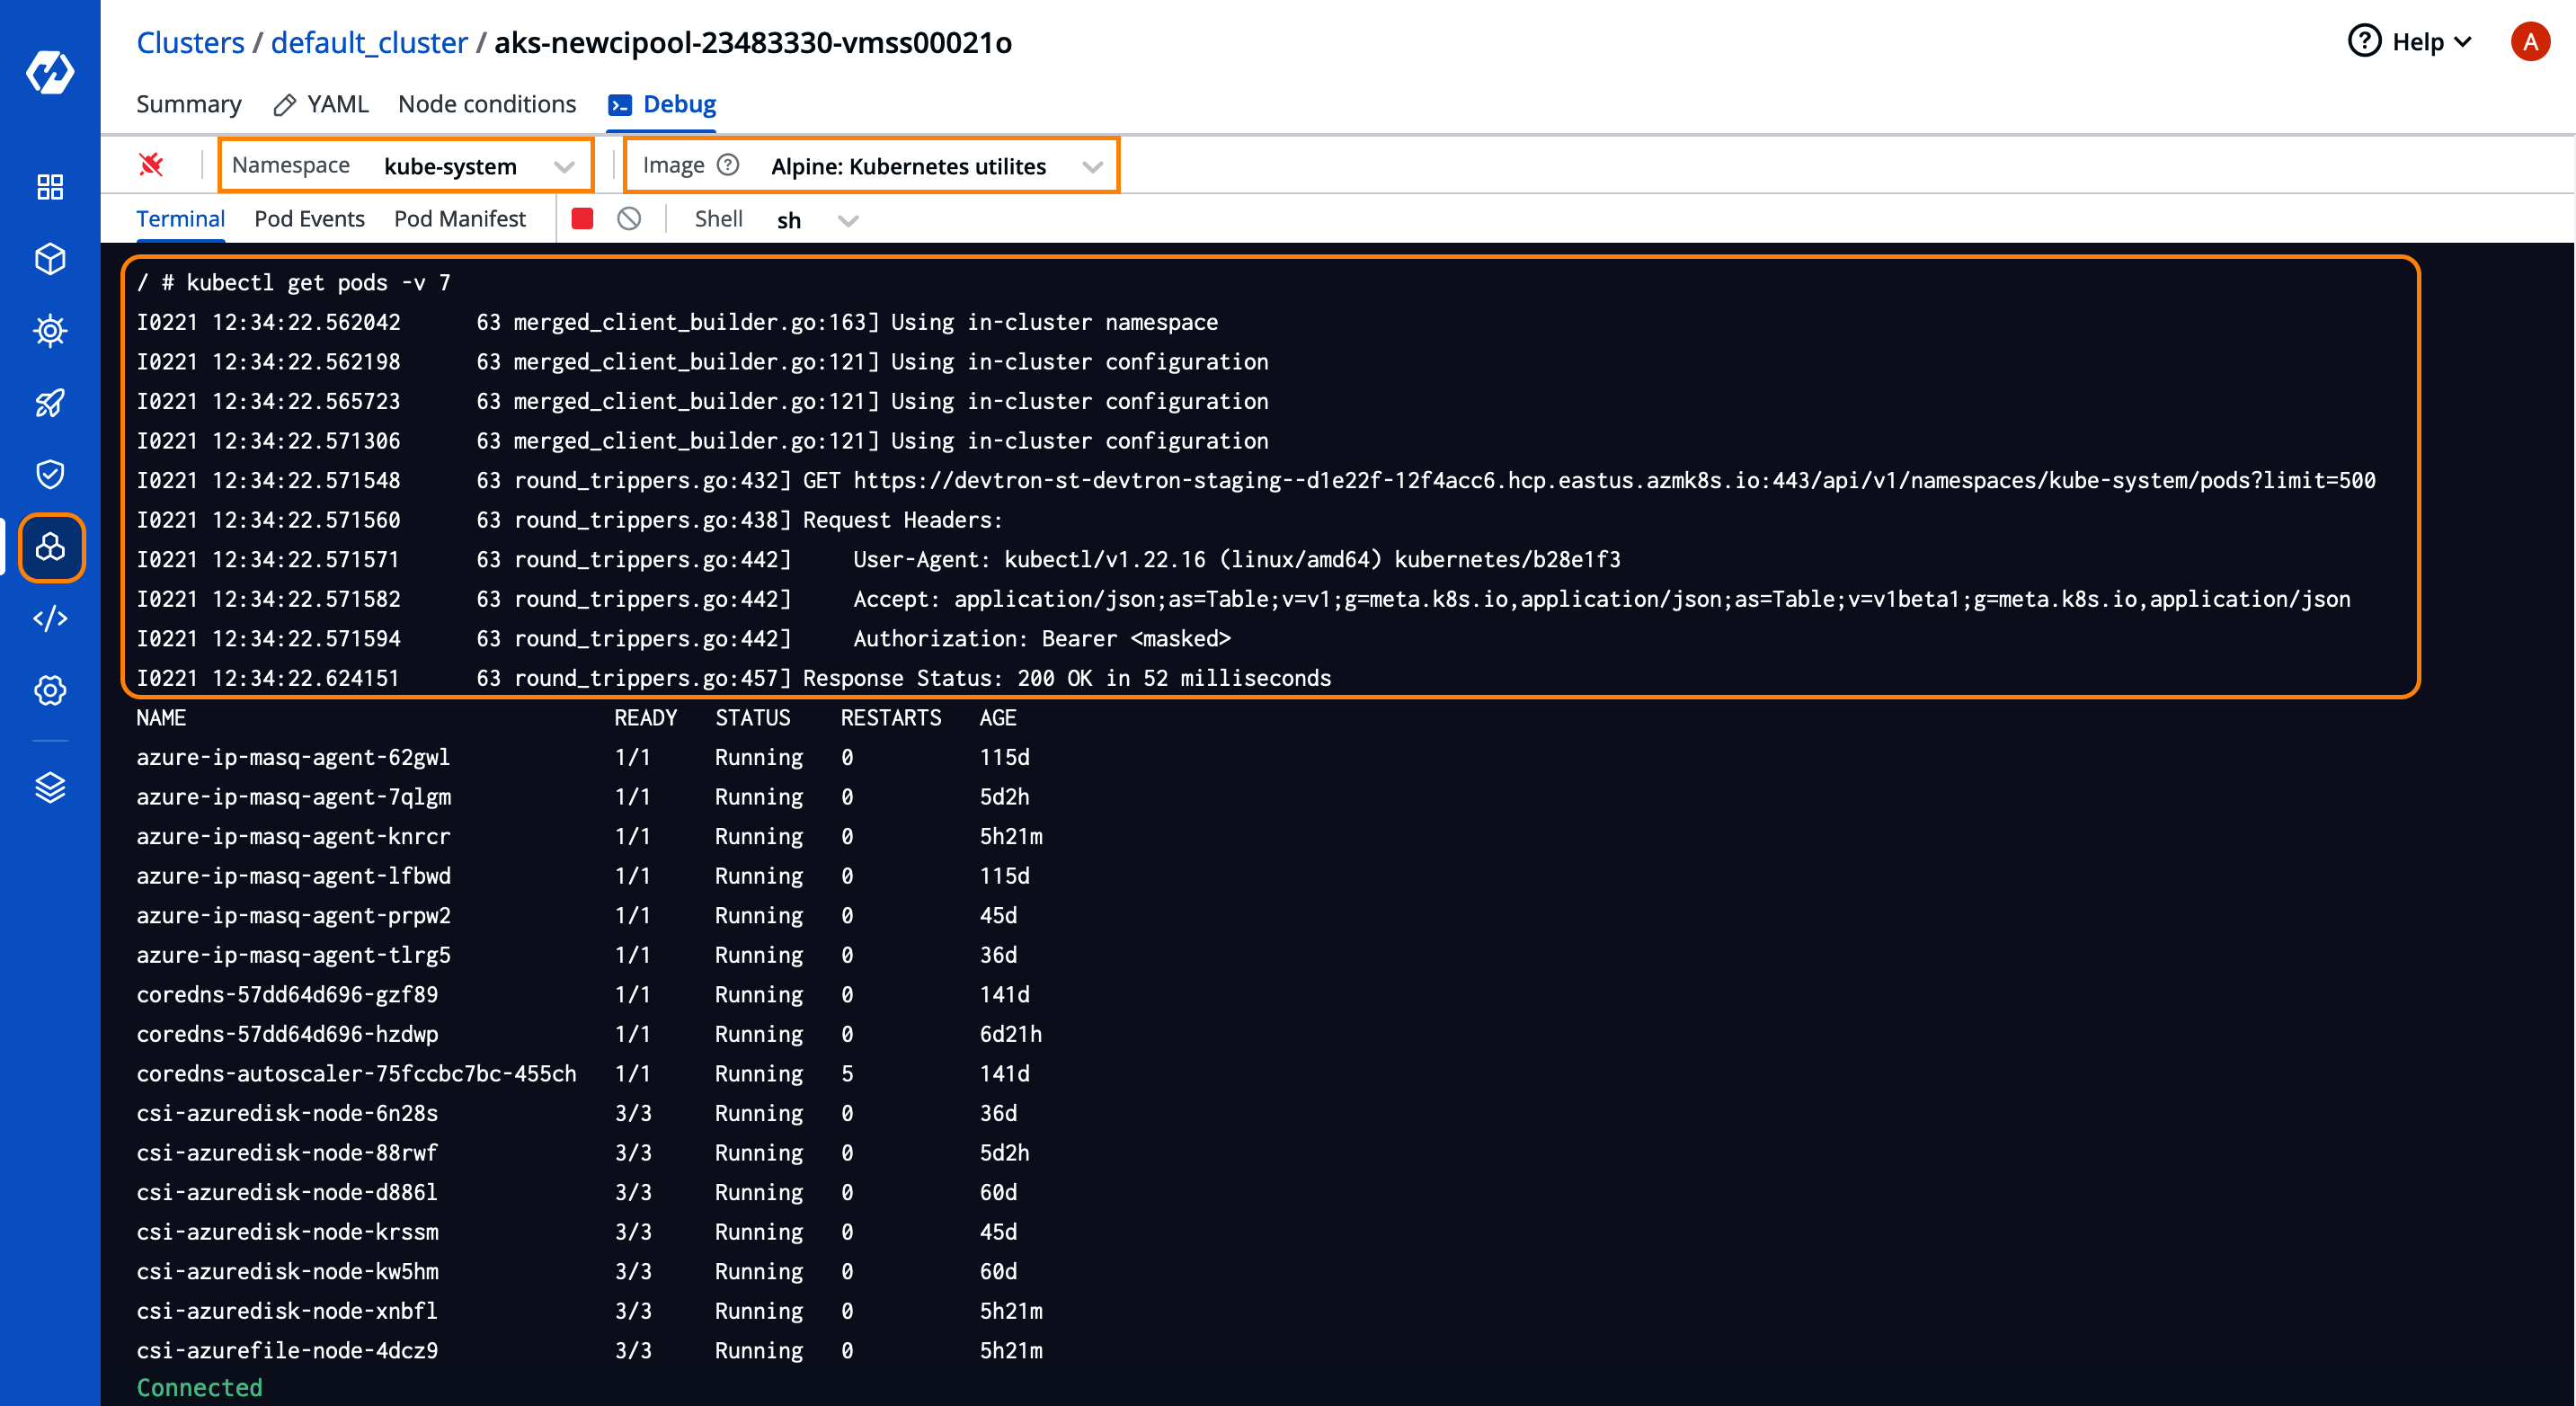
Conclusion
In this blog, we learned about how Cluster Terminal Access can make the debugging experience a lot easier and faster for DevOps professionals and all through the single pane dashboard by Devtron. Cluster access is one of the many features that Devtron comes with and its Kubernetes Dashboard provides the end to end solution for all your Kubernetes operations.
Feel free to connect with us on our community discord server and give it a star ⭐️ on GitHub if you like the project.
FAQ
What is Cluster Terminal Access in Devtron?
Cluster Terminal Access allows DevOps engineers to debug and manage Kubernetes nodes directly from the Devtron dashboard—without using kubectl or SSH.
Provides in-browser terminal access to any Kubernetes node.
Helps troubleshoot issues without switching tools or exposing kubeconfig.
Enables secure access with limited session time and RBAC restrictions.
How do you open the Kubernetes cluster terminal in Devtron?
Devtron offers two ways to launch the terminal for any cluster node:
From the “Clusters Overview” by selecting the desired node and clicking Debug.
From the top-left “Terminal” button in the Clusters section for global access.
Terminals are preloaded with tools (curl, kubectl, netshoot, etc.) to assist in debugging.
Can I use custom Docker images in Devtron’s terminal?
Yes, Devtron supports using custom public Docker images for debugging purposes.
Just provide the public image name (e.g., derailed/k9s).
Devtron will pull the image and launch it in the terminal.
Useful when your team has predefined CLI toolsets inside a custom image.
What are the use cases for using Devtron’s Cluster Terminal Access?
Cluster Terminal Access is built to streamline real-world Kubernetes debugging scenarios:
Network troubleshooting: Use netshoot for DNS, connectivity, and firewall checks.
Editing CoreDNS: Update coredns ConfigMap directly from the terminal.
API server authentication: Debug Kubernetes auth flow using kubectl -v7.
Helps resolve node-level issues without installing additional pods or accessing SSH