Taking your Kubernetes microservices from development to production requires careful planning and configuration. This checklist outlines the essential steps to ensure a smooth and successful go-live process, promoting stability, scalability, and high availability for your applications.
1. Calculate Per-Pod Capacity
- Why it matters: Knowing your pod's capacity helps set appropriate resource requests and limits, crucial for autoscaling and application stability.
- How to do it: Tools like JMeter can simulate load on your application to determine the maximum workload a single pod can handle without performance degradation.
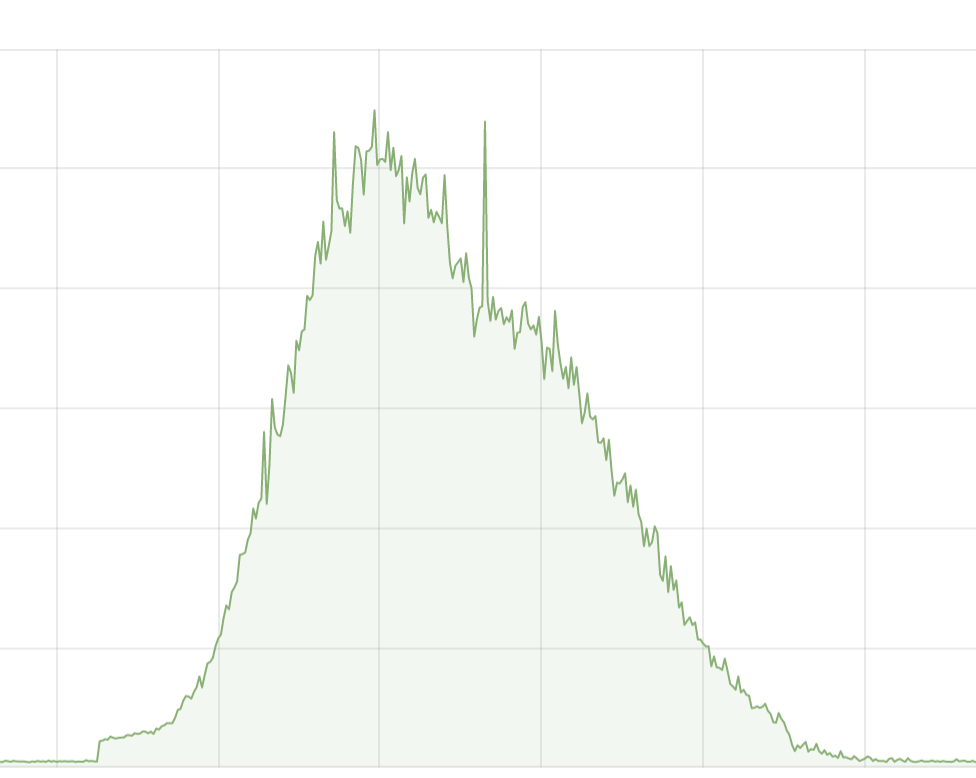
Metrics to consider:
- Requests Per Minute (RPM) your pod can handle efficiently.
- Maximum memory consumption during peak load.
- CPU utilization at peak load.
2. Configure Resource Requests and Limits
Understanding the difference
- Requests: Minimum guaranteed resources a pod receives from Kubernetes.
- Limits: Maximum resource allocation a pod can consume.
	resources:
		memory:
			limits: 3.5Gi
			requests: 3Gi
		cpu:
			limits: 1
			requests: 1
Setting values based on per-pod capacity
Memory:
- Requests: Use the maximum memory consumption observed during the capacity test, with a 10-15% buffer for unexpected spikes.
- Limits: Set slightly higher than requests to accommodate short-term bursts.
CPU:
- Requests: Set based on CPU utilization at peak load, with a 10% buffer for headroom.
- Limits: Consider keeping CPU limits the same as requests unless throttling is acceptable during high traffic.
Pro tip: Utilize cpuManagerPolicy: static on worker nodes to grant pods with specific resource characteristics exclusive CPU access for improved performance.3. Configure Autoscaling
Choosing the right metrics: While CPU and memory utilization often suffice, consider event-based metrics (queue lag, upstream application throughput) for specific use cases.

Setting autoscaling based on per-pod capacity:
- Calculate Target CPU Utilization Percentage: (Max CPU utilization at peak load / CPU request) * 100. Implement autoscaling before reaching this value. Take a buffer of 15-40% for setting the Target CPU Utilization Percentage depending on the nature of your application.
- Similarly, calculate Target Memory Utilization Percentage based on memory consumption and requests, implementing autoscaling with a 15-30% buffer.
4. Ensure High Availability
- Run multiple pod replicas: Distribute workload across replicas for redundancy. If one replica fails, others can handle traffic seamlessly.
- Spread replicas across Availability Zones (AZs): Enhances fault tolerance. If an AZ fails, replicas in other zones keep the application operational.
- Enable Pod Disruption Budgets (PDBs): Maintains application stability during disruptions (updates, node maintenance) by ensuring a minimum number of pods are always available.
- Multi-AZ Kubernetes cluster: High availability starts with the underlying infrastructure. Deploy your Kubernetes cluster across multiple AZs for resilience against zone failures.
5. Configure Probes
Types of probes:
- Liveness probes: Assess pod health and functionality.
- Readiness probes: Determine if a pod is ready to receive traffic.
- Startup probes: Verify successful container startup within a pod.
Importance of meaningful probes: Define checks that accurately reflect application health and readiness.
- Liveness probes could check critical endpoint responsiveness.
- Readiness probes could verify necessary dependencies are available before traffic routing.
Probes empower Kubernetes: They enable self-healing (restarting unhealthy pods), autoscaling (scaling based on pod health), and effective load balancing.
6. Implement Application Monitoring and Alerts
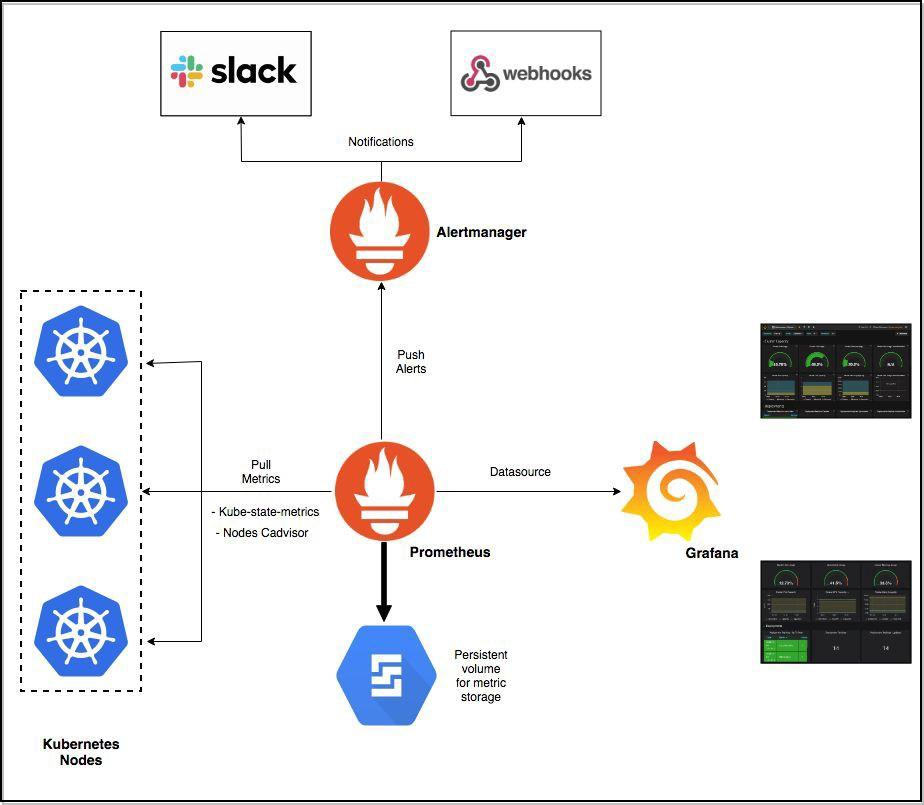
Monitoring essentials:
- Resource utilization (CPU, memory, disk I/O, network traffic) using tools like Metrics Server, Prometheus, and Grafana.
- HTTP status codes to identify endpoint availability issues, server errors, and client-side errors. Utilize readiness probes or external HTTP monitoring services.
- Centralized logging (EFK stack or Loki with Grafana) for troubleshooting and gaining application insights.
- Advanced monitoring for performance bottlenecks (distributed tracing with Jaeger or OpenTelemetry, application-specific metrics with Prometheus exporters or APM tools like Datadog).
Alerting for proactive issue detection: Set up alerts based on predefined thresholds or anomaly detection for key metrics. Integrate with alerting platforms (Prometheus Alertmanager, Grafana) or incident management systems ( Zenduty, Pagerduty ) for automated incident response process.
Conclusion:
By following this comprehensive checklist, you can ensure your Kubernetes microservices are well-prepared for production deployment. Remember to continuously monitor, refine, and adapt your approach as your application and infrastructure needs evolve. This will guarantee optimal performance, reliability, and a seamless user experience.
If you have any queries, don't hesitate to connect with us. Join the lively discussions and shared knowledge in our vibrant Discord Community.