In the modern era of the software industry, microservice architecture and Kubernetes have become the globally adopted solution, for organizations looking for scalability and operational efficiency. At one end where these cutting-edge technologies help organizations operate at scale, navigating through their complexities can be challenging, where you are bound to face the errors and misconfigurations that will hinder your pace of getting to production servers. This blog post will discuss the most common Kubernetes errors and solutions for them.
Kubernetes issues can be complex, but troubleshooting them doesn’t have to be. Devtron helps you diagnose and resolve problems faster with automated insights and real-time visibility.
The Errors We Will Be Discussing Are:
- Container CRASHLOOPBACKOFF issue (OOM Killed and CPU throttling).
- ENV variables/secrets mount issue.
- DB Connectivity issue.
Container CRASHLOOPBACKOFF issue
Let’s first understand the issue, the CRASHLOOPBACKOFF issue is generally faced when the container crashes due to an internal code failure, or it is unable to connect to its required dependencies. The Kubelet is responsible for creating the pods and starting the container within them. As the container keeps crashing, the kubelet constantly tries to restart the container, leading to a crash loop. In this crash loop, there is some time delay in the process of container crashing and container restarting that’s the backoff time, and the backoff time keeps increasing with each restart.
So to understand the flow of CRASHLOOPBACKOFF let’s take an example: Imagine we want to deploy a containerized application in Kubernetes pod, once we initiate the deployment pipeline the flow will be as follows: Container > Container Running > Container Stopped (Reason CRASHLOOPBACKOFF). Now that the container has failed to get started, the Kubelet will try to restart the container after a fixed time delay such as 3 sec. After 3 seconds, the container will be restarted, however, as there is a misconfiguration the container will fail again. Once again there will be a delay before the container is restarted and this time, the delay will be 6 seconds before the cycle continues.
Now that we know what CRASHLOOPBACKOFF is, let’s look at the common causes:
- OOM Killed
- CPU Throttling
OOM Killed
The most common cause of a CRASHLOOPBACKOFF error is an application running out of memory, commonly known as OOM Killed. This can be caused by a memory leak in code or a lack of resources on a specific node to run the application, i.e., a node with less memory allocated than the application's actual requirement.
Troubleshooting the OOMKilled error involves fixing the allocated resources according to the application's requirements. If the cause of the error is an issue like a memory leak this can be fixed by performing optimization at the application code level.
Troubleshooting CRASHLOOPBACKOFF caused by OOM Killed:
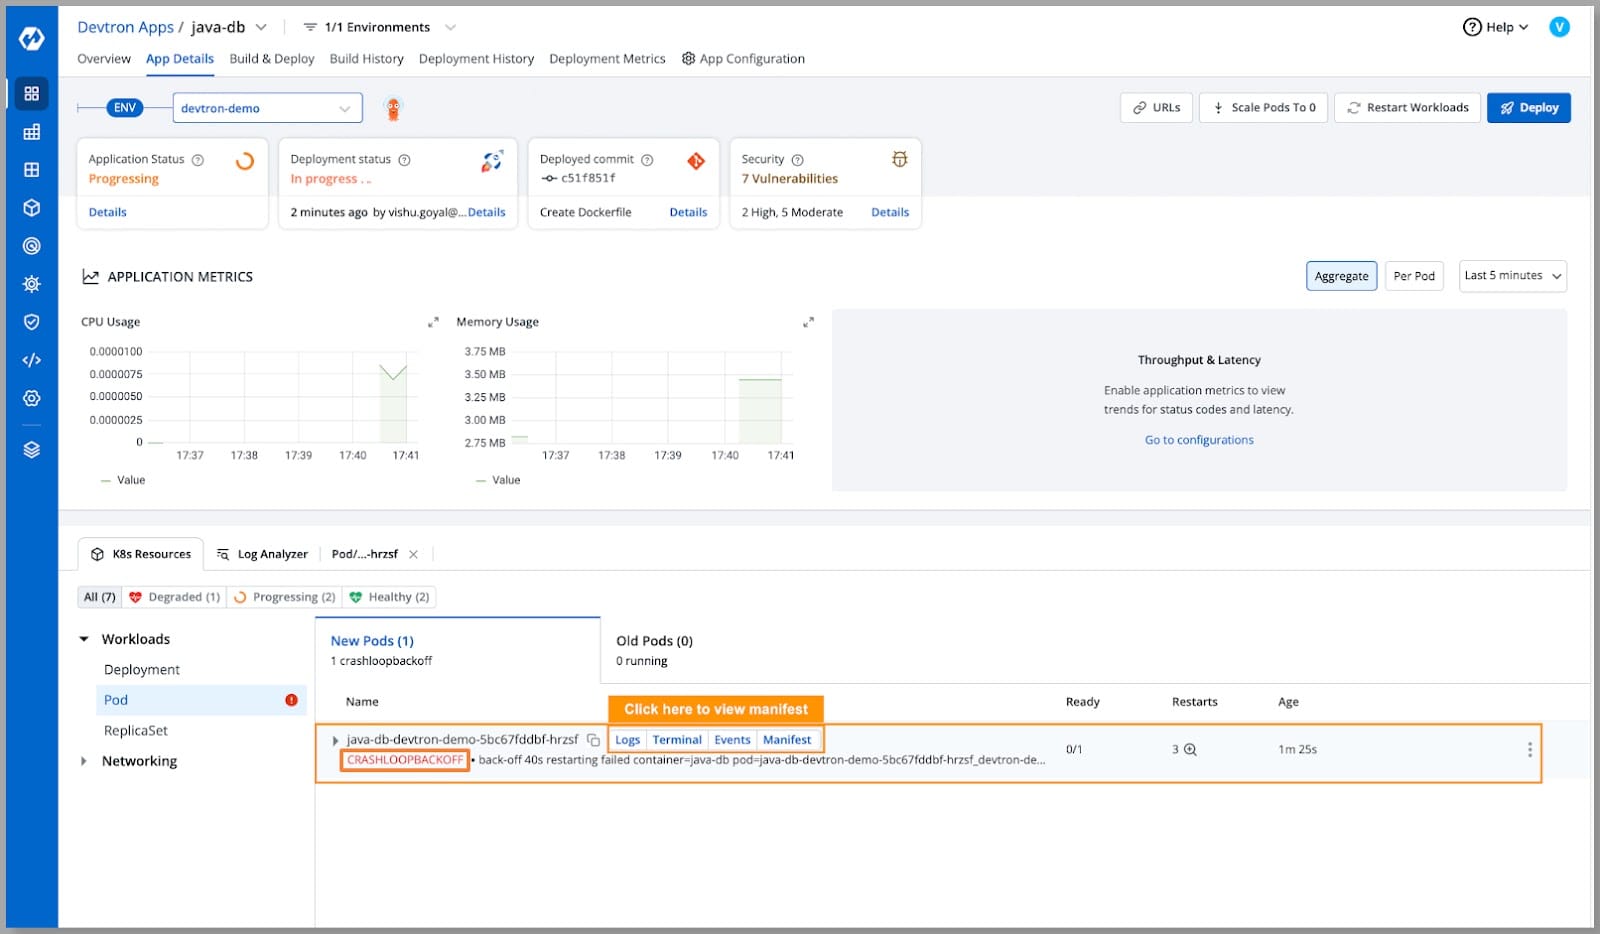
Step 1: Deploying the application to Kubernetes.
- While deploying our Java application to our Kubernetes cluster, we faced the issue stating CRASHLOOPBACKOFF let’s investigate and try to find the solution.
Step 2: Understanding the cause
- The first step to troubleshooting any error is understanding the real cause behind the issue. Let’s look at the manifest of our pod in which the container is running.
- View the manifest by clicking manifest from pod operations.
- On viewing the manifest we can see the reason as OOM Killed and below we can see that the container is failing to start and also the current back-of-time is in the 40s.
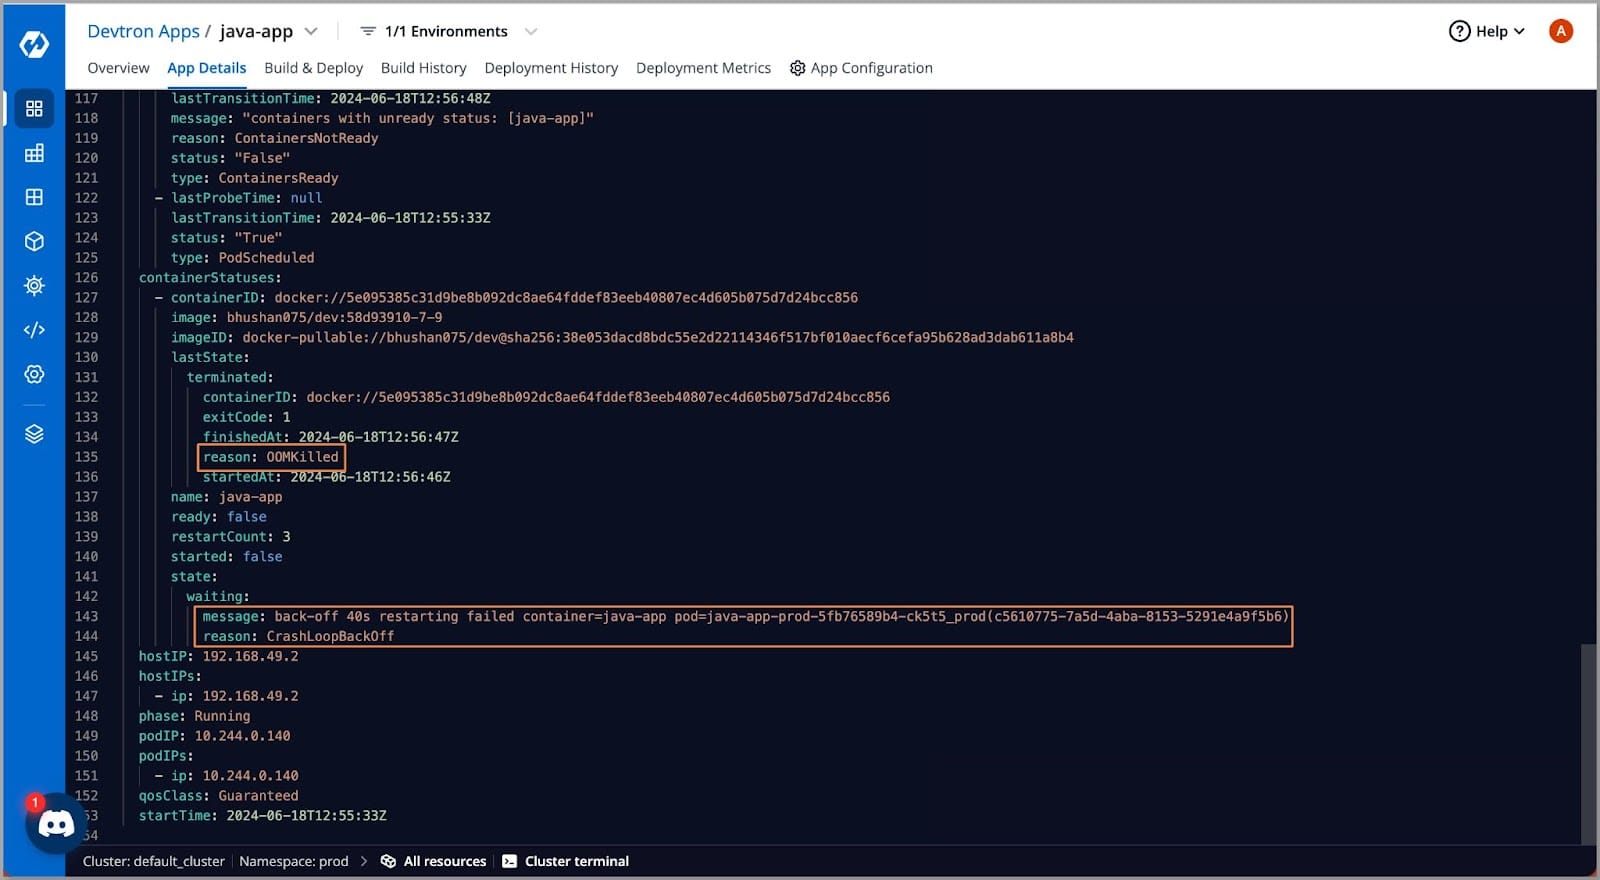
- The reason behind the CRASHLOOPBACKOFF error we getting is OOM Killed. Let’s look at how we can troubleshoot the error.
Step 3: Troubleshooting the error
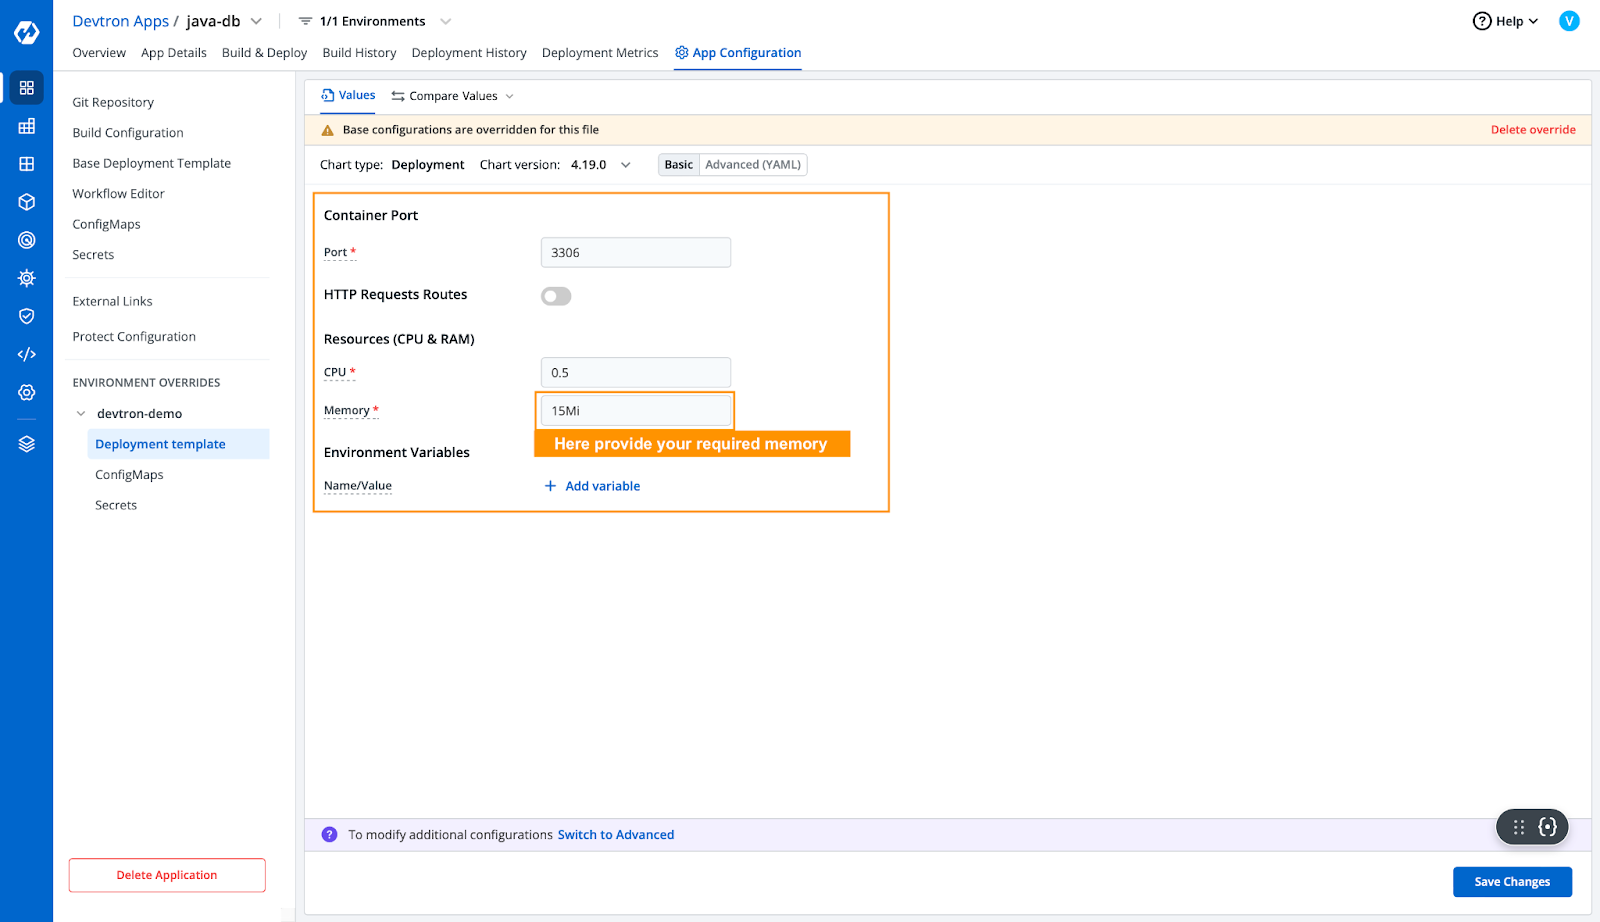
- The OOM Killed error arises due to insufficient memory. That means the application requires more memory than allocated. Let's try increasing the allocated resources from the application deployment template.
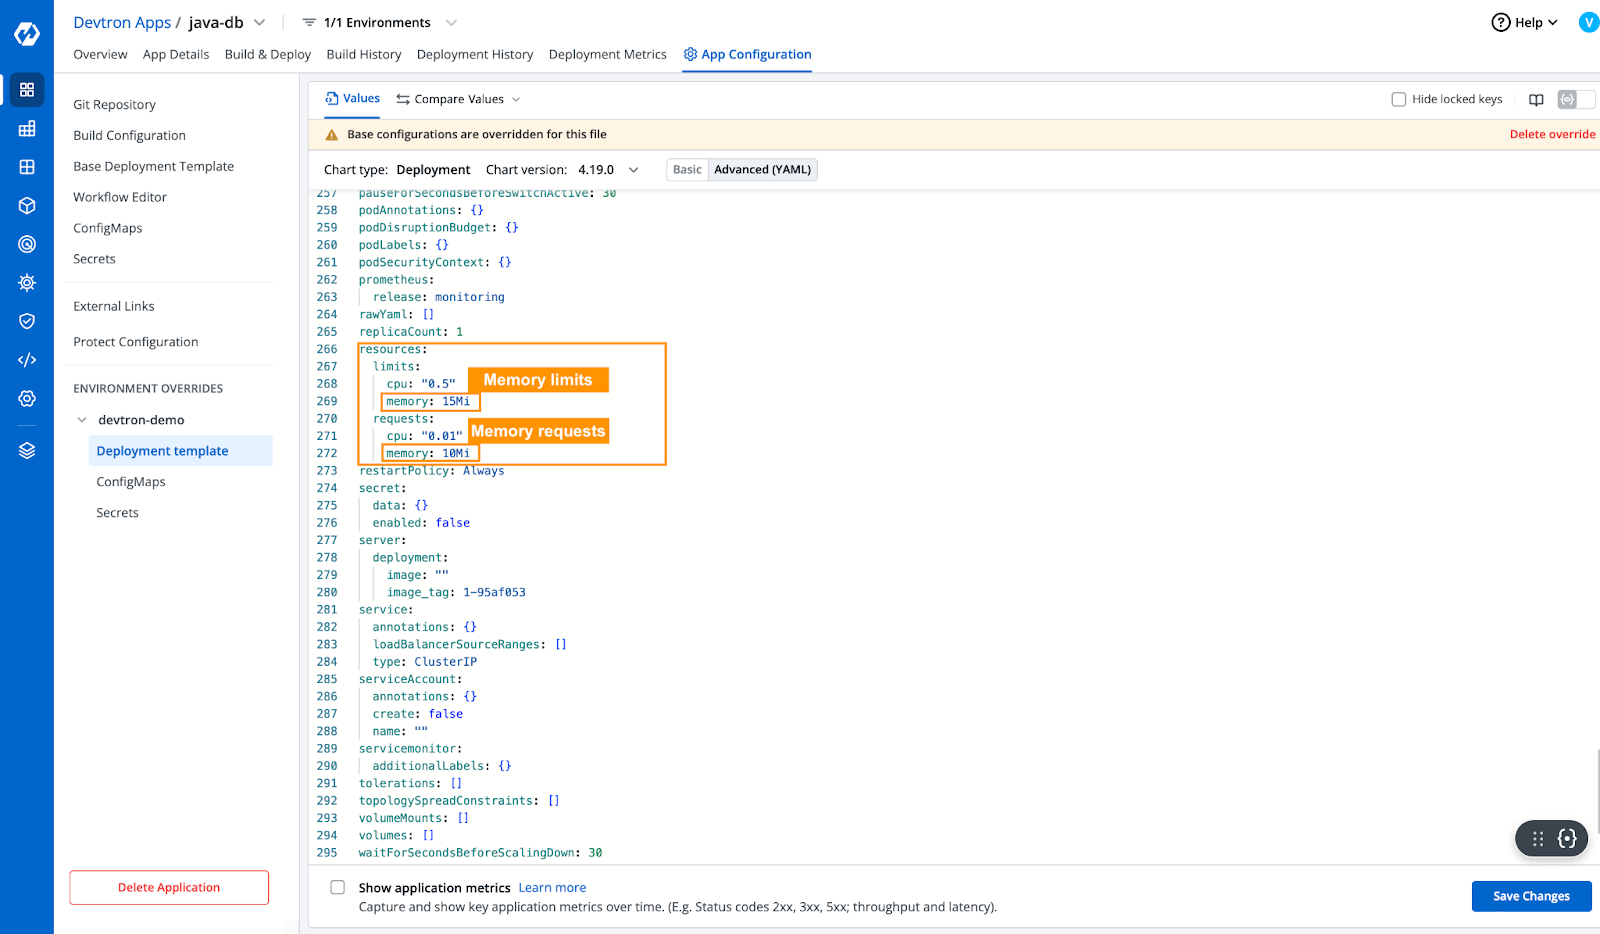
- After updating the required resources in the deployment template, to make sure we will check in the advance yaml deployment template whether the resources have been updated or not.
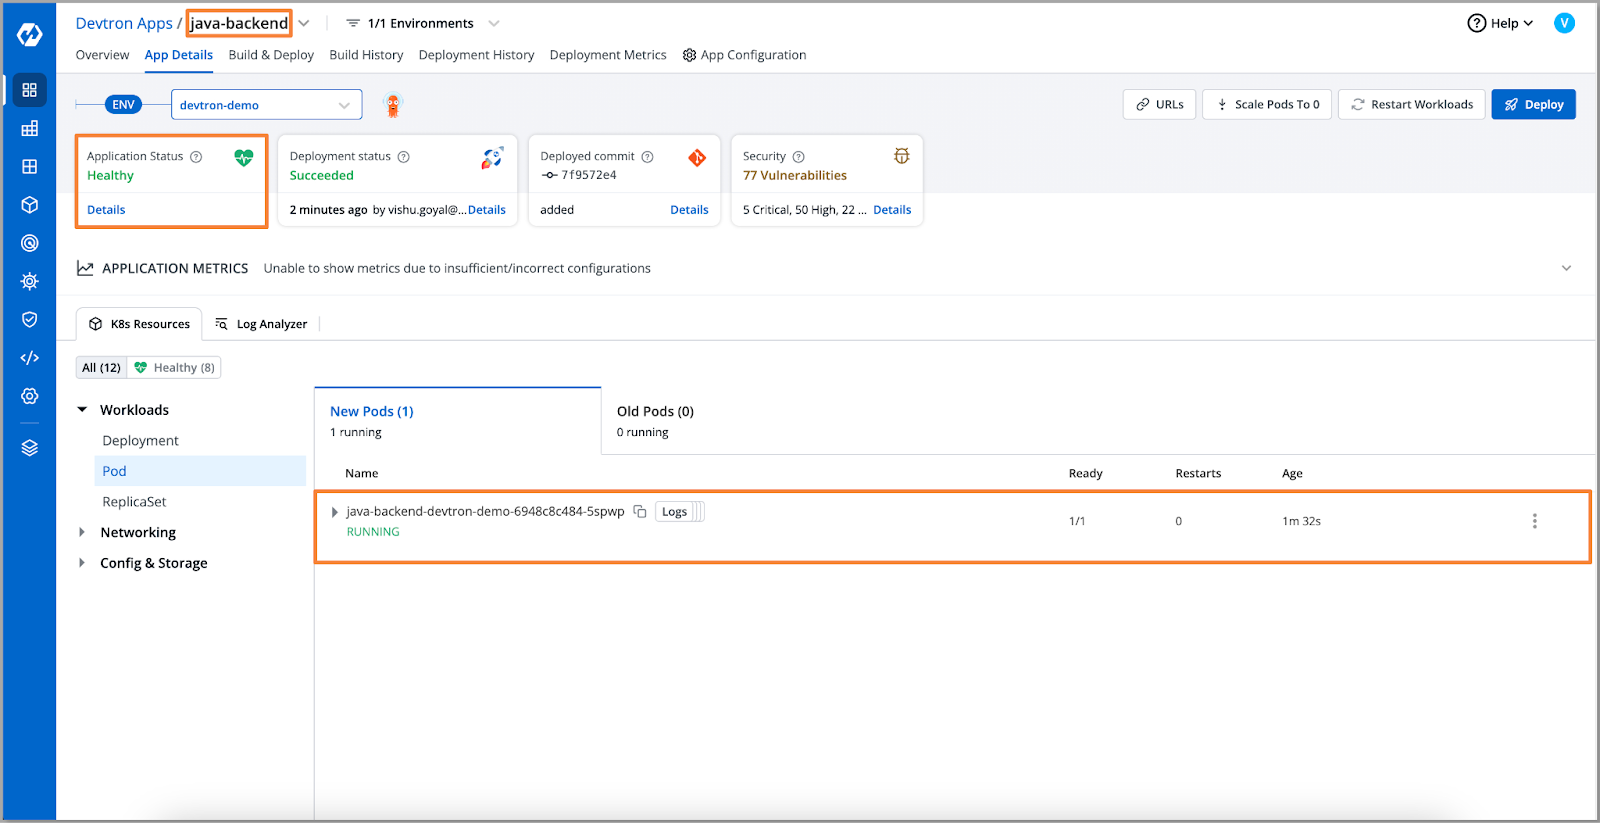
- Now that we have increased the resources for our application, let’s deploy the application and see if it runs smoothly.
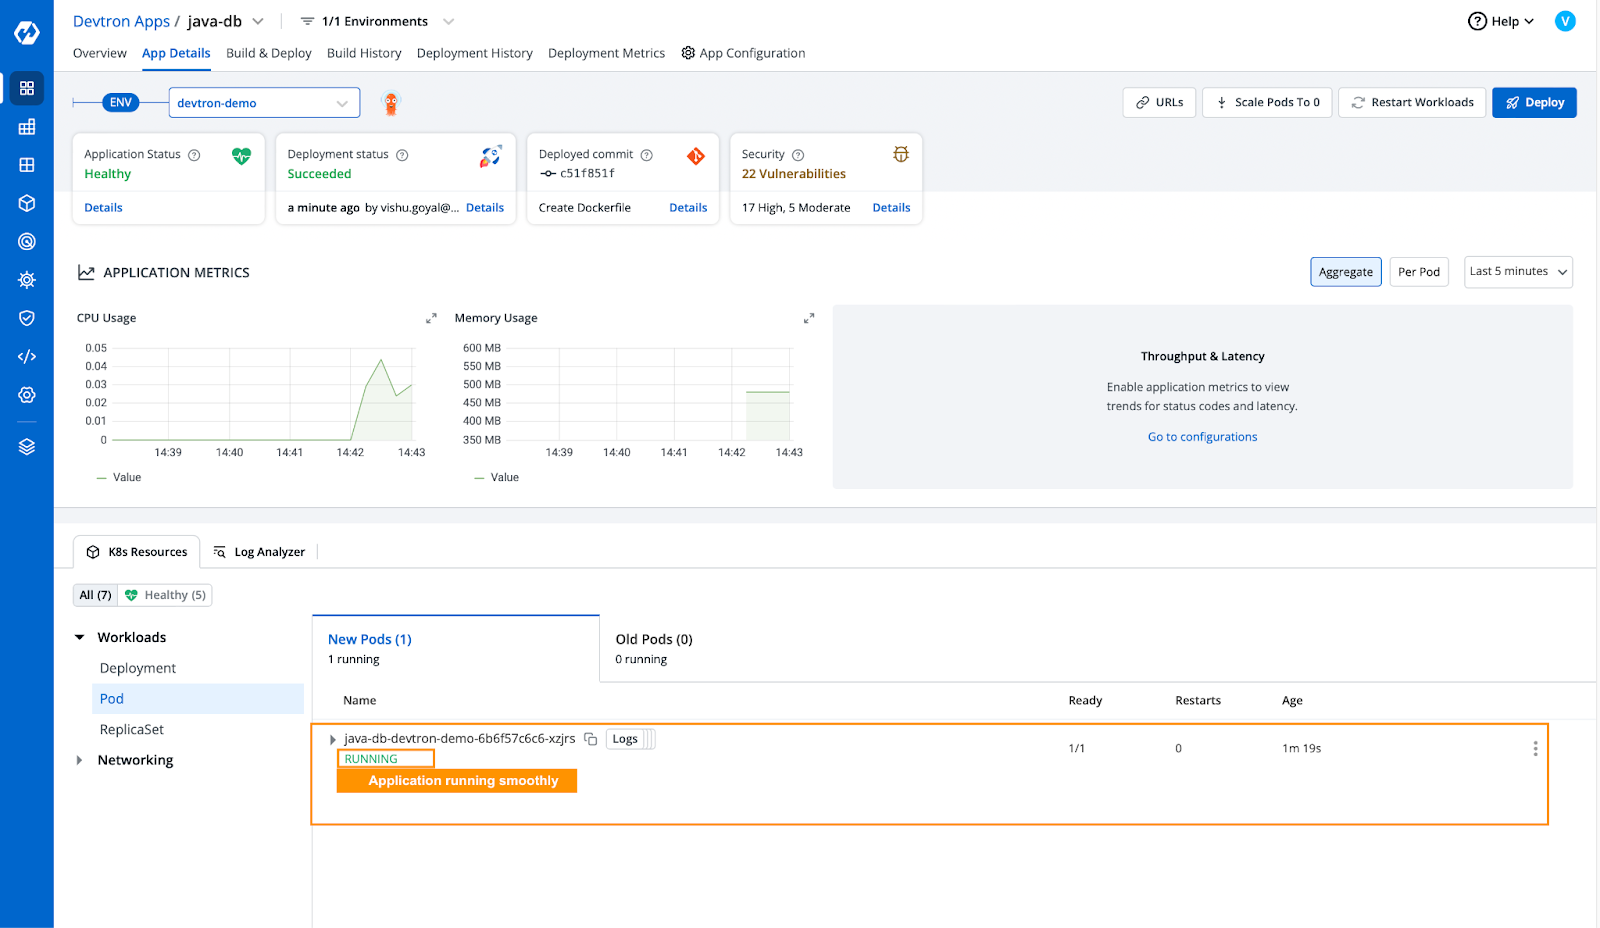
- Our application has been deployed successfully and is running smoothly.
CPU Throttling
After resolving the OOMKilled issue by increasing the pod's memory allocation, our application is up and running. However, we're facing a new challenge: performance is below expectations and the pod is restarting. This is likely due to insufficient CPU allocated to the application i.e. the application is utilizing the allocated CPU at its maximum capacity. The situation is also called CPU throttling. Let’s look for a quick solution:
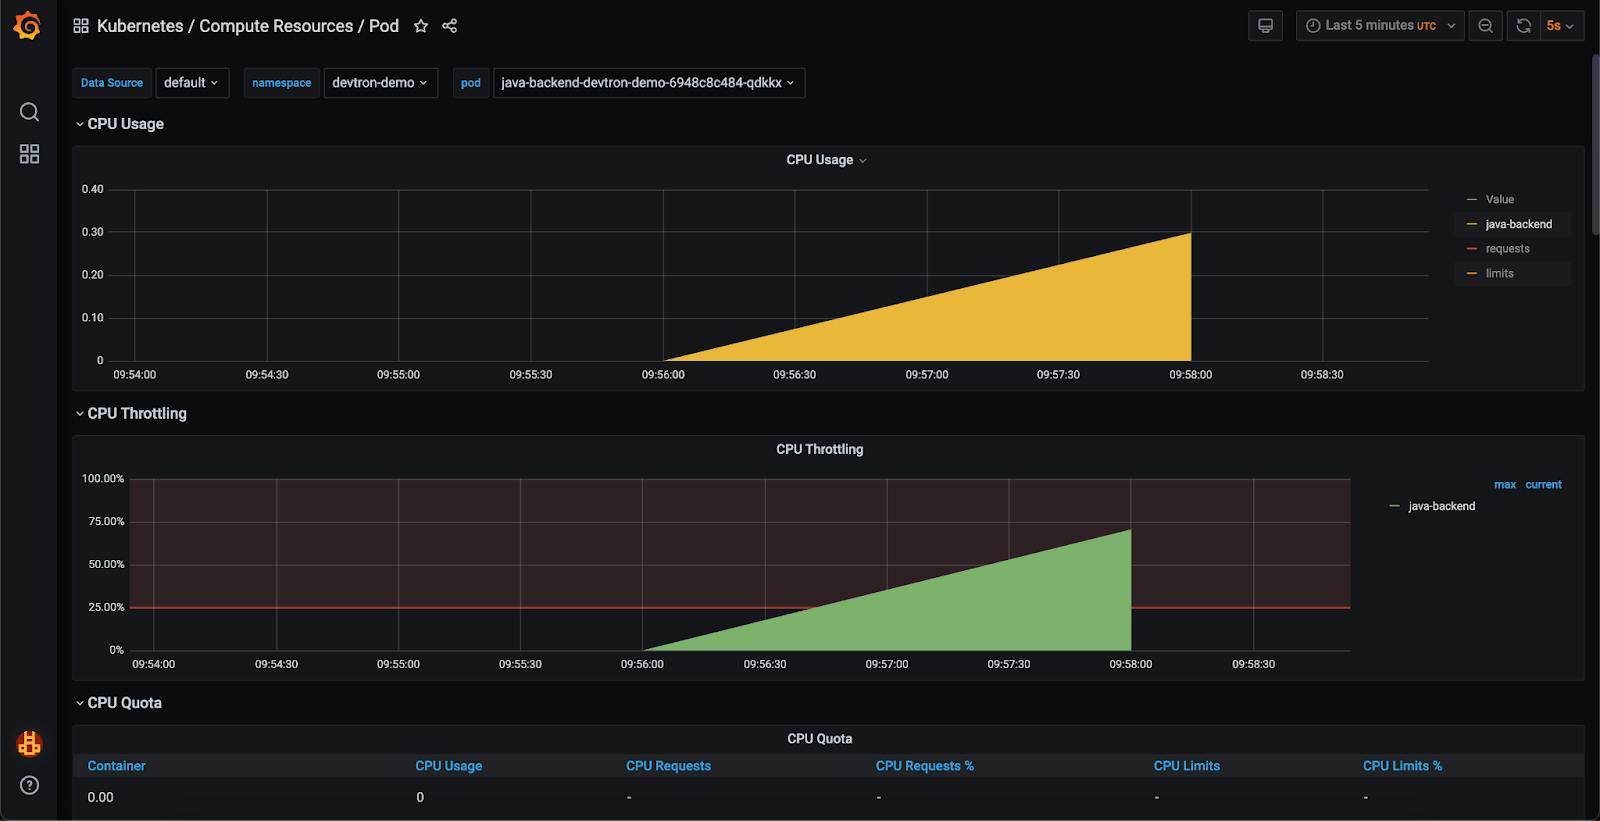
Step 1: Identifying CPU Throttling
- To keep track of our application's resource utilization, we have implemented a monitoring stack which can be seen in the below image. Using the Grafana dashboard, we observed that the application is operating at maximum CPU capacity resulting in CPU throttling.
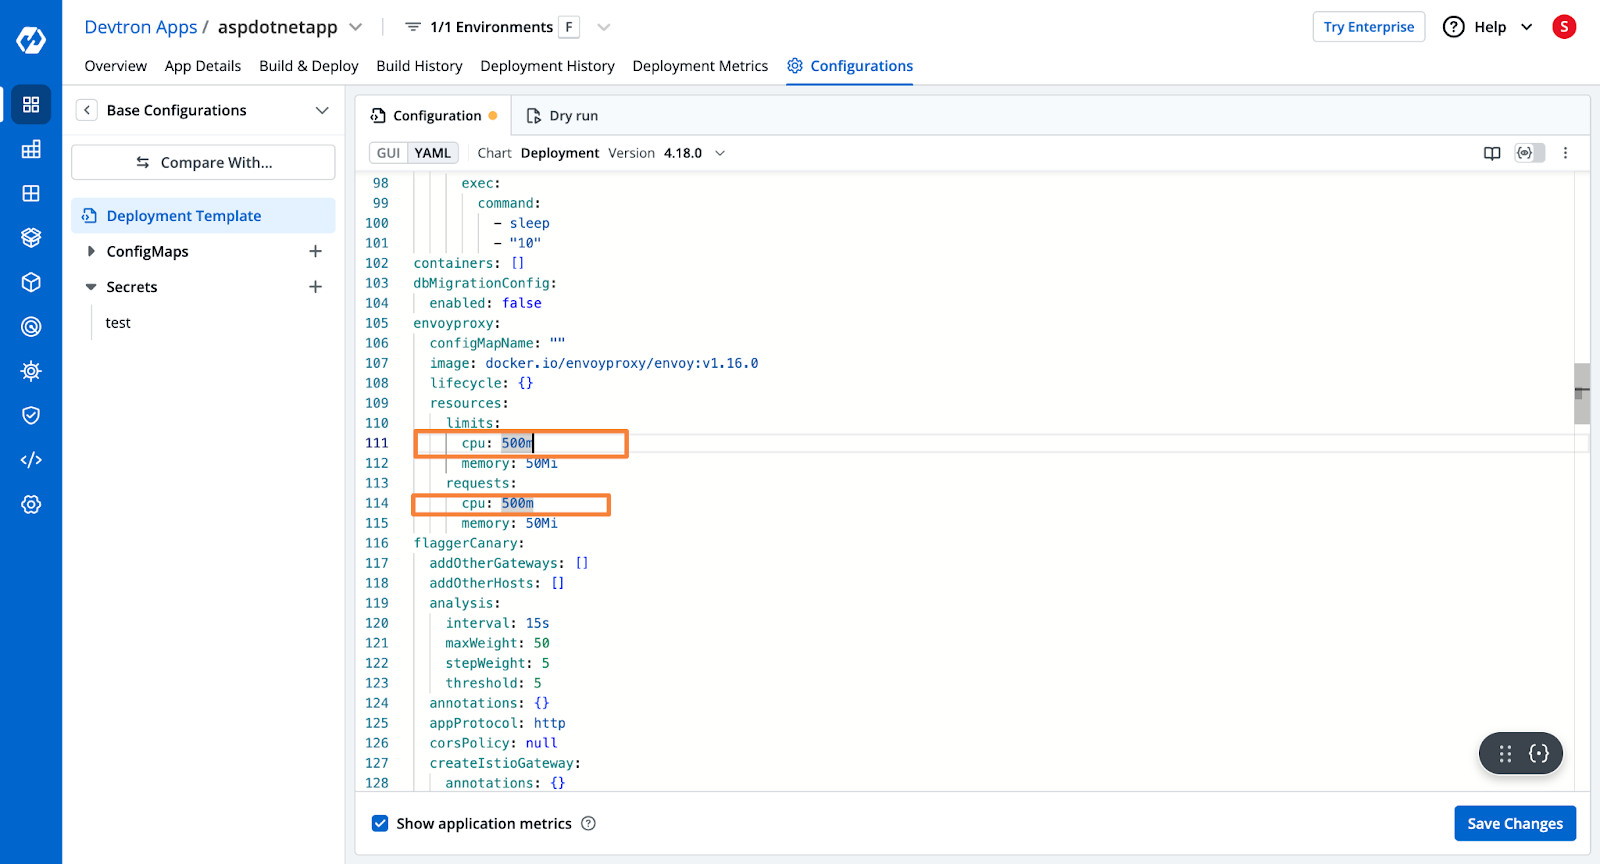
Step 2: Increasing CPU Allocation
- To troubleshoot this issue, we will increase the CPU allocation for the application. We will follow a similar procedure to what we followed in Step 3 of the previous section, where we adjusted the memory allocation. We will modify the CPU allocation in the application's deployment template. The revised deployment template, with the increased CPU allocation, will appear as follows:
Step 3: Verifying the Solution
- Let’s redeploy the application and take a look at performance metrics on the Grafana dashboard.
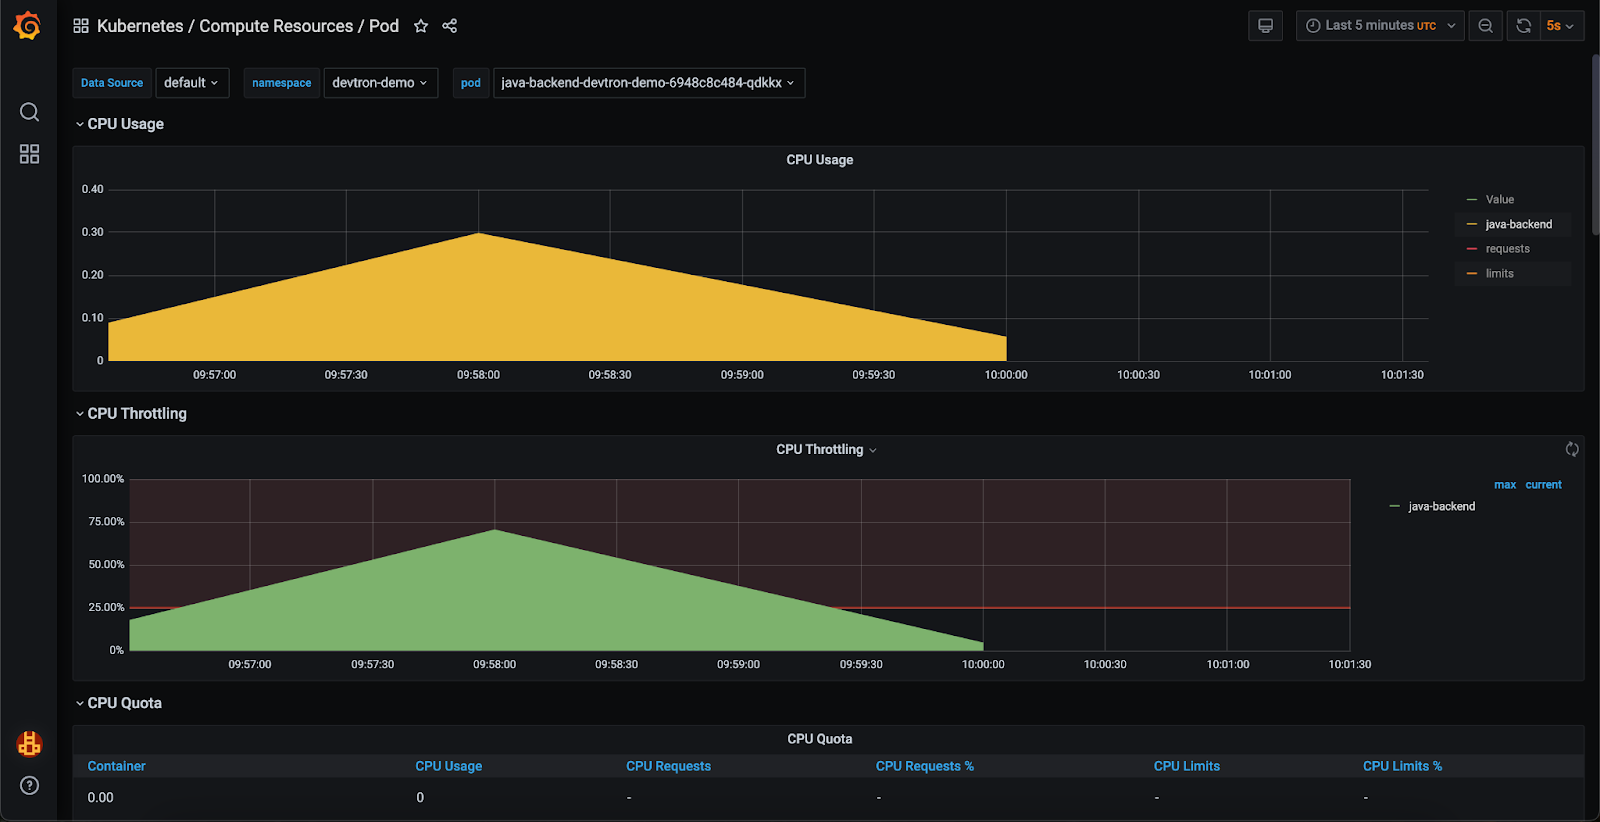
- Upon review, we can confirm that the application's CPU utilization has normalized, and throttling is no longer occurring.
ENV Variables/Secrets Mount Issue
Misconfigured environment variables and improperly mounted secrets can lead to significant problems in Kubernetes environments. These issues can result in application failures, security vulnerabilities, or unexpected behavior that can be challenging to diagnose. Let’s see how devtron can help us diagnose and fix these issues.
- When deploying applications on Kubernetes, we deal with multiple environment variables and secrets. In our case, we encountered a pod error, which caused a 502 Bad Gateway.
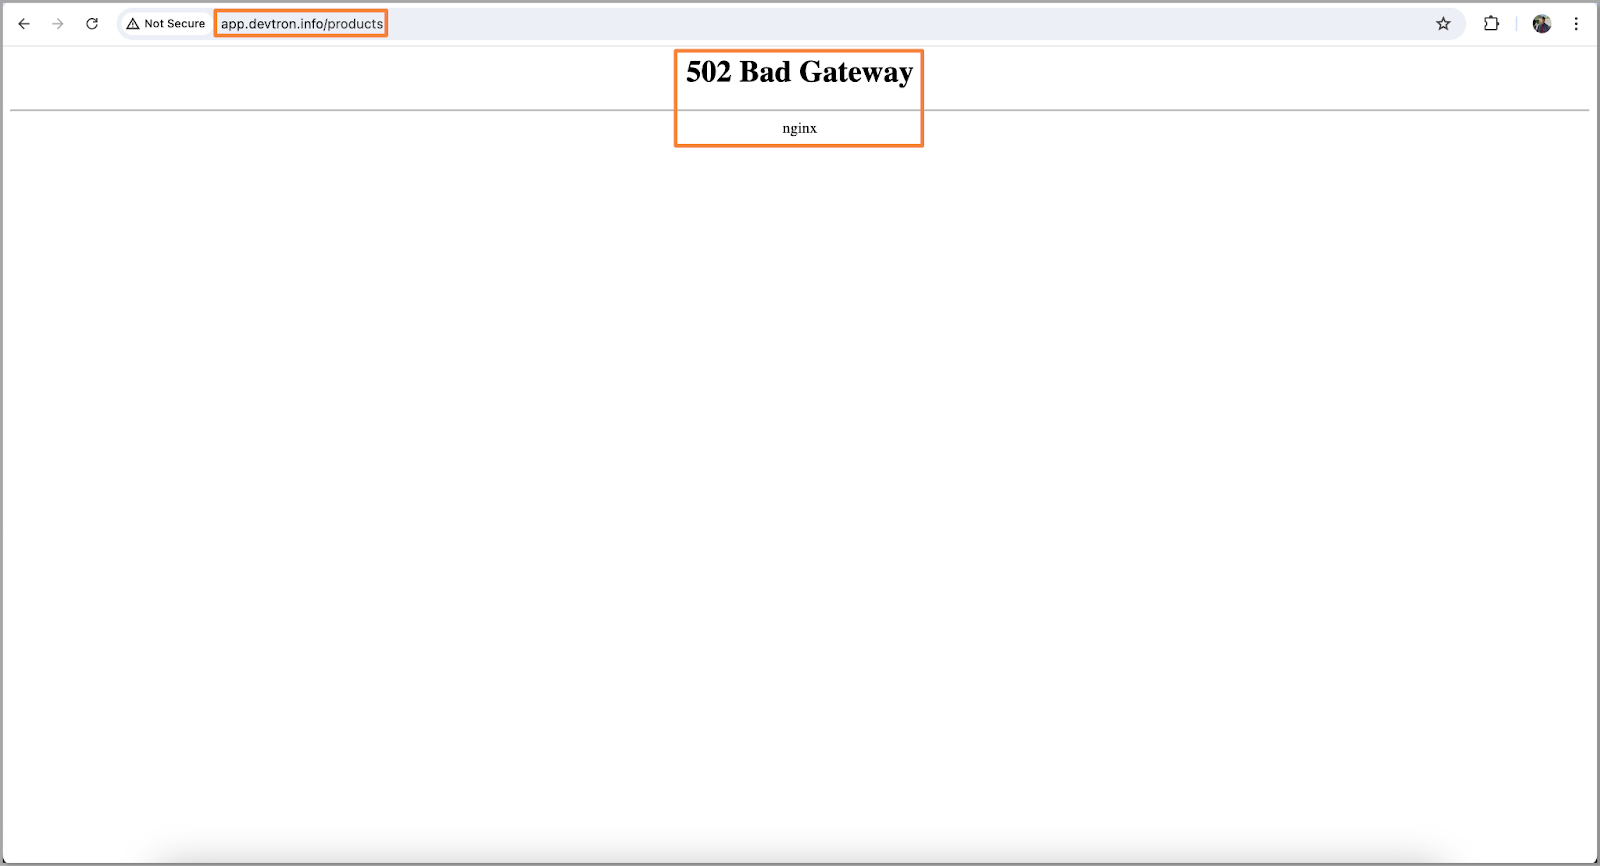
- To investigate, our initial troubleshooting step will be to examine the pod's manifest.
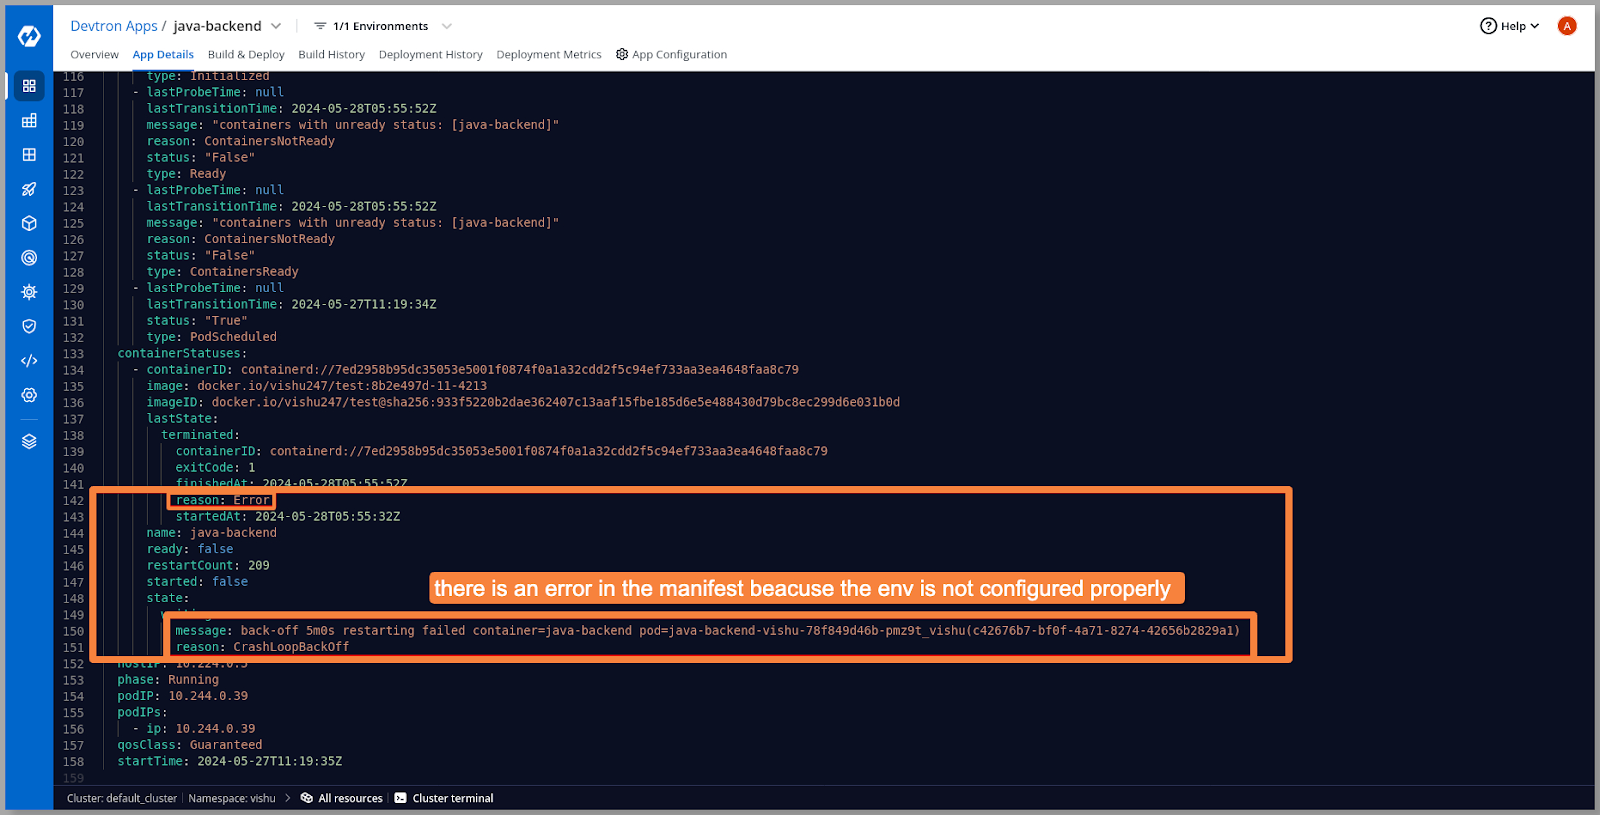
- Analyzing the pod manifest revealed incorrect environment variables and secrets that triggered the error. Let’s take a look at our configurations and secrets and cross-verify them.
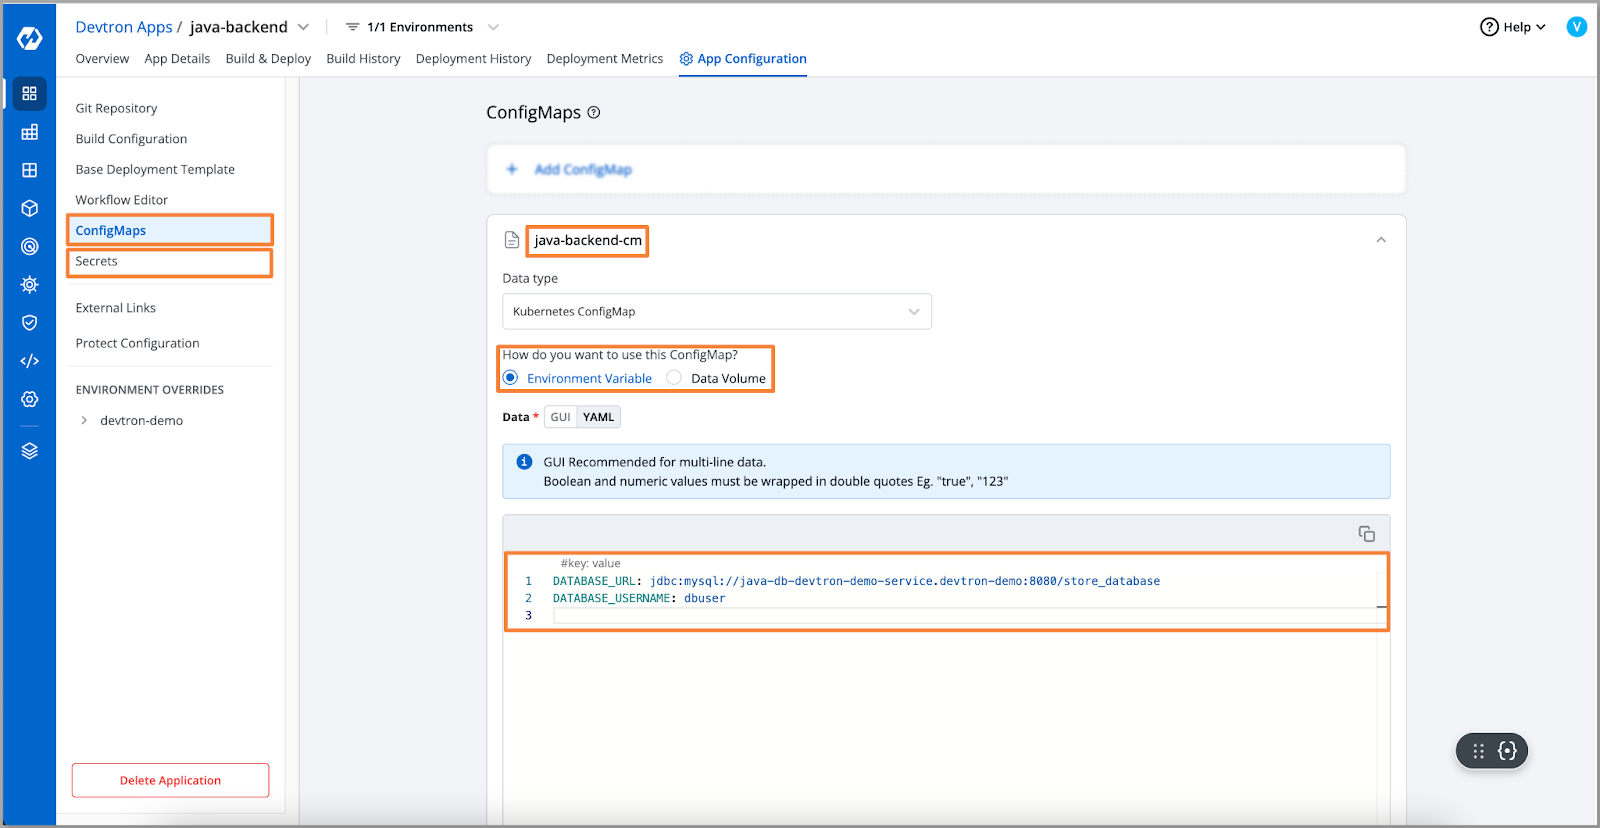
- On cross-verification, we discovered a misconfiguration in the database URL. Let’s replace the correct URL.
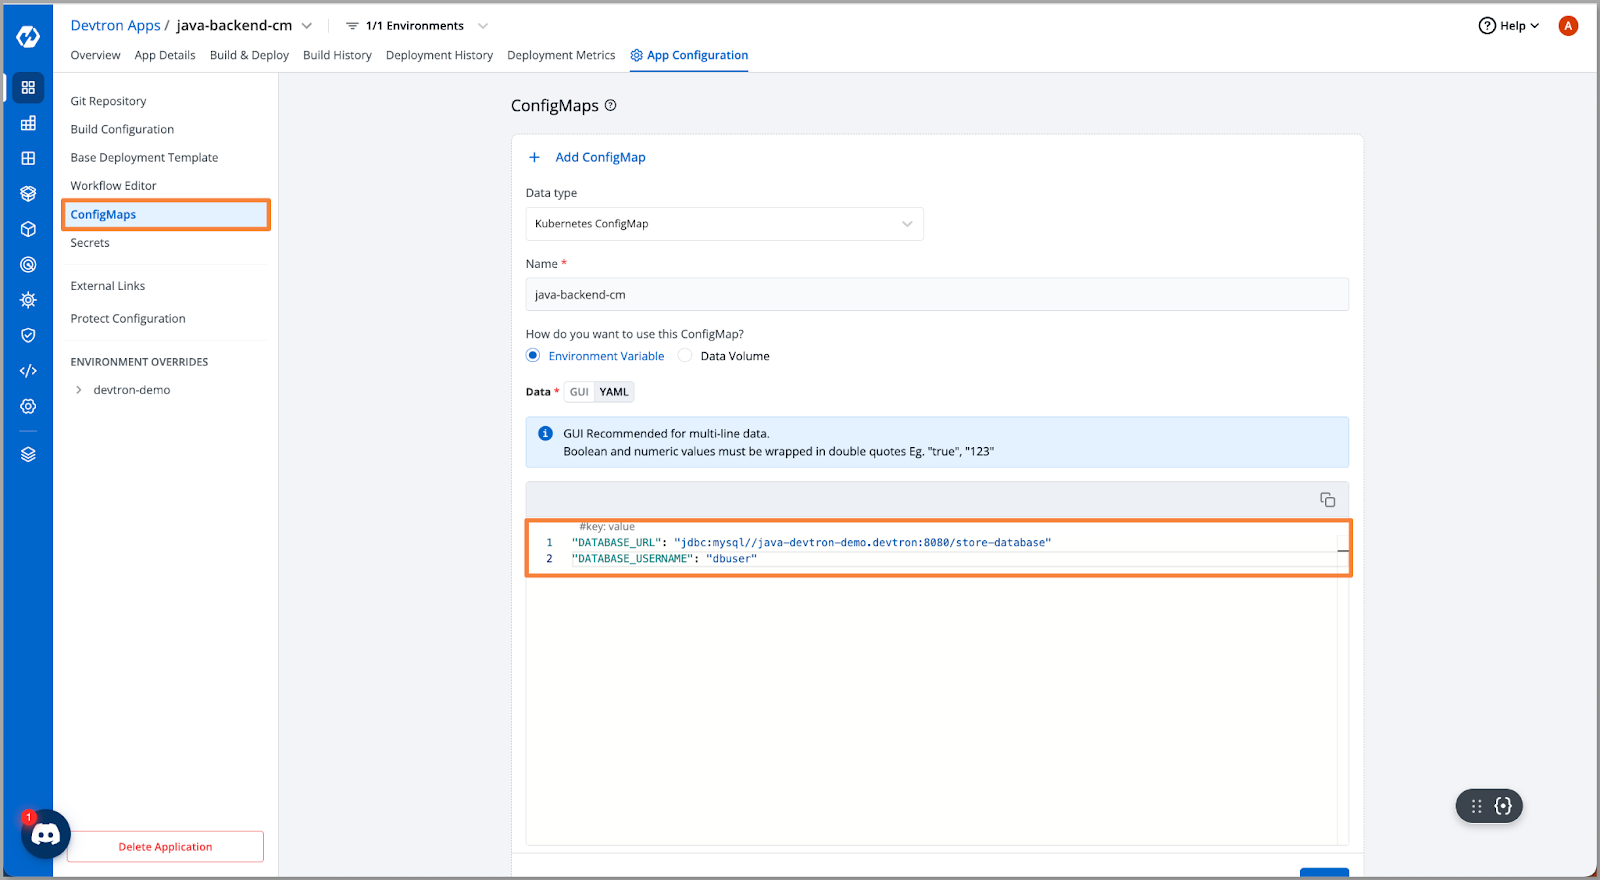
- After updating the values in the ConfigMap, we redeployed the application to verify the fix.
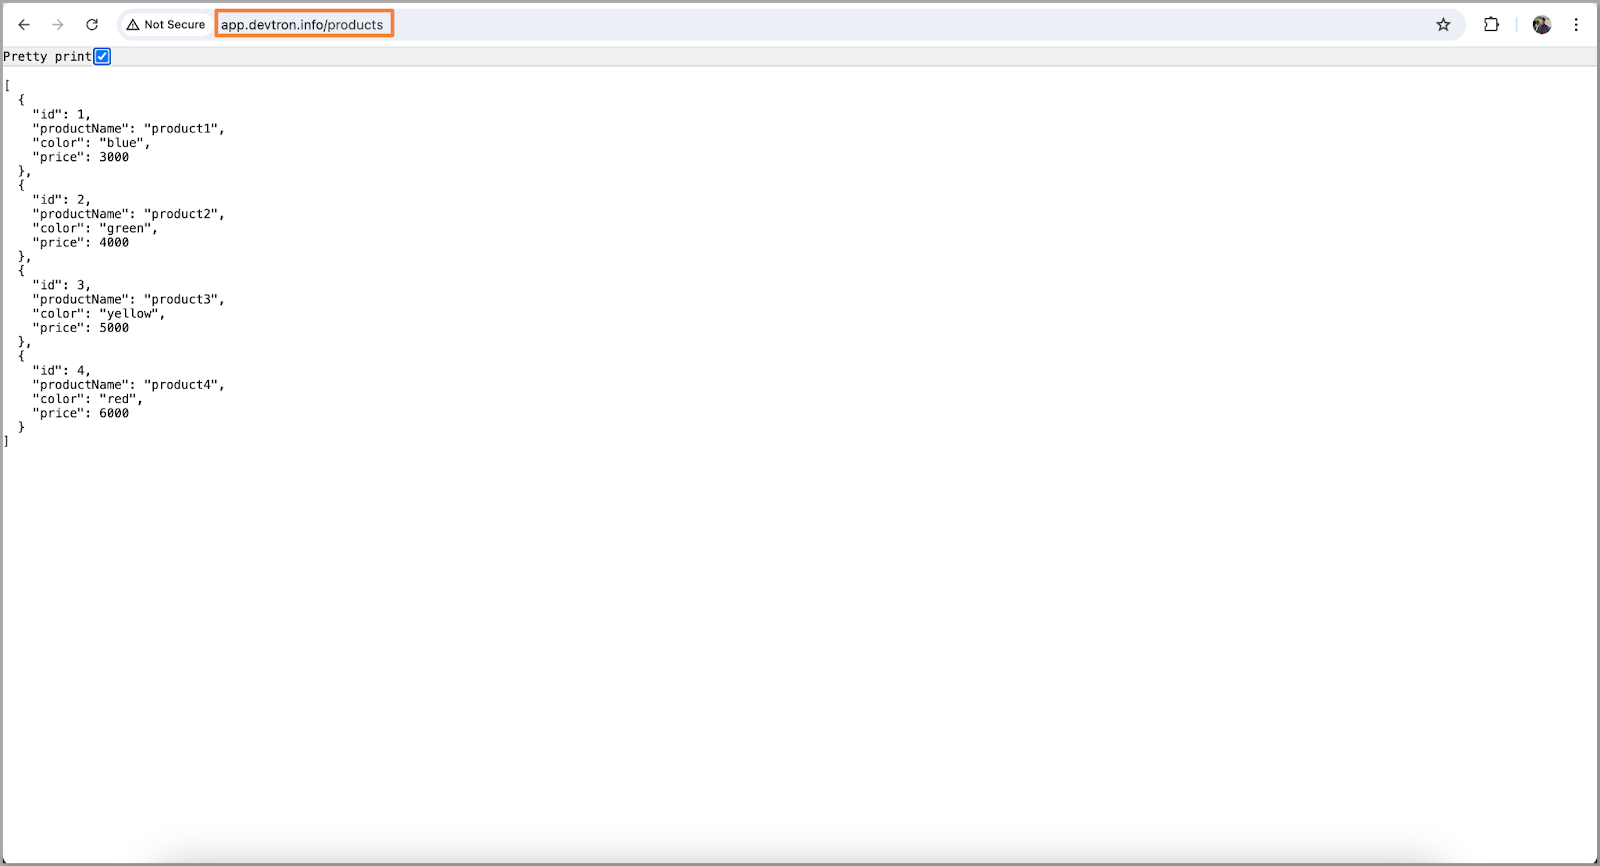
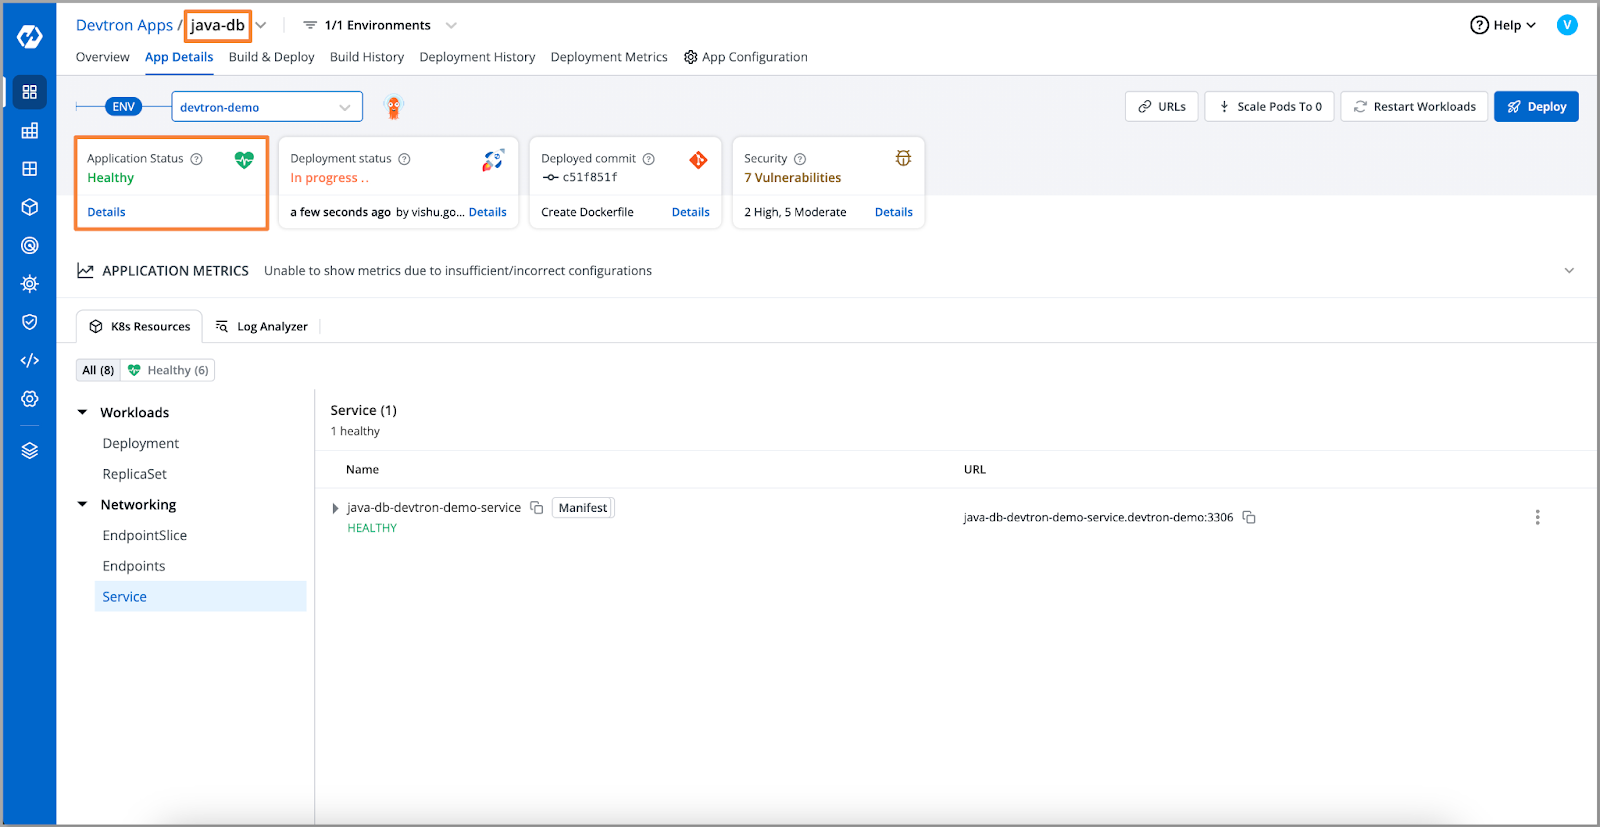
- Now that the application is up and running, Let’s check if we can access our data or not.
DB Connectivity issue.
A "DB connectivity issue" refers to a problem with establishing or maintaining a connection to the database. This issue can occur due to various reasons such as incorrect database credentials, network issues, database server downtime, or misconfiguration of database settings.
Let’s see how we can troubleshoot the DB connection issue in Devtron for our application:
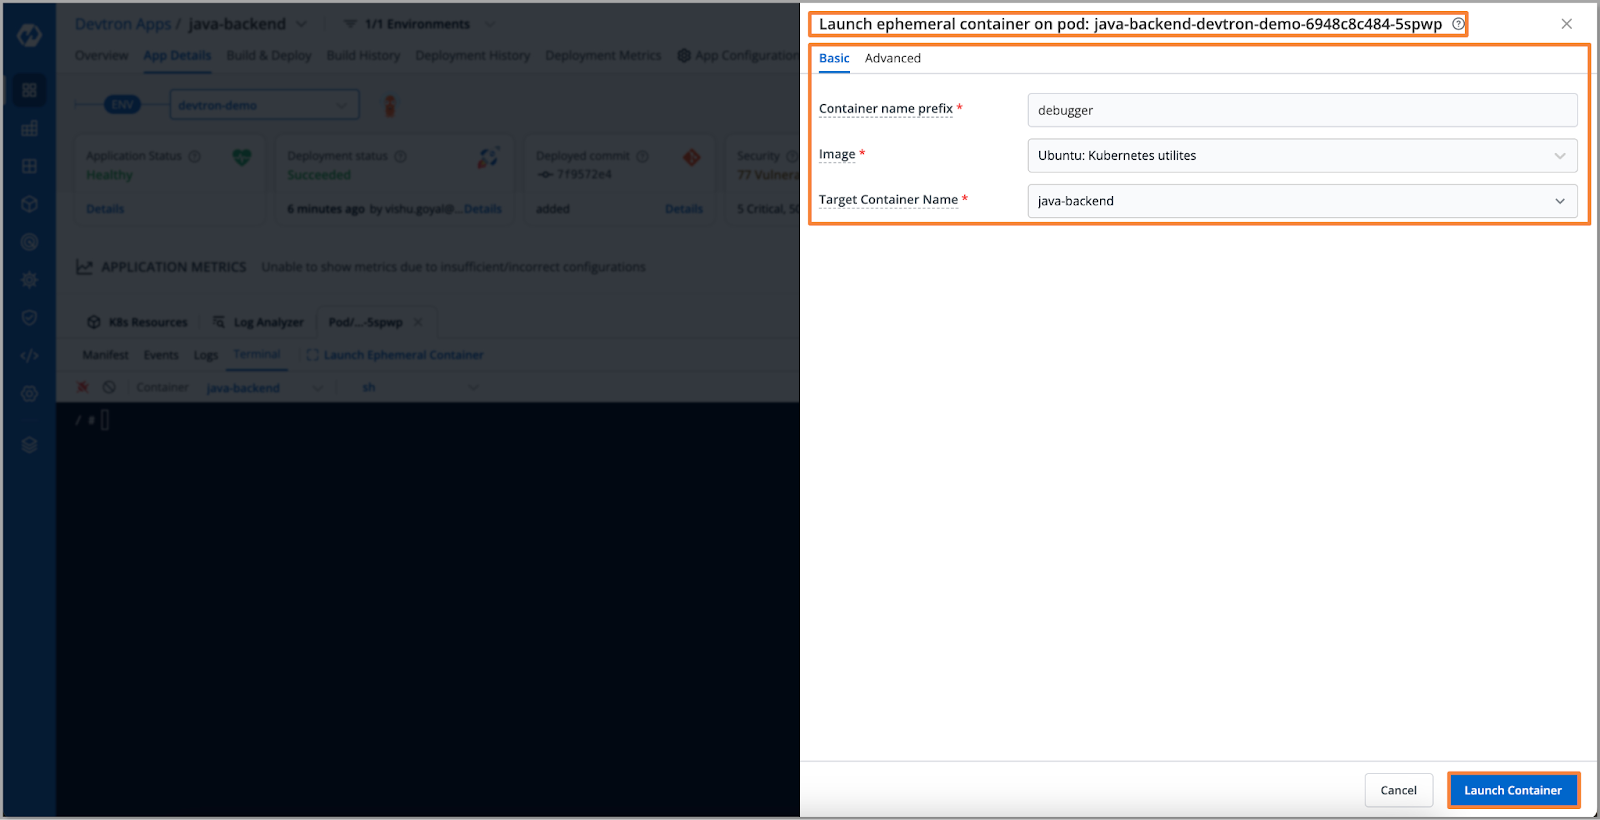
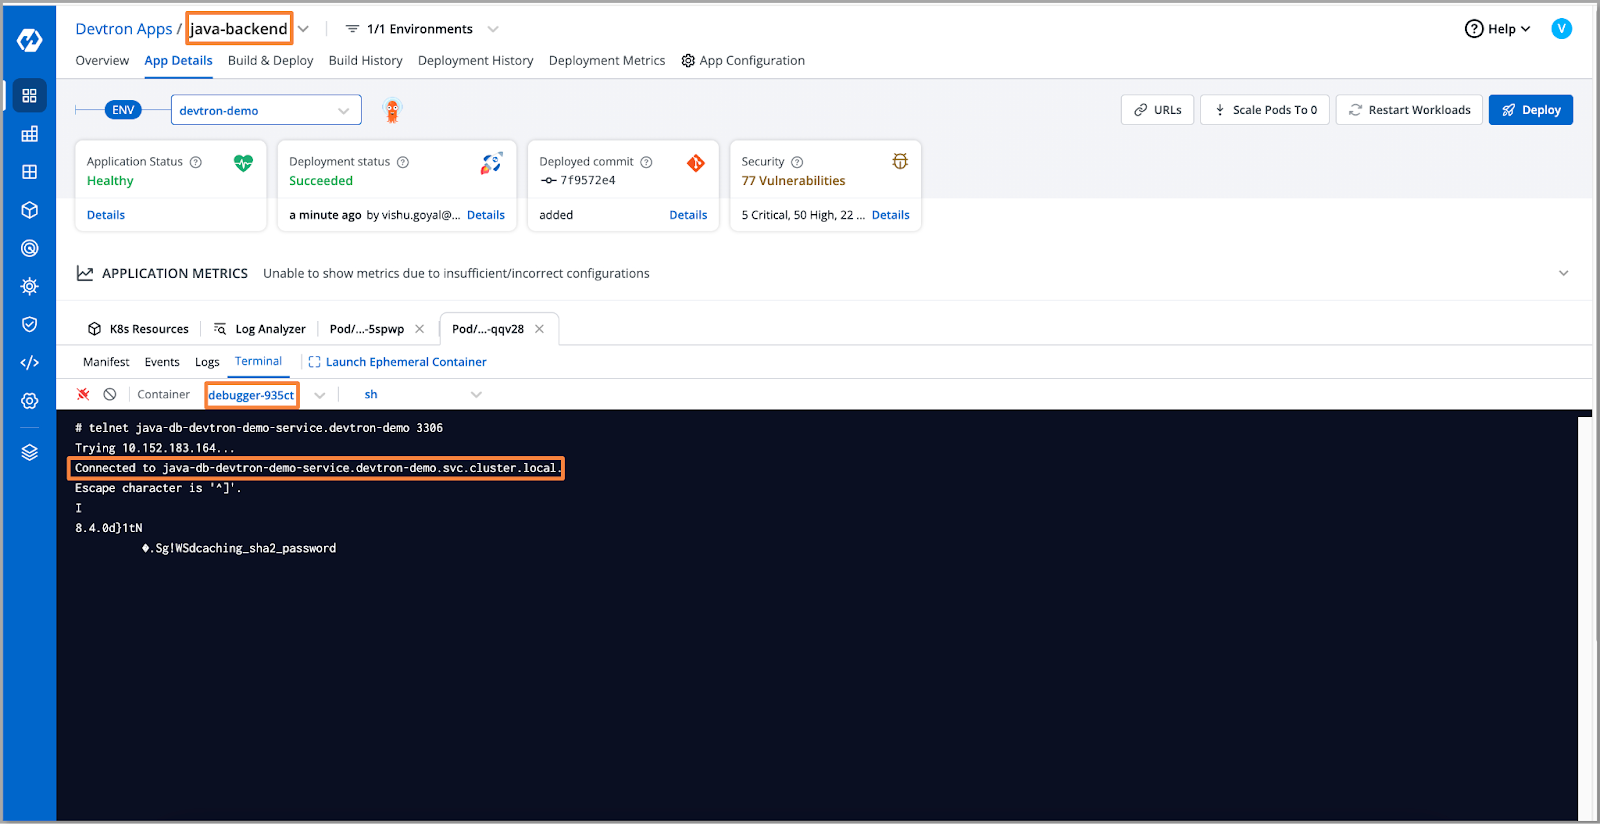
- To investigate the database connection issue, we'll deploy an ephemeral container via Devtron on our application pod. Once launched, we'll use the telnet command to test the database connection.
- To launch the ephemeral container navigate to Pod > Terminal > Launch Ephemeral Container
- Upon executing the telnet command, we receive a "connection refused" error, indicating an inability to connect to the remote host (our database).

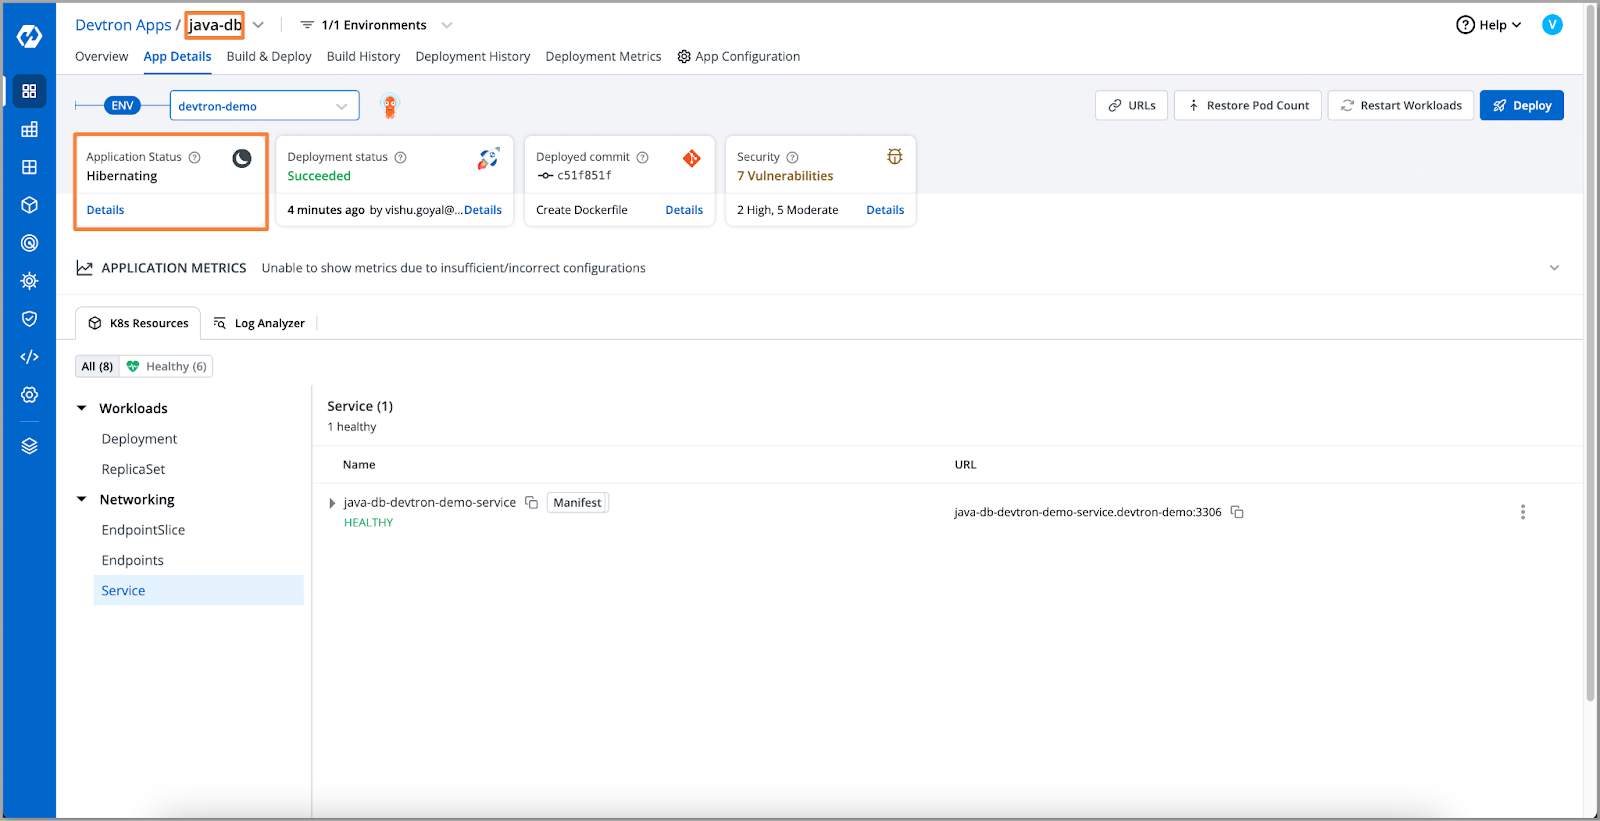
- Let's take a look at our database, here we can see that the database for our application is in a hibernation state. So, the reason for the connection being refused is the hibernation of the database.
- To resolve the issue we'll scale up the database pod. And we'll retest the connection using the telnet command on our ephemeral container.
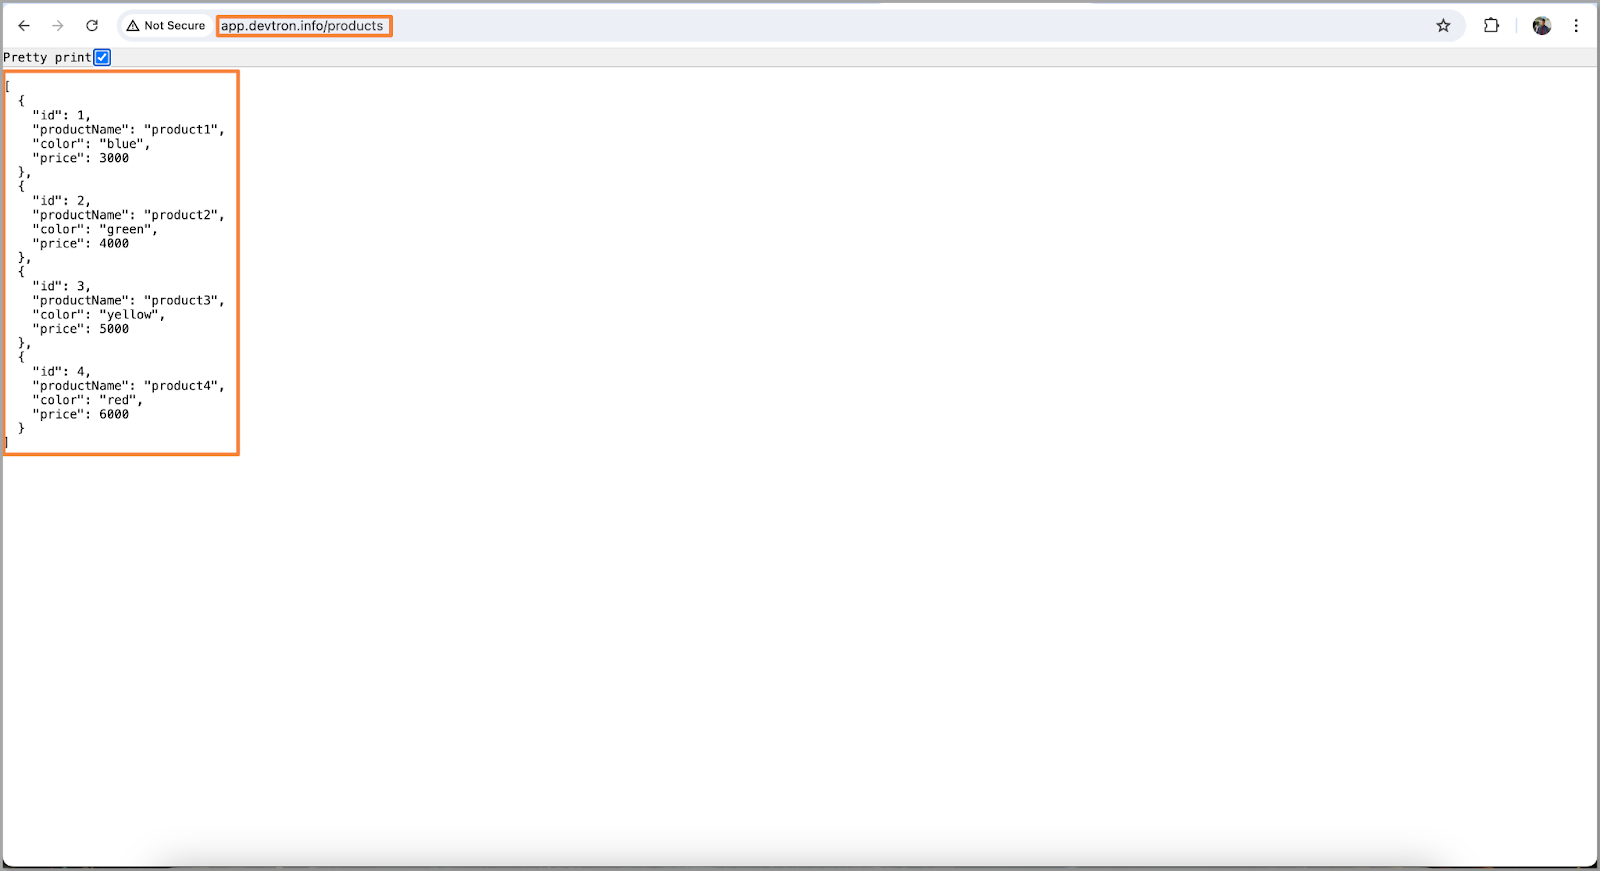
- After retesting the database connection, we can see that it has been successfully connected.
- The database connectivity issue has also been resolved and our application is also up and running. We should be able to fetch the data.
Conclusion
Debugging Kubernetes has always been a complex task, involving multiple context switches and navigation through intricate commands. Devtron simplifies this process, making debugging and managing Kubernetes easier through an intuitive dashboard that provides a comprehensive view of your Kubernetes environment. Devtron acts as a central hub for the Kubernetes ecosystem, along with the intuitive dashboard where most things get handled, Devtron provides access to both cluster and pod terminals, where users can perform various operations such as editing live manifests, viewing current manifests, checking events, downloading files, and monitoring logs. With Devtron, troubleshooting Kubernetes becomes more straightforward as the tedious process of struggling with command-line tools is abstracted. To further enhance troubleshooting capabilities, Resource Watcher a feature of Devtron, automatically remediates Kubernetes issues, providing an extra edge. In the upcoming blog on troubleshooting the Kubernetes series, we will look at some more common issues in the Kubernetes world and how they can be handled through Devtron.
FAQ
What causes the CRASHLOOPBACKOFF error in Kubernetes?
CRASHLOOPBACKOFF occurs when a container repeatedly crashes, often due to misconfigurations or insufficient resources.
How to fix an OOMKilled error in Kubernetes?
Fix OOMKilled errors by increasing memory allocation or optimizing the application's memory usage.
What is CPU throttling in Kubernetes and how can to resolve it?
CPU throttling happens when the application exceeds allocated CPU, resolved by increasing CPU resources.
What are the common causes of database connection issues in Kubernetes?
Common causes include incorrect credentials, network misconfigurations, or the database pod being in a hibernation state.