1. Fluent-bit acts as a lightweight log collector for Kubernetes nodes and pods.
2. Fluentd aggregates, enriches, and forwards logs to destinations like Elasticsearch and AWS S3.
3. Using Helm charts, you can quickly deploy Fluent-bit + Fluentd for scalable log pipelines.
4. Retaining logs in Elasticsearch is costly; combine it with S3 storage for cost optimization.
5. Devtron makes Helm-based log pipeline deployments simpler, and its upcoming agentic AI feature will further automate observability workflows.
Introduction: Why K8s Log Fluentd is Critical
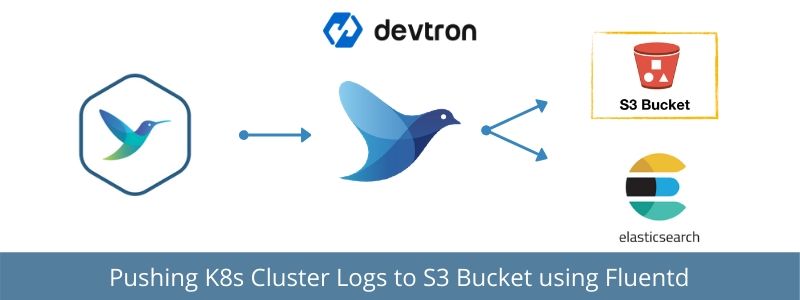
When running workloads on Kubernetes (K8s), logs are the first line of defense for debugging, monitoring, and auditing. However, storing all logs in Elasticsearch can quickly become costly and slow for long-term retention.
To solve this, we built a hybrid log pipeline:
- Short-term storage and searchability with Elasticsearch (1-month retention).
- Long-term archiving with AWS S3 (6 months retention).
This setup uses Fluent-bit as the lightweight collector and Fluentd as the aggregator + forwarder, both deployed with Helm.
Fluent-bit vs Fluentd: Roles in K8s Logging
- Fluent-bit: A lightweight, resource-efficient log collector designed for edge and Kubernetes nodes. It tails logs and forwards them.
- Fluentd: A powerful aggregator that enriches logs and forwards them to multiple destinations like S3, Elasticsearch, Splunk, or Hadoop.
In a typical K8s log fluentd setup:
- Fluent-bit collects logs from pods.
- Fluentd aggregates and ships them to storage backends.
Installing Fluent-bit Helm Chart for K8s Logs
You can use the official Helm chart for Fluent-bit to forward Kubernetes logs either directly to Elasticsearch or via Fluentd.
Edit the fluent-bit-fd-values-2.8.11.yaml below to make the changes mentioned below.
Option 1 – Forwarding Logs to Fluentd (recommended for S3 integration):
- Set
backend.type: forward - Define the in-cluster Fluentd service as the host
Option 2 – Forwarding Logs Directly to Elasticsearch:
- Set
backend.type: es - Provide the in-cluster Elasticsearch client service name or hosted ES endpoint
helm install fluent-bit stable/fluent-bit --version 2.8.11 -f fluent-bit-fd-values-2.8.11.yaml
To uninstall:
helm delete fluent-bit --purge
Installing Fluentd Helm Chart for Aggregation & Forwarding
Once Fluent-bit is collecting logs, deploy Fluentd to aggregate and forward logs to Elasticsearch (short-term) and AWS S3 (long-term storage).
Steps:
- Edit
fluentd-es-s3-values.yamlwith your:- Elasticsearch configs
- S3 configs (bucket name, region, object key format)
- Required plugins (
fluent-plugin-s3,fluent-plugin-rewrite-tag-filter)
- Install using Helm:
helm install fluentd-es-s3 stable/fluentd --version 2.3.2 -f fluentd-es-s3-values.yaml
To uninstall:
helm delete fluentd-es-s3 --purge
3. fluent-bit-fd-values-2.8.11.yaml
 Minikube stores its logs in a separate directory.
# Enable if you install the chart in minikube.
on_minikube: false

image:
  fluent_bit:
    repository: fluent/fluent-bit
    tag: 1.3.7
  pullPolicy: Always

testFramework:
  image: "dduportal/bats"
  tag: "0.4.0"

nameOverride: ""
fullnameOverride: ""

# When enabled, exposes json and prometheus metrics on {{ .Release.Name }}-metrics service
metrics:
  enabled: false
  service:
    # labels:
    #   key: value
    annotations: {}
    # In order for Prometheus to consume metrics automatically use the following annotations:
    # prometheus.io/path: "/api/v1/metrics/prometheus"
    # prometheus.io/port: "2020"
    # prometheus.io/scrape: "true"
    port: 2020
    type: ClusterIP
  serviceMonitor:
    enabled: false
    additionalLabels: {}
    # namespace: monitoring
    # interval: 30s
    # scrapeTimeout: 10s

# When enabled, fluent-bit will keep track of tailing offsets across pod restarts.
trackOffsets: false

## PriorityClassName
## Ref: https://kubernetes.io/docs/concepts/configuration/pod-priority-preemption/#priorityclass
priorityClassName: ""

backend:
  type: forward
#You can change type to es and specify es configs to forward logs directly to Elastic Search
  forward:
    host: fluentd
    port: 24284
    tls: "off"
    tls_verify: "on"
    tls_debug: 1
    shared_key:
  es:
    host: elasticsearch
    port: 9200
    # Elastic Index Name
    index: kubernetes_cluster
    type: flb_type
    logstash_prefix: kubernetes_cluster
    replace_dots: "On"
    logstash_format: "On"
    retry_limit: "False"
    time_key: "@timestamp"
    # Optional username credential for Elastic X-Pack access
    http_user:
    # Password for user defined in HTTP_User
    http_passwd:
    # Optional TLS encryption to ElasticSearch instance
    tls: "off"
    tls_verify: "on"
    # TLS certificate for the Elastic (in PEM format). Use if tls=on and tls_verify=on.
    tls_ca: ""
    # TLS debugging levels = 1-4
    tls_debug: 1
  splunk:
    host: 127.0.0.1
    port: 8088
    token: ""
    send_raw: "on"
    tls: "on"
    tls_verify: "off"
    tls_debug: 1
    message_key: "kubernetes"
  stackdriver: {}

  ##
  ## Ref: http://fluentbit.io/documentation/current/output/http.html
  ##
  http:
    host: 127.0.0.1
    port: 80
    uri: "/"
    http_user:
    http_passwd:
    tls: "off"
    tls_verify: "on"
    tls_debug: 1
    ## Specify the data format to be used in the HTTP request body
    ## Can be either 'msgpack' or 'json'
    format: msgpack
    # json_date_format: double or iso8601
    headers: []

parsers:
  enabled: false
  ## List the respective parsers in key: value format per entry
  ## Regex required fields are name and regex. JSON and Logfmt required field
  ## is name.
  regex: []
  logfmt: []
  ##  json parser config can be defined by providing an extraEntries field.
  ##  The following entry:
  ## json:
  ##   - extraEntries: |
  ##       Decode_Field_As  escaped log do_next
  ##       Decode_Field_As  json log
  ##
  ##  translates into
  ##
  ##   Command       |  Decoder  | Field | Optional Action   |
  ##   ==============|===========|=======|===================|
  ##   Decode_Field_As  escaped   log  do_next
  ##   Decode_Field_As  json log
  ##
  json: []

env: []

## Annotations to add to the DaemonSet's Pods
podAnnotations: {}

## By default there different 'files' provides in the config
## (fluent-bit.conf, custom_parsers.conf). This defeats
## changing a configmap (since it uses subPath). If this
## variable is set, the user is assumed to have provided,
## in 'existingConfigMap' the entire config (etc/*) of fluent-bit,
## parsers and system config. In this case, no subPath is
## used
fullConfigMap: false

## ConfigMap override where fullname is {{.Release.Name}}-{{.Values.existingConfigMap}}
## Defining existingConfigMap will cause templates/config.yaml
## to NOT generate a ConfigMap resource
##
existingConfigMap: ""


# NOTE If you want to add extra sections, add them here, inbetween the includes,
# wherever they need to go. Sections order matters.

rawConfig: |-
  @INCLUDE fluent-bit-service.conf
  @INCLUDE fluent-bit-input.conf
  @INCLUDE fluent-bit-filter.conf
  @INCLUDE fluent-bit-output.conf
# WARNING!!!!!!!!!!!!!!!!!!!!!!!!!!!!!!!!!!!!!!!!!!!!!!!!!!!!!!!!!!!!!!!!!!!!!!!!!!!!!
# This is to add extra entries to an existing section, NOT for adding new sections
# Do not submit bugs against indent being wrong. Add your new sections to rawConfig
# instead.
#
extraEntries:
  input: |-
#     # >=1 additional Key/Value entrie(s) for existing Input section
  audit: |-
#     # >=1 additional Key/Value entrie(s) for existing Input section
  filter: |-
#     # >=1 additional Key/Value entrie(s) for existing Filter section
  output: |-
#     # >=1 additional Key/Value entrie(s) for existing Ouput section
# WARNING!!!!!!!!!!!!!!!!!!!!!!!!!!!!!!!!!!!!!!!!!!!!!!!!!!!!!!!!!!!!!!!!!!!!!!!!!!!!!


## Extra ports to add to the daemonset ports section
extraPorts: []

## Extra volumes containing additional files required for fluent-bit to work
## (eg. CA certificates)
## Ref: https://kubernetes.io/docs/concepts/storage/volumes/
##
extraVolumes: []

## Extra volume mounts for the fluent-bit pod.
## Ref: https://kubernetes.io/docs/tasks/configure-pod-container/configure-volume-storage/
##
extraVolumeMounts: []

resources: {}
  # limits:
  #   cpu: 100m
  #   memory: 128Mi
  # requests:
  #   cpu: 10m
  #   memory: 8Mi

# When enabled, pods will bind to the node's network namespace.
hostNetwork: false

# Which DNS policy to use for the pod.
# Consider switching to 'ClusterFirstWithHostNet' when 'hostNetwork' is enabled.
dnsPolicy: ClusterFirst

## Node tolerations for fluent-bit scheduling to nodes with taints
## Ref: https://kubernetes.io/docs/concepts/configuration/assign-pod-node/
##
tolerations: []
# - key: "key"
#  operator: "Equal|Exists"
#  value: "value"
#  effect: "NoSchedule|PreferNoSchedule|NoExecute(1.6 only)"

## Node labels for fluent-bit pod assignment
## Ref: https://kubernetes.io/docs/user-guide/node-selection/
##
nodeSelector: {}
affinity: {}

service:
  flush: 1
  logLevel: info

input:
  tail:
    memBufLimit: 5MB
    parser: docker
    path: /var/log/containers/*.log
    ignore_older: ""
  systemd:
    enabled: false
    filters:
      systemdUnit:
        - docker.service
        - kubelet.service
        - node-problem-detector.service
    maxEntries: 1000
    readFromTail: true
    stripUnderscores: false
    tag: host.*

audit:
  enable: false
  input:
    memBufLimit: 35MB
    parser: docker
    tag: audit.*
    path: /var/log/kube-apiserver-audit.log
    bufferChunkSize: 2MB
    bufferMaxSize: 10MB
    skipLongLines: On
    key: kubernetes-audit

filter:
  kubeURL: https://kubernetes.default.svc:443
  kubeCAFile: /var/run/secrets/kubernetes.io/serviceaccount/ca.crt
  kubeTokenFile: /var/run/secrets/kubernetes.io/serviceaccount/token
  kubeTag: kube
  kubeTagPrefix: kube.var.log.containers.

# If true, check to see if the log field content is a JSON string map, if so,
# it append the map fields as part of the log structure.
  mergeJSONLog: true

# If set, all unpacked keys from mergeJSONLog (Merge_Log) will be packed under
# the key name specified on mergeLogKey (Merge_Log_Key)
  mergeLogKey: ""

# If true, enable the use of monitoring for a pod annotation of
# fluentbit.io/parser: parser_name. parser_name must be the name
# of a parser contained within parsers.conf
  enableParser: true

# If true, enable the use of monitoring for a pod annotation of
# fluentbit.io/exclude: true. If present, discard logs from that pod.
  enableExclude: true

# If true, the filter reads logs coming in Journald format.
  useJournal: false

rbac:
  # Specifies whether RBAC resources should be created
  create: true
  # Specifies whether a PodSecurityPolicy should be created
  pspEnabled: false

taildb:
  directory: /var/lib/fluent-bit

serviceAccount:
  # Specifies whether a ServiceAccount should be created
  create: true
  # Annotations to add to the service account
  annotations: {}
  # The name of the ServiceAccount to use.
  # If not set and create is true, a name is generated using the fullname template
  name:

## Specifies security settings for a container
## Ref: https://kubernetes.io/docs/tasks/configure-pod-container/security-context/#set-the-security-context-for-a-container
securityContext: {}
  # securityContext:
  #   privileged: true

## Specifies security settings for a pod
## Ref: https://kubernetes.io/docs/tasks/configure-pod-container/security-context/#set-the-security-context-for-a-pod
podSecurityContext: {}
  # podSecurityContext:
  #   runAsUser: 1000
Now that we have configured fluent-bit to collect logs from various pods/deployments in our Kubernetes cluster, we now need an aggregator that aggregates all the logs and writes/pushes them to the required place (files, RDBMS, NoSQL, IaaS, SaaS, Hadoop, elastic search, AWS S3).
Installing Fluentd Helm Chart for forwarding Logs to Elastic Search as well as S3
Let’s look at the stable/fluentd helm chart configurations, we will configure fluentd to send logs collected from fluentbit (or other data sources) to Elastic Search (for shorter retention) as well as to AWS S3 bucket (for longer retention/archive).
Edit the following blocks in the sample fluentd-es-s3-values-2.3.2.yaml file provided below.
Elastic Search Configurations Block
Set the Elastic search configurations in the Elastic Search configuration block. You can set the in-cluster Elastic Search client service name or a hosted Elastic Search endpoint as host. (when using in-cluster service, do append the namespace of the elastic search client service separated by a dot, for example – a service elasticsearch-client in a namespace logging will be written as elasticsearch-client.logging in the host)
output:
  host: <elasticsearch-client>.<namespace>
  port: 9200
  scheme: http
  sslVersion: TLSv1
  buffer_chunk_limit: 2M
  buffer_queue_limit: 8
Fluentd Plugins Block
Enable the fluentd plugins and import fluent-plugin-s3 and fluent-plugin-rewrite-tag-filter
plugins:
  enabled: true
  pluginsList:
    - fluent-plugin-s3
    - fluent-plugin-rewrite-tag-filter
S3 Bucket Configurations Block
Set the S3 configurations in the S3 configurations block. Set the s3_bucket, s3_region, path.
    <match **>
       @type s3
       s3_bucket <k8s-logs-bucket>
       s3_region <ap-southeast-1>
       s3_object_key_format "${tag}/%{time_slice}-events_%{index}.%{file_extension}"
       time_slice_format %Y/%m/%d/%H
       time_slice_wait 10m
       path cluster1-logs
       # if you want to use ${tag} or %Y/%m/%d/ like syntax in path / s3_object_key_format,
       # need to specify tag for ${tag} and time for %Y/%m/%d in <buffer> argument.
       <buffer tag,time>
         @type file
         flush_mode interval
         flush_interval 30s
         path /var/log/fluent/s3
         timekey 300 # 1 hour partition
         timekey_wait 1m
         timekey_use_utc true # use utc
         chunk_limit_size 100m
       </buffer>
       <format>
         @type json
       </format>
    </match>
Installing Fluentd using Helm
Once you’ve made the changes mentioned above, use the helm install command mentioned below to install the fluentd in your cluster.
helm install fluentd-es-s3 stable/fluentd --version 2.3.2 -f fluentd-es-s3-values.yaml
Uninstalling Fluentd
helm delete fluentd-es-s3 --purge
fluentd-es-s3-values-2.3.2.yaml
 Default values for fluentd.
# This is a YAML-formatted file.
# Declare variables to be passed into your templates.
replicaCount: 3
image:
  repository: gcr.io/google-containers/fluentd-elasticsearch
  tag: v2.4.0
  pullPolicy: IfNotPresent
  # pullSecrets:
  #   - secret1
  #   - secret2

output:
  host: <elasticsearch-client>.<namespace>
  port: 9200
  scheme: http
  sslVersion: TLSv1
  buffer_chunk_limit: 2M
  buffer_queue_limit: 8

env: {}

# Extra Environment Values - allows yaml definitions
extraEnvVars:
#  - name: VALUE_FROM_SECRET
#    valueFrom:
#      secretKeyRef:
#        name: secret_name
#        key: secret_key

# extraVolumes:
#   - name: es-certs
#     secret:
#       defaultMode: 420
#       secretName: es-certs
# extraVolumeMounts:
#   - name: es-certs
#     mountPath: /certs
#     readOnly: true

plugins:
  enabled: true
  pluginsList:
    - fluent-plugin-s3
    - fluent-plugin-rewrite-tag-filter

service:
  annotations: {}
  type: ClusterIP
  # loadBalancerIP:
  # type: NodePort
  # nodePort:
  # Used to create Service records
  ports:
    - name: "monitor-agent"
      protocol: TCP
      containerPort: 24220
    - name: "forward"
      protocol: TCP
      containerPort: 24224

metrics:
  enabled: false
  service:
    port: 24231
  serviceMonitor:
    enabled: false
    additionalLabels: {}
    # namespace: monitoring
    # interval: 30s
    # scrapeTimeout: 10s

annotations: {}
#  prometheus.io/scrape: "true"
#  prometheus.io/port: "24231"

ingress:
  enabled: false
  annotations:
    kubernetes.io/ingress.class: nginx
#    kubernetes.io/tls-acme: "true"
#    # Depending on which version of ingress controller you may need to configure properly - https://kubernetes.github.io/ingress-nginx/examples/rewrite/#rewrite-target
#    nginx.ingress.kubernetes.io/rewrite-target: /
  labels: []
  # If doing TCP or UDP ingress rule don't forget to update your Ingress Controller to accept TCP connections - https://kubernetes.github.io/ingress-nginx/user-guide/exposing-tcp-udp-services/
  hosts:
#     - name: "http-input.local"
#       protocol: TCP
#       servicePort: 9880
#       path: /
  tls: {}
  # Secrets must be manually created in the namespace.
#    - secretName: http-input-tls
#      hosts:
#        - http-input.local

configMaps:
  general.conf: |
    # Prevent fluentd from handling records containing its own logs. Otherwise
    # it can lead to an infinite loop, when error in sending one message generates
    # another message which also fails to be sent and so on.
    <match fluentd.**>
      @type null
    </match>
    # Used for health checking
    <source>
      @type http
      port 9880
      bind 0.0.0.0
    </source>
    # Emits internal metrics to every minute, and also exposes them on port
    # 24220. Useful for determining if an output plugin is retryring/erroring,
    # or determining the buffer queue length.
    <source>
      @type monitor_agent
      bind 0.0.0.0
      port 24220
      tag fluentd.monitor.metrics
    </source>
  system.conf: |-
    <system>
      root_dir /tmp/fluentd-buffers/
    </system>
  forward-input.conf: |
    <source>
      @type forward
      port 24224
      bind 0.0.0.0
    </source>
  output.conf: |
    <filter kube.**>
       @type record_transformer
       enable_ruby
       <record>
         kubernetes_tag ${"%s" % [record["kubernetes"]["labels"]["app"] || record["kubernetes"]["labels"]["k8s-app"] || record["kubernetes"]["labels"]["name"] || "unspecified-app-label"]}
       </record>
    </filter>
    <match kube.**>
       @type rewrite_tag_filter
       <rule>
         key     kubernetes_tag
         pattern ^(.+)$
         tag     $1
       </rule>
    </match>
    <match **>
       @type s3
       s3_bucket <k8s-logs-bucket>
       s3_region <ap-southeast-1>
       s3_object_key_format "${tag}/%{time_slice}-events_%{index}.%{file_extension}"
       time_slice_format %Y/%m/%d/%H
       time_slice_wait 10m
       path test-logs
       # if you want to use ${tag} or %Y/%m/%d/ like syntax in path / s3_object_key_format,
       # need to specify tag for ${tag} and time for %Y/%m/%d in <buffer> argument.
       <buffer tag,time>
         @type file
         flush_mode interval
         flush_interval 30s
         path /var/log/fluent/s3
         timekey 300 # 1 hour partition
         timekey_wait 1m
         timekey_use_utc true # use utc
         chunk_limit_size 100m
       </buffer>
       <format>
         @type json
       </format>
    </match>

resources:
  limits:
    cpu: 500m
    memory: 512Mi
  requests:
    cpu: 500m
    memory: 512Mi
  # We usually recommend not to specify default resources and to leave this as a conscious
  # choice for the user. This also increases chances charts run on environments with little
  # resources, such as Minikube. If you do want to specify resources, uncomment the following
  # lines, adjust them as necessary, and remove the curly braces after 'resources:'.
  # limits:
  #  cpu: 500m
  #  memory: 200Mi
  # requests:
  #  cpu: 500m
  #  memory: 200Mi

rbac:
  # Specifies whether RBAC resources should be created
  create: true

serviceAccount:
  # Specifies whether a ServiceAccount should be created
  create: true
  # The name of the ServiceAccount to use.
  # If not set and create is true, a name is generated using the fullname template
  name:

## Persist data to a persistent volume
persistence:
  enabled: false

  ## If defined, storageClassName: <storageClass>
  ## If set to "-", storageClassName: "", which disables dynamic provisioning
  ## If undefined (the default) or set to null, no storageClassName spec is
  ##   set, choosing the default provisioner.  (gp2 on AWS, standard on
  ##   GKE, AWS & OpenStack)
  ##
  # storageClass: "-"
  # annotations: {}
  accessMode: ReadWriteOnce
  size: 10Gi

nodeSelector: {}

tolerations: []

affinity: {}

# Enable autoscaling using HorizontalPodAutoscaler
autoscaling:
  enabled: false
  minReplicas: 2
  maxReplicas: 5
  metrics:
    - type: Resource
      resource:
        name: cpu
        target:
          type: Utilization
          averageUtilization: 90
    - type: Resource
      resource:
        name: memory
        target:
          type: Utilization
          averageUtilization: 80

# Consider to set higher value when using in conjuction with autoscaling
# Full description about this field: https://kubernetes.io/docs/reference/generated/kubernetes-api/v1.15/#pod-v1-core
terminationGracePeriodSeconds: 30
Cost Optimization with Elasticsearch + S3
- Elasticsearch → short-term searchable logs
- S3 → low-cost long-term archive
- Fluentd buffers logs to avoid data loss during spikes
- This hybrid setup balances cost, compliance, and searchability
Best Practices for K8s Log Fluentd Pipelines
- Use TLS for secure log transfer.
- Configure resource requests/limits in Helm charts to avoid node pressure.
- Monitor Fluentd buffer queue to prevent backpressure.
- Use JSON log format for better queryability in Elasticsearch.
- Keep retention policies well defined (e.g., 30 days ES, 180 days S3).
How Devtron Makes This Easier
Instead of editing long Helm values files manually, Devtron provides:
- Visual dashboards to deploy Fluent-bit and Fluentd.
- Easy connections to S3, Elasticsearch, Splunk.
- Centralized monitoring for your logging pipeline.
Conclusion
Setting up K8s log fluentd pipelines using Helm ensures scalable, reliable, and cost-efficient logging. With Fluent-bit, Fluentd, Elasticsearch, and S3, you can optimize observability without overspending.
By pairing this with Devtron’s platform + AI features, your logging will become smarter, faster, and automated.
FAQ
What Is Fluentd and How Does It Work with Kubernetes for Log Aggregation?
Fluentd is a powerful log aggregator that collects logs from Kubernetes containers, processes them, and forwards them to storage solutions like Elasticsearch or AWS S3. It helps manage large-scale logs efficiently, enabling centralized logging for Kubernetes clusters.
How Can I Forward Kubernetes Cluster Logs to S3 Using Fluentd and Fluent-bit?
To forward Kubernetes logs to AWS S3, you can use Fluent-bit to collect the logs from your pods and forward them to Fluentd. Fluentd then processes and sends the logs to your designated S3 bucket for long-term storage. This reduces costs associated with log storage in Elasticsearch.
How Do I Install Fluentd Using Helm to Forward Logs to Elasticsearch and S3?
To install Fluentd using Helm, first configure the Fluentd Helm chart with necessary parameters for Elasticsearch and S3. Use the command helm install fluentd-es-s3 stable/fluentd --version 2.3.2 -f fluentd-es-s3-values.yaml to deploy Fluentd in your Kubernetes cluster.
What Are the Benefits of Using Preemptible VMs or Spot Instances for Kubernetes Clusters?
Using AWS Spot Instances or GCP Preemptible VMs for Kubernetes clusters provides cost savings of up to 90% for AWS and 80% for GCP. These cost-effective options are ideal for non-critical or time-flexible workloads and can significantly reduce cloud expenses while running your Kubernetes workloads.