

Teams keep adding tools to ship faster, and the stack ends up slowing them down. Platform consolidation offers a way forward. Rather than replacing every tool with a single product, teams can bring essential workflows, operational context and governance into a more connected environment. In 2026, the rise of platform engineering and AI-assisted operations makes this approach increasingly relevant.
The problem: every tool made sense on the day you added it
Nobody sets out to build a complicated DevOps stack. A team adopts a CI tool to automate builds. Security introduces a vulnerability scanner. An infrastructure team adds monitoring. Compliance requirements bring new policy tools, while developers adopt additional dashboards to manage Kubernetes workloads.
Individually, these decisions make sense. Collectively, they can create a fragmented environment in which each tool has its own configuration, access controls, data and maintenance requirements.Each decision is reasonable, and the sum is a patchwork of dashboards, alerts and integrations that nobody fully owns.
The numbers say this is the norm, not the exception:
- In an AI + DevOps report from DuploCloud, 44% of teams named tool sprawl as a top pain point and said they juggle more than 10 DevOps tools. Only 31% said they were consolidating, and the average stack was still growing.
- In GitLab's 2024 survey, more than 78% of DevOps professionals said they spend a quarter or more of their time just keeping the toolchain running.
- Devtron's own documentation says teams often end up juggling 8 to 12 tools for visibility, deployments and governance on Kubernetes alone.
The real cost is not the licence fees or the number of tools. It is the effort required to make them work together.
When deployment information lives in one dashboard, security findings in another and application health in a third, engineers must manually connect the dots. Every additional integration introduces another dependency to configure, monitor and maintain.
The result is a toolchain that may be automated in individual parts but remains difficult to operate as a whole.
Anatomy of the 10-tool stack
A typical Kubernetes delivery environment can involve several tools across development, deployment, security and operations. The following table illustrates common responsibilities and the friction that can emerge between them.
Look at the stack as a whole and a pattern becomes clear , each tool knows its own part of the delivery lifecycle, but very few understand the complete application context. Engineers are left to connect those pieces themselves. They have to work out which deployment caused an alert, whether a security finding affects the release, and where the relevant configuration lives. That's a lot of coordination work for a stack that was supposed to make delivery easier.
The Hidden Cost of Tool Sprawl: Beyond Licences
Tool sprawl is often measured through subscription costs. However, the larger operational burden can come from the work required to maintain and coordinate the stack.
Integration maintenance - Every connection between systems requires configuration, authentication, error handling and ongoing maintenance. Changes to APIs, credentials or tool versions can introduce failures across otherwise functional workflows.
Context switching - Engineers must navigate different interfaces to understand what happened during a deployment or incident. Repeatedly gathering information from disconnected systems adds friction to troubleshooting.
Inconsistent governance - Each tool may have its own access controls, audit capabilities and policy configuration. Maintaining consistent security practices across the stack requires coordination and clear ownership.
Onboarding and knowledge transfer - New engineers must learn not only the tools but also the relationships between them. Critical operational knowledge can become concentrated among the people who built and maintain those integrations.
Delayed decisions - When deployment health, security findings and infrastructure costs are reviewed separately, teams may discover important issues later than they otherwise could.
The business impact is straightforward: engineering capacity is spent maintaining the delivery environment instead of improving it.
Consolidation aims to reduce this overhead by connecting workflows, standardizing common operations and making relevant information easier to access. The goal is not necessarily fewer tools at any cost. It is less effort spent making the toolchain function as a whole.
Why platform consolidation is the next big shift
The appetite for fewer tools has been building for years. GitLab's 2022 survey found 69% of respondents wanted to consolidate their toolchains, citing monitoring problems, delays and a worse developer experience. What has changed is that the alternative to consolidation, building and gluing everything yourself, has stopped being viable.
1. Platform engineering made "one paved road" the default - Gartner forecast that 80% of large software organizations would have platform teams by 2026, up from 45% in 2022. A platform team's job is to give developers one self-service path to production. That is hard to deliver on top of ten unrelated tools.
2. DIY platforms are expensive to keep alive - Commentary around the 2024 DORA report puts internal platform adoption at roughly 90% of organizations, and argues that building everything from scratch no longer makes sense when managed options exist. Teams that build a portal often find that maintaining it eats the capacity they wanted for real platform work.
3. Security wants fewer seams - GitLab's survey makers point out that a consolidated toolchain means fewer vendor risk assessments, threat models and scans to maintain. Every extra tool is another access path and another integration to patch.
4. Cost needs to sit next to deployment - In Kubernetes, every deployment changes resource use and therefore spend. Cost data that lives in a separate tool, reviewed monthly, cannot influence the release that caused it.
5. Kubernetes expertise is scarce - Fewer people have deep Kubernetes skills than there are clusters to run. A single platform lowers the amount of tool-specific knowledge each engineer must carry.
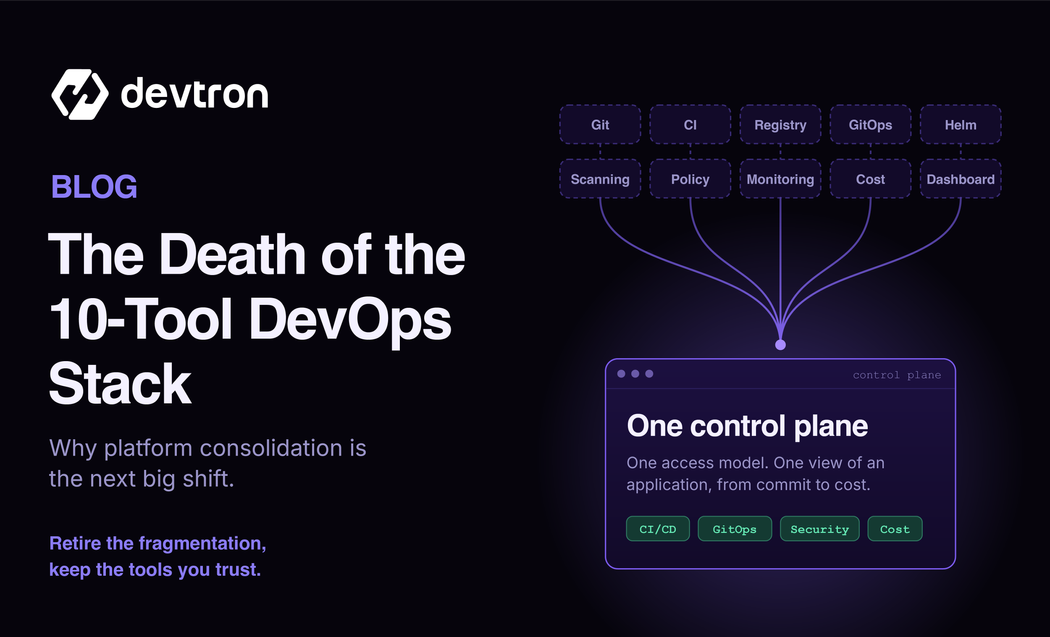
Consolidation does not mean one vendor owning everything or ripping out tools you like. It means one control plane, one access model and one view of an application, from commit to cost, while the best-of-breed engines (Argo CD, Trivy, Grafana and others) keep doing the work underneath.
Where AI fits: agents need one connected context
AI is the newest reason to consolidate. Talks and tools through 2026 keep returning to the same use case: agents that diagnose Kubernetes problems so engineers stop repeating kubectl logs, describe events by hand, using protocols such as MCP to reach cluster data. Platform-engineering writers describe agents becoming platform citizens that platform teams give their own golden paths.
There is a catch. An agent is only as good as the context it can see. Spread across ten tools, an agent needs ten integrations, ten sets of credentials and ten permission reviews, and it still cannot link a failing pod to the pipeline run, the scan result and the cost change behind it. The DuploCloud report makes a similar point: on top of a fragmented toolchain, AI becomes one more noisy assistant.
So the order matters. Consolidate first, and AI gets a single, governed place to read from and act in. Skip that step, and you add an eleventh tool that mostly summarises the mess.
The opportunity is to combine connected operational data with AI-assisted analysis so that engineers spend less time gathering information and more time making informed decisions.
From Tool Sprawl to Faster Incident Resolution
Consider a deployment that completes but leaves an application in an unhealthy state. The monitoring system detects increased latency, and the engineering team needs to understand what changed.
In a fragmented environment, the investigation may involve several steps:
- Open the CI/CD interface and identify the latest pipeline run.
- Check the deployment history to determine which version was released.
- Inspect Kubernetes events and pod status for scheduling or container errors.
- Review application logs to understand the failure.
- Compare resource utilization and monitoring metrics to determine whether the problem is related to capacity or application behaviour.
Each step provides part of the answer. The engineer must correlate the information before deciding what to investigate next.
A connected operational view can reduce the effort involved in gathering that context by bringing application status, deployment history, logs and relevant Kubernetes information closer together. AI-assisted troubleshooting can further help by explaining observed symptoms and suggesting plausible diagnostic steps.
The practical benefit is not a guaranteed reduction in incident time. It is a shorter path to the information needed to investigate the problem.
Teams can evaluate this improvement by measuring:
- Time spent gathering diagnostic information.
- Time from incident detection to a credible diagnosis.
- Time required to recover from deployment-related failures.
- The number of manual steps involved in common investigations
These measurements help determine whether consolidation is improving day-to-day operations rather than merely creating a more convenient interface.
What a consolidated platform looks like: Devtron
Devtron is an open-source, Kubernetes-native platform, licensed under Apache 2.0, built on the idea above to keep the proven engines, and put one control plane over them. Its documentation describes it as a control plane for the application lifecycle, where CI/CD, infrastructure, cost visibility, security and debugging meet in one interface.
Rather than requiring teams to discard every existing tool, Devtron provides a way to connect important application delivery and operations workflows.Here is how that maps to the stack from earlier.
The value of this approach is the connection between operational tasks. Engineers can work with application delivery and Kubernetes troubleshooting in a shared environment instead of relying exclusively on separate interfaces for every step.
For example, when a workload becomes unhealthy, engineers can inspect application status, deployment information and Kubernetes events to narrow down the problem. Devtron Intelligence can assist with interpreting the available workload context and recommending diagnostic steps.
This does not remove the need for specialized tools. Teams may continue to use their preferred source control, observability, security and infrastructure systems. The objective is to make the overall workflow easier to manage.
There is also an important consideration: Devtron is Kubernetes-focused. Organizations should evaluate how its capabilities fit their existing architecture, integrations, governance requirements and operational practices before adopting it.
For teams managing Kubernetes applications across environments, a shared control plane can provide a practical starting point for reducing fragmented delivery and troubleshooting workflows.
How to Consolidate Your DevOps Stack Without Disrupting Delivery
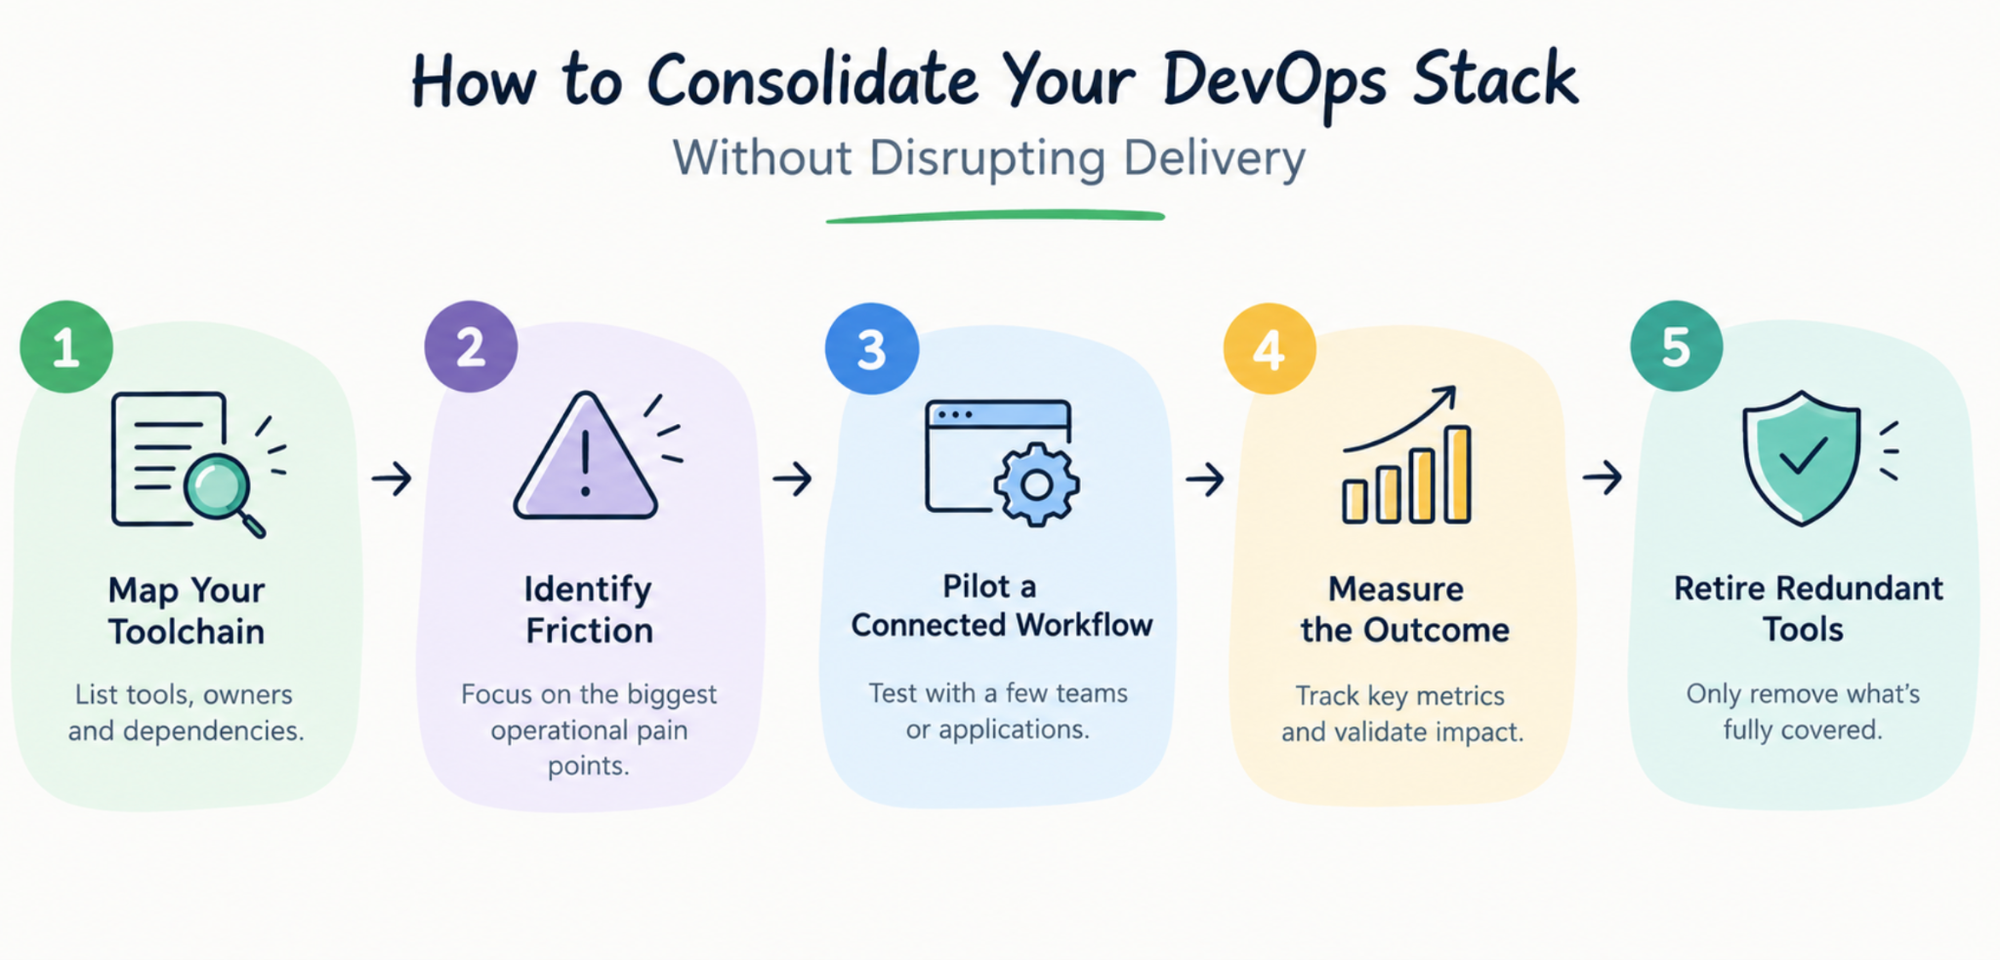
Consolidation should be treated as an incremental engineering initiative, not a wholesale replacement project. Removing tools before understanding their dependencies can introduce new risks and interrupt established workflows.
A phased approach helps teams identify where consolidation offers the most value.
Step 1: Map the existing toolchain
Document the tools used across source control, CI/CD, GitOps, security, monitoring, cost management and cluster operations.
For each tool, identify its primary responsibility, owner, integrations, access requirements and dependent workflows. This creates a clearer picture of where capabilities overlap and where integrations are essential.
Step 2: Identify the biggest sources of friction
Focus on problems that affect everyday engineering work.
These might include repeated manual steps during deployment, security findings that are disconnected from release decisions, duplicated access management or incident investigations that require information from multiple dashboards.
Prioritize problems based on their operational impact rather than the number of tools involved.
Step 3: Pilot a connected workflow
Choose a limited set of applications or teams and test a consolidated workflow.
Validate deployment reliability, access controls, auditability, integration behaviour and rollback procedures. Confirm that existing processes continue to work and that the new workflow provides measurable benefits.
Step 4: Measure the outcome
Establish a baseline before the pilot and compare it with the results afterward.
Useful indicators include deployment lead time, time to diagnose incidents, integration maintenance effort, onboarding time and the number of manual steps in common workflows.
A lower tool count alone is not sufficient evidence of success. Consolidation should make delivery and operations more reliable and less labor-intensive.
Step 5: Retire tools only when their responsibilities are covered
Once the new workflow is stable, identify tools or integrations that are genuinely redundant. Confirm that their required capabilities, data, access controls and operational responsibilities have been accounted for before retiring them.
This approach allows organizations to reduce complexity without sacrificing the specialized capabilities they still need.
Retire the fragmentation, keep the tools you trust
The ten-tool DevOps stack did not appear overnight. It developed as teams solved individual problems with the tools available to them. Those decisions often improved local workflows, but they also created new integration and maintenance responsibilities.
The next step is not to replace every tool with a single product. It is to make the software delivery lifecycle easier to operate by connecting workflows, improving access to operational context and reducing unnecessary manual work.
Platform engineering provides a way to standardize common tasks. AI-assisted troubleshooting can help engineers interpret operational information. A connected control plane can bring these capabilities closer together, while specialized tools continue to perform the jobs they do well.
Start by auditing your own toolchain. Identify the workflows that require the most context switching, the integrations that consume the most maintenance effort and the operational information that is hardest to access during an incident.
Then pilot a more connected approach and measure the results.
For teams running Kubernetes, Devtron offers an open-source platform to explore this approach across application delivery, security, operations and AI-assisted troubleshooting.
Explore the Devtron documentation or the Devtron GitHub repository to understand the available capabilities and evaluate how they fit your environment.
The goal is simple: spend less time maintaining the toolchain and more time delivering reliable software.