Kubernetes Resource Browser is a new BETA feature added to the Kubernetes Dashboard that provides a graphical user interface for interacting and managing all your Kubernetes (k8s) resources in a Kubernetes cluster. It allows users to view and edit the configuration of pods, services, and other Kubernetes resources. In addition, it also helps you perform tasks such as scaling, editing the manifest of resources, creating new Kubernetes resources from the dashboard, and much more. The resource browser is enabled with a finer and granular role based access control that is managed centrally on the Devtron Platform. Administrators can now be grant users access to resources irrespective of cluster or environment. This enabled developers and administrators can use the resource browser to manage and troubleshoot their applications and resources across clusters.
Why do you need a K8s Resource Browser?
Though many Kubernetes CLI clients like kubectl can interact with the cluster and help manage Kubernetes resources, the command line utility only solves the need of DevOps and developers to a certain extent. Still, when it comes to troubleshooting and debugging, a dashboard with clear visibility of Kubernetes resources about the health conditions is preferred as it can help debug the issues faster. Without Devtron’s Kubernetes Resource Browser, DevOps will be firing plentiful commands to find the root cause of the bug.
The Kubernetes Resource Browser empowers you with all the features you need to manage your Kubernetes resources and helps you troubleshoot and resolve issues quickly from the dashboard itself.
How does the Resource Browser help your teams streamline operations?
The Kubernetes dashboard provides a simple, easy-to-use user interface for managing and monitoring Kubernetes applications and clusters. The Kubernetes resource browser increases the scope of Kubernetes application management- from aiding in convenience to enriching the capabilities of a dashboard.
Let’s see what the K8s resource browser brings to the table.
Improved Monitoring & Observability
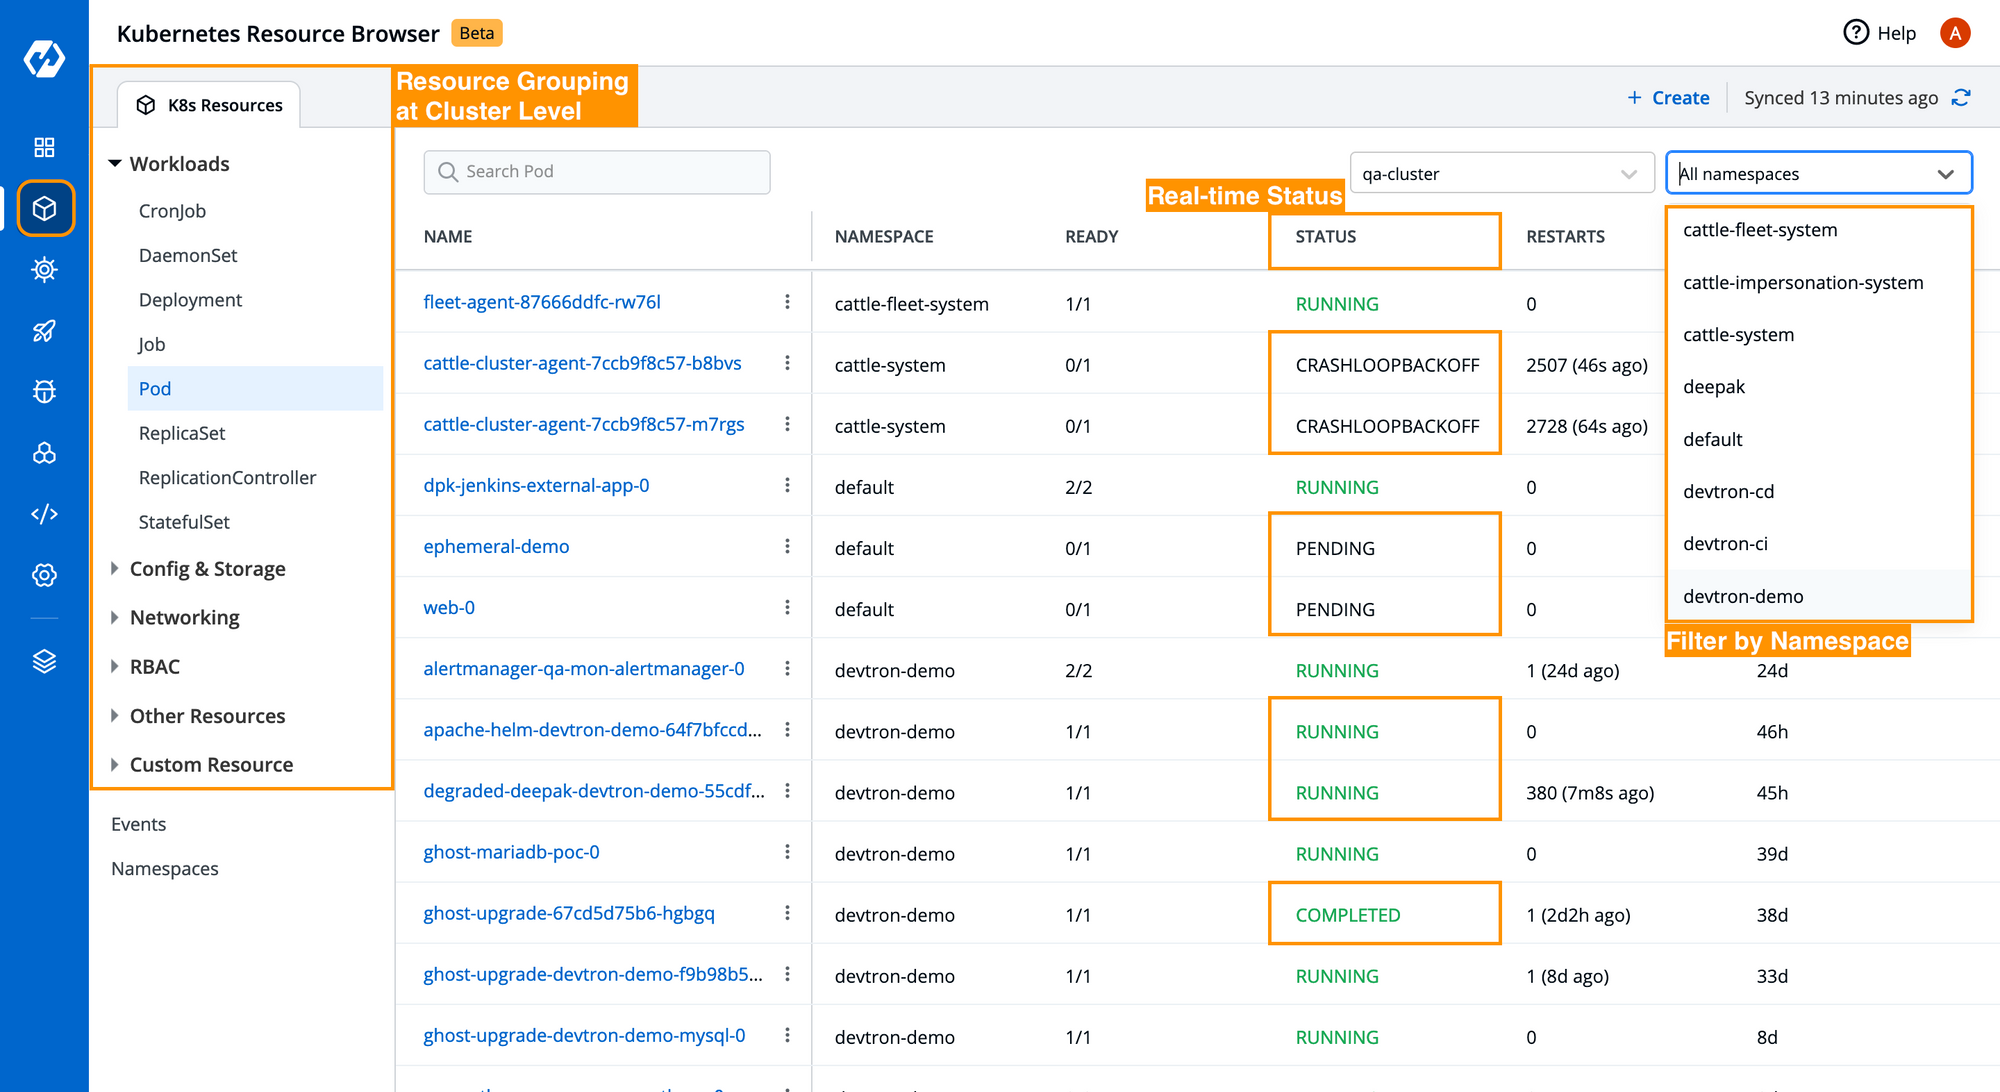
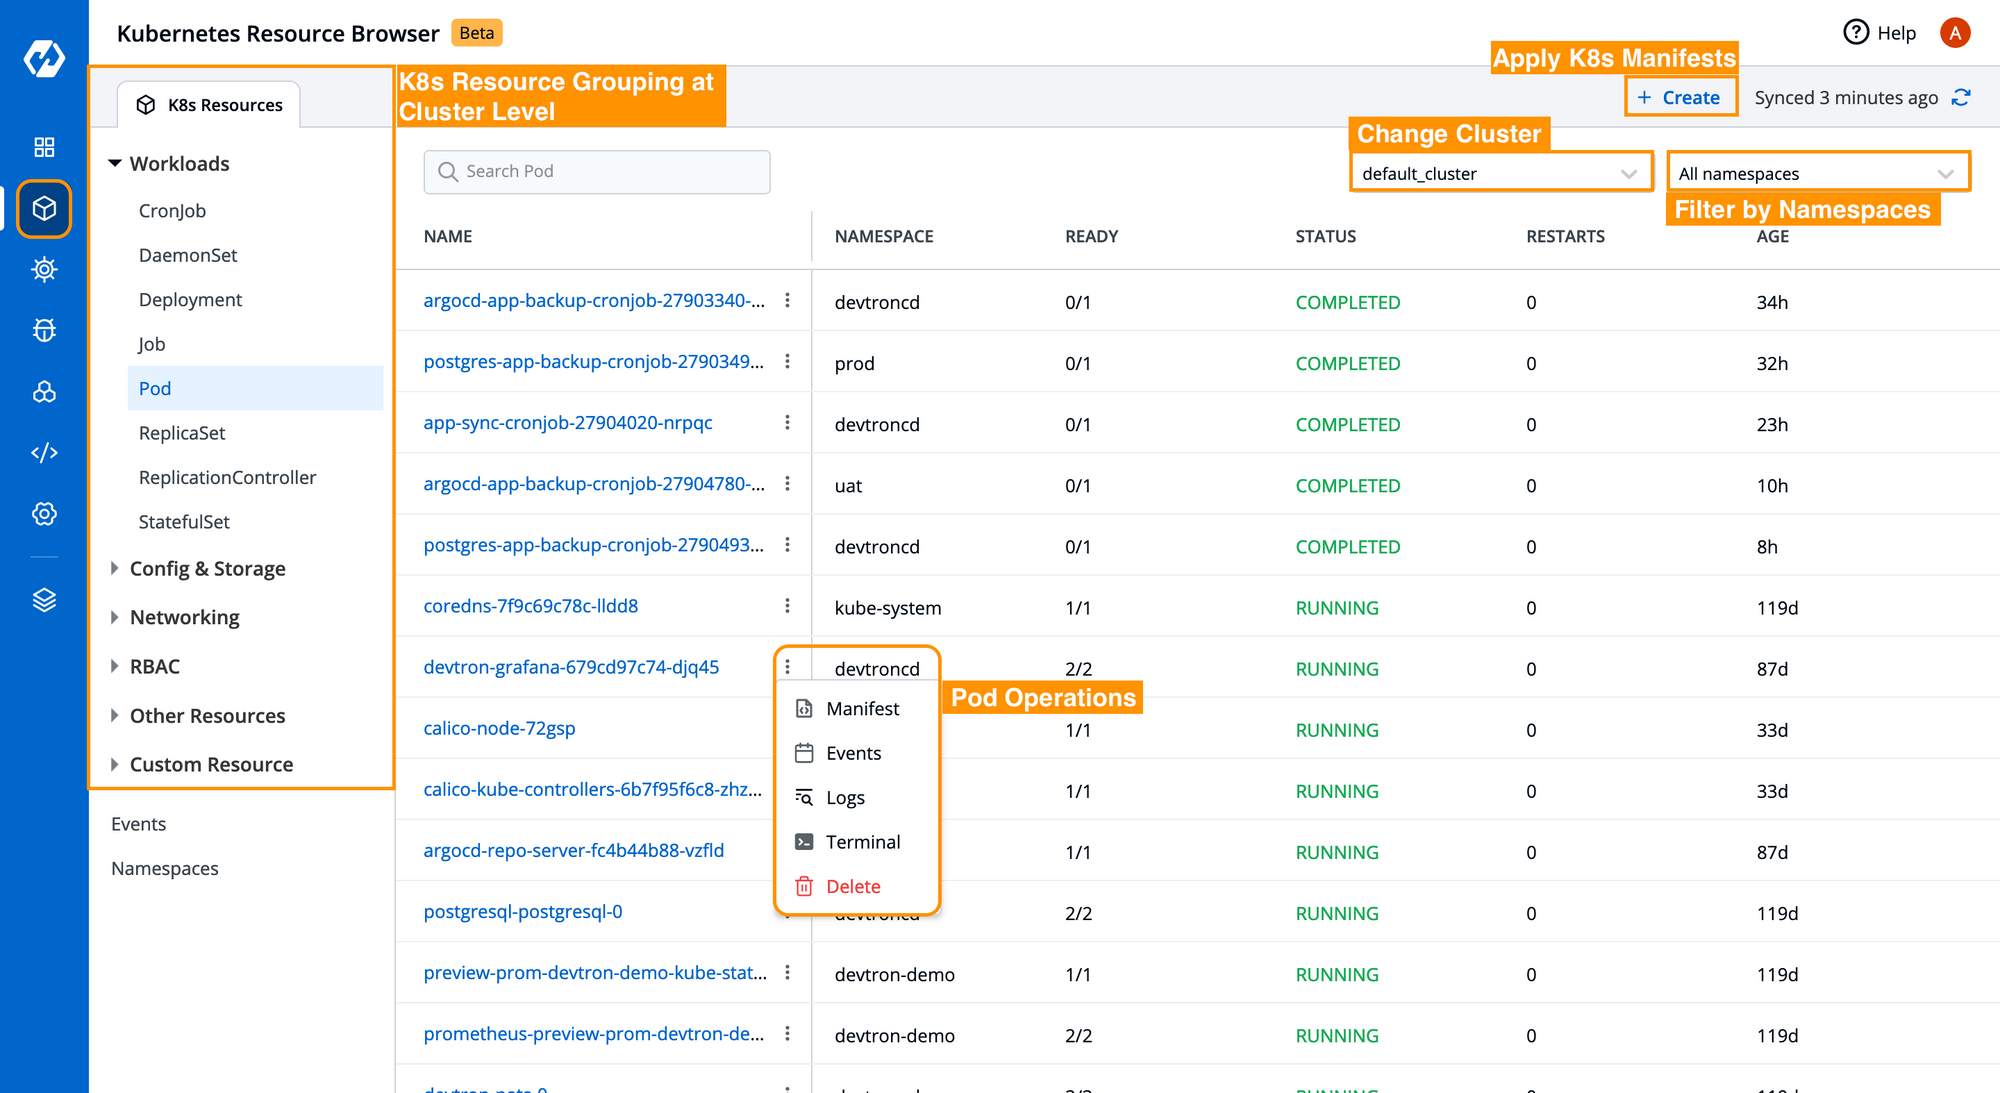
The Kubernetes resource browser helps you monitor and observe all your Kubernetes resources deployed in the cluster. It provides resource grouping of the Kubernetes resources across the selected cluster and displays the real-time status of workloads, as seen in Fig B. You can also filter out resources by namespaces and quickly navigate to multiple clusters from the dashboard itself.
Faster Troubleshooting & Debugging
With the Kubernetes resource browser, troubleshooting the Kubernetes applications becomes a breeze. It allows you to perform operations on pods such as
- checking manifest, and editing live manifest as per needs,
- getting the latest events of the clusters, pod in a dedicated panel,
- viewing real-time logs,
- Performing exec into the pods for debugging if required, and much more.
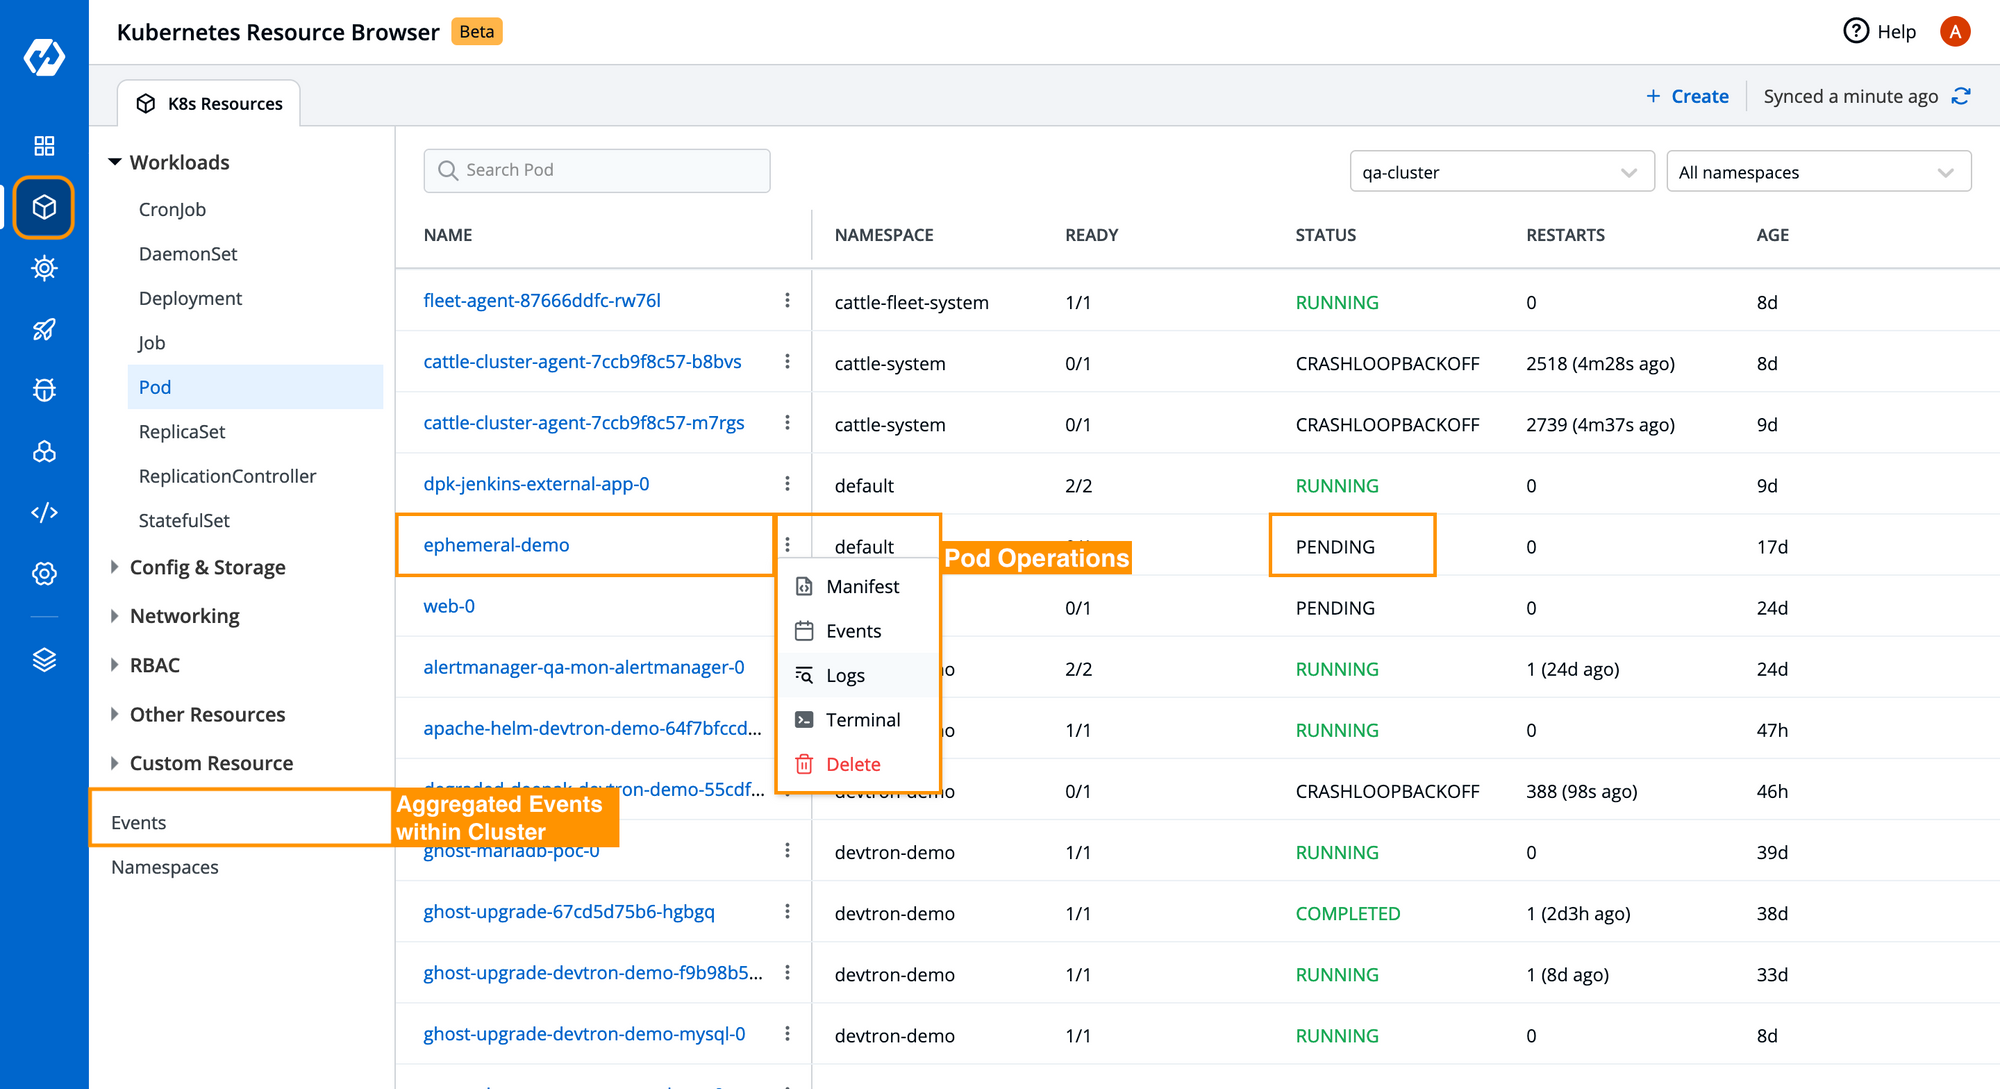
For instance, the pod ephemeral-demo is in a Pending state, as seen in Fig C. Let’s perform a simple set of processes to check this pod's events and figure out the cause.
- Click on the
ellipsisright to the pod name; - All pod operations performed on the workload will be listed down, as seen in Fig C.
- To perform any operation, click on the options available.
- In our case, it’s
Events.
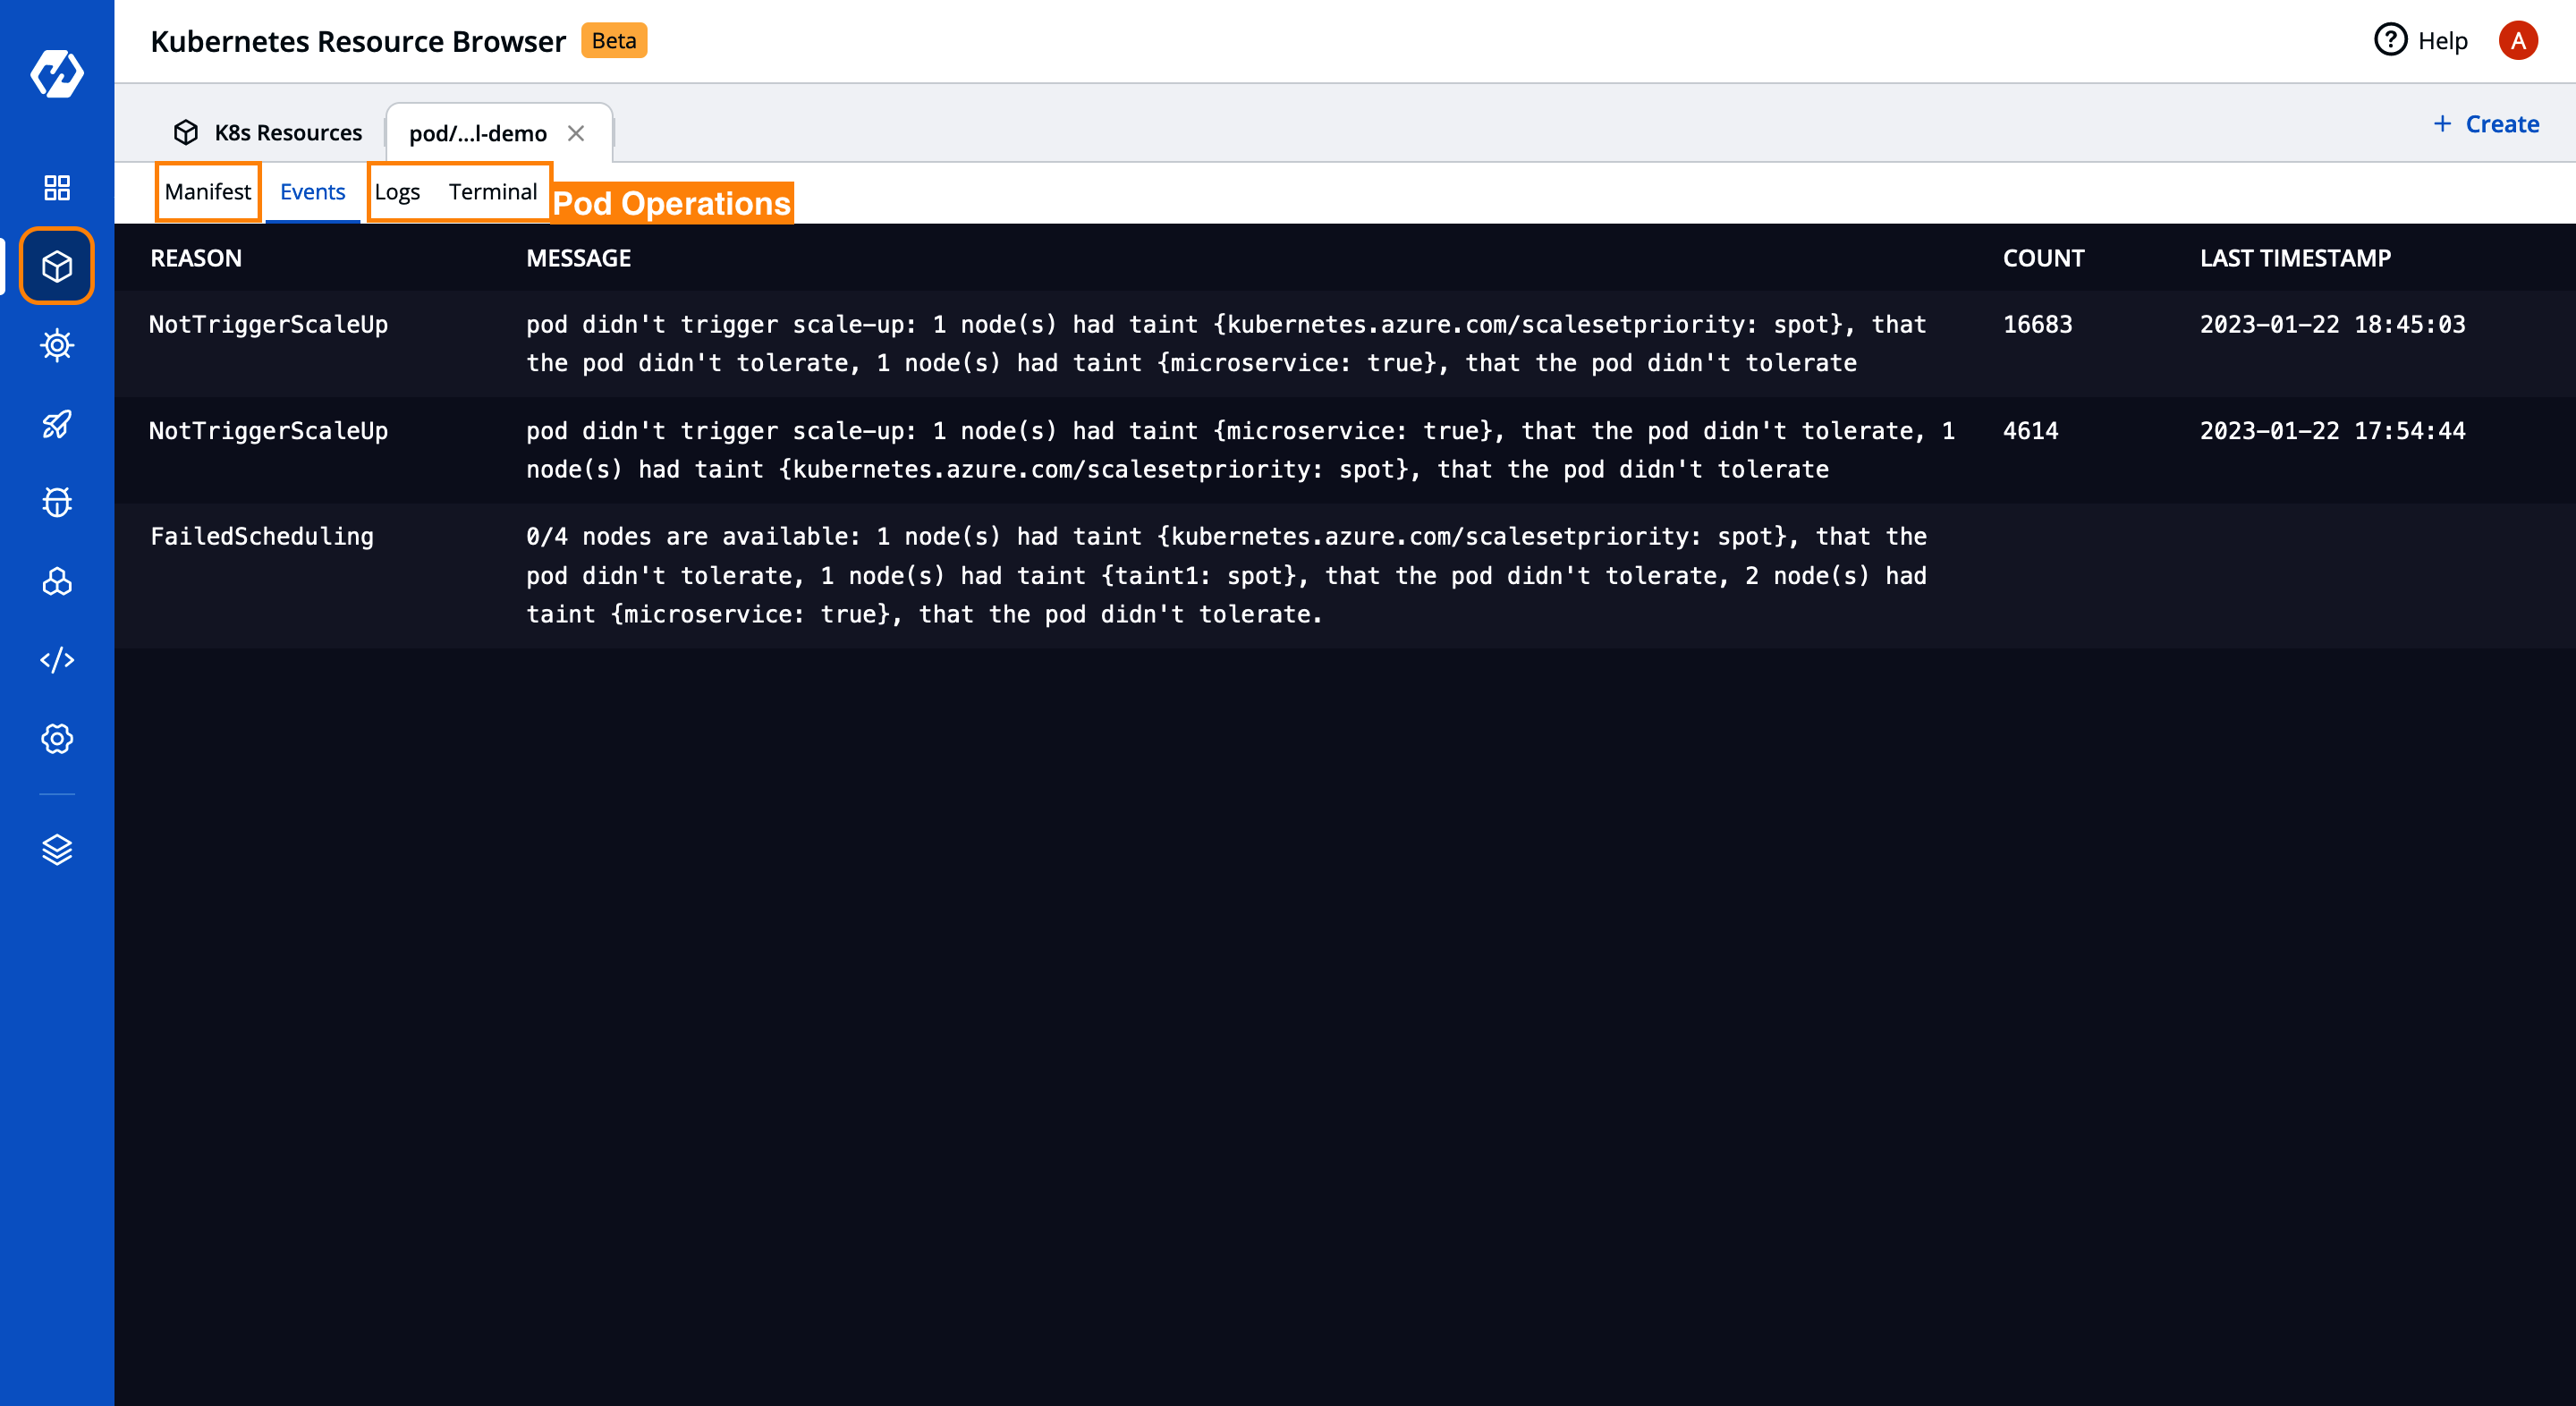
5. As per the latest events, there isn’t a node available for it to be scheduled, as shown in Fig D.
6. As all 4 nodes have taints, the scheduler cannot schedule the pod ephemeral-demo to any of the nodes.
Apart from Events, you can check the manifests of the pod and edit the live manifest if required. But the access to edit a live manifest can be controlled with the RBAC service. Developers and DevOps can look into real-time logs and exec into the shell using the terminal from the same interface as seen in Fig D.
Enable Resource-Specific Access Management
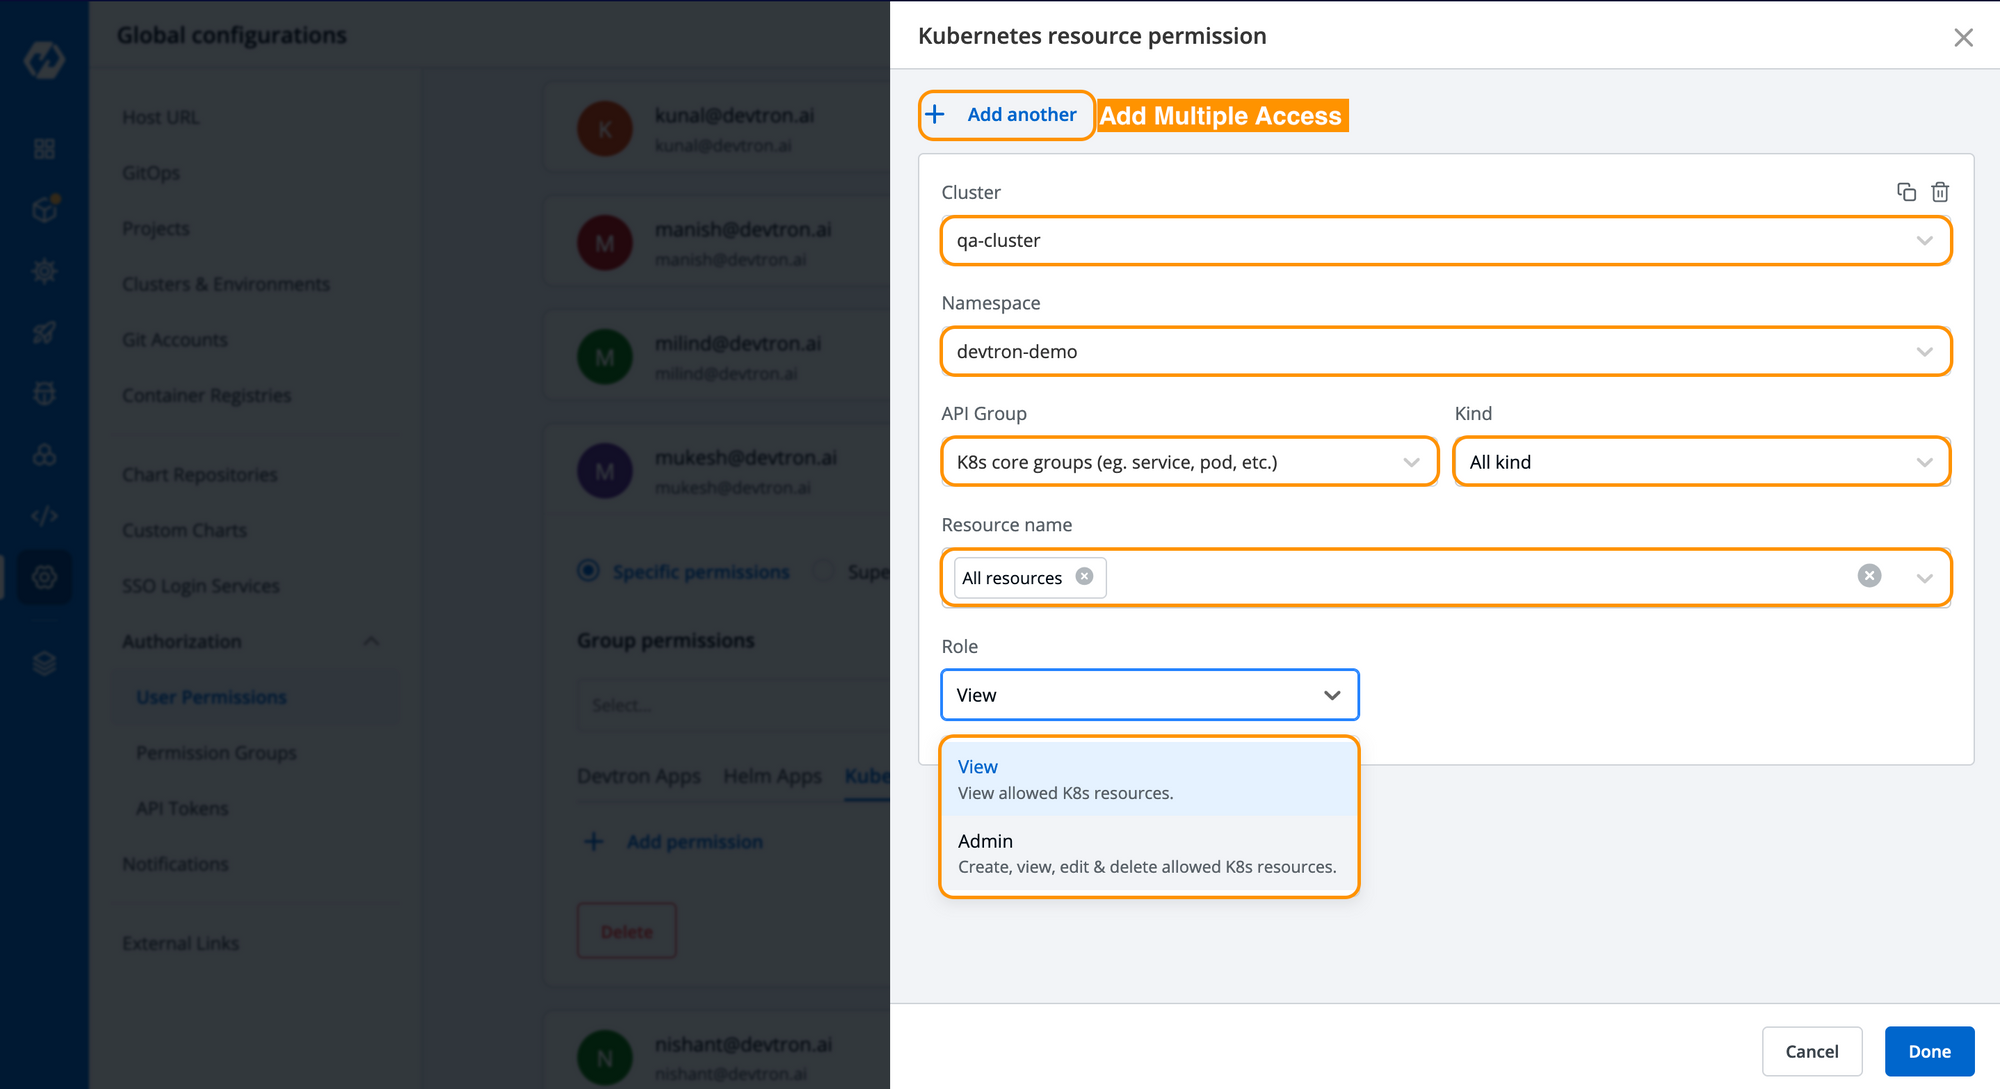
The traditional Kubernetes dashboards heavily depend on manually configured RBAC policies to enforce access control for each cluster. Dashboards like Octant and Lens do not prioritize access management, whereas the Kubernetes Dashboard by Devtron aka Devtron Dashboard provides users with a centralized panel for access management. It enables you to give view and admin access to a specific Kubernetes resource of a selected API Group in a specific namespace of the selected cluster, as seen in the Fig E It also allows users to duplicate the permissions or add another set of permissions to different clusters with ease.
This can help the DevOps teams or senior managers to set guardrails/ playgrounds within the dashboard, and allows developers to troubleshoot the issues on their own in non-critical environments.
Conclusion
The Kubernetes resource browser adds value to the daily operations of DevOps and developers. It can help you monitor and quickly debug workloads in case of an issue. The Kubernetes dashboard provides a fined grained access management that enables easy collaboration between developers and the operations team.
We would love to know your thoughts on this latest release. Feel free to join our community discord server and share your suggestions and feedback. If you think our Kubernetes dashboard is adding value to your day-to-day operations at your work, please do not forget to star our github repository.
FAQ
What is the Kubernetes Resource Browser, and how does it help manage Kubernetes resources?
The Kubernetes Resource Browser is a feature in Devtron, offering a graphical interface to manage Kubernetes resources. It enables users to view, edit, and troubleshoot pods and services across clusters, simplifying operations and resource management.
How does the Kubernetes Resource Browser improve monitoring and troubleshooting for Kubernetes clusters?
The browser enhances monitoring by grouping resources and displaying real-time status. It speeds up troubleshooting by allowing users to check manifests, view pod events, check logs, and execute commands within pods, all from the dashboard.
How does the Kubernetes Resource Browser streamline operations and scale DevOps workflows?
It centralizes resource management across clusters, providing improved monitoring, quicker troubleshooting, and easy access to resource actions. This simplification supports scaling DevOps workflows effectively.
What role does Role-Based Access Control (RBAC) play in the Kubernetes Resource Browser?
RBAC in the Resource Browser enables secure, granular access control to specific resources across clusters. It allows admins to set precise permissions, ensuring that teams can collaborate securely while maintaining proper access rights.