1. Observability is essential for detecting CI/CD issues early and ensuring reliable deployments.
2. Logs, metrics, and traces together give teams a complete view of pipeline health and performance.
3. Devtron simplifies monitoring with a unified dashboard and built-in logging, metrics, and alerting.
4. Proactive debugging and insights help reduce downtime and improve developer productivity.
Suppose a team has a critical deployment for a specific time, but it never happens. The team scrambled to uncover the issue, only to discover, hours later, that the build had failed quietly. This scenario is all too common in CI/CD pipelines lacking proper observability. In today's fast-paced software delivery landscape, CI/CD observability is no longer optional; it’s a necessity. Devtron is an open-source DevOps platform built on Kubernetes, empowers teams to easily monitor their pipelines, debug them, and adapt.
What is CI/CD Observability and Why Does It Matter?
Continuous monitoring and observability should be considered the backbone of your CI/CD pipeline, as they help to ensure the health, performance, and reliability of your applications and infrastructure across each phase of your DevOps and IT operations lifecycles.
- Faster Issue Detection and Resolution: Observability tools pinpoint problems, such as failing tests or slow builds, in real time, cutting downtime and keeping your delivery on track.
- Improved Pipeline Efficiency: Metrics highlight bottlenecks or resource-heavy stages, allowing you to optimize for faster, smoother deployments.
- Enhanced Developer Productivity: Clear insights reduce manual debugging, freeing developers to focus on writing code rather than troubleshooting pipelines.
- Scalability and Reliability: As your pipeline scales, observability ensures it remains stable and performant, even under heavy workloads.
Logs, metrics, and traces give their perspectives on system performance. When analyzed together, they provide a complete picture of your infrastructure, allowing teams to gain granular insights into the system’s health and performance.
Logs – Tracking Every Deployment and Failure
Logs are files that record events, alerts, and errors as they occur, including timestamps and associated users or endpoints. For example, a web server log might detail server startups, client requests, successful transactions, or failed connections. In CI/CD, logs provide a historical trail of pipeline activities, enabling teams to debug issues, audit processes, and understand failure contexts.
Best For: Identifying when a problem occurred and correlating it with events or trends.
Metrics – Performance Benchmarks Across Pipelines
Metrics are quantifiable measurements of system health, such as build times, success rates, or resource usage (e.g., CPU or memory consumption). They offer real-time insights into pipeline performance, allowing teams to benchmark and optimize slow stages. By correlating metrics with logs and traces, teams gain detailed insights to spot anomalies and prevent issues.
Best For: Assessing application responsiveness and detecting early signs of performance problems.
Traces – Debugging CI/CD Flow Across Clusters and Environments
Traces track the path of a request through the pipeline, recording the time it takes for each component to process and transfer it. In distributed CI/CD setups, trace maps flow across clusters and environments, pinpointing delays or failures that occur. They are critical for identifying the root cause of issues in complex microservices architectures.
Best For: Finding the exact source of problems in distributed systems.
Observability Challenges in CI/CD
Lack of Visibility Across Multi-Cluster Pipelines
Managing CI/CD pipelines across multiple Kubernetes clusters often suffers from fragmented visibility. Teams struggle to gain a unified view of pipeline execution, deployment status, and cluster health, leading to delays in identifying and resolving issues. The complexity of tracking workflows across distributed environments makes it difficult to ensure consistent performance and reliability.
Disjointed Tools for Logging and Monitoring
CI/CD observability is often hampered by the use of multiple, disconnected tools for logging, monitoring, and tracing. Teams must navigate disparate interfaces to collect logs, metrics, and traces, which complicates correlation of data and delays actionable insights. This fragmented approach increases operational overhead and reduces efficiency in identifying performance bottlenecks or errors.
Reactive Debugging Over Proactive Resolution
Many CI/CD systems rely on reactive debugging, where issues like slow builds, resource bottlenecks, or deployment failures are addressed only after they occur. The lack of real-time monitoring and predictive analytics means teams are often caught off-guard by anomalies, leading to prolonged downtime and reduced system reliability. Without proactive strategies, ensuring safe and stable deployments becomes challenging.
Difficulty in Accessing Logs, Events, and Metrics
In Kubernetes environments, accessing logs, events, and metrics in a cohesive manner is a significant challenge. Teams often need to switch between multiple tools to track CPU usage, memory consumption, or HTTP status codes, which disrupts workflows and slows down issue resolution. The absence of a unified interface makes it hard to gain a comprehensive view of application performance and health.
How Devtron Solves Them
Lack of Visibility Across Multi-Cluster Pipelines
Devtron provides a single-pane dashboard that consolidates observability across multi-cluster pipelines. It integrates with Kubernetes to offer real-time insights into pipeline execution, deployment metrics, and cluster health.
Disjointed Tools for Logging and Monitoring
Devtron simplifies observability by offering built-in logging and monitoring capabilities tailored for Kubernetes environments. It integrates seamlessly with popular tools like Prometheus and Grafana, aggregating logs, metrics, and traces into a cohesive interface. This eliminates the need to juggle multiple tools, enabling teams to correlate data quickly and gain actionable insights. Devtron’s centralized approach streamlines monitoring and reduces operational overhead.
Proactive Resolution Over Reactive Debugging
Devtron prioritizes proactive resolution with advanced observability features, including predictive analytics. It monitors pipeline performance in real-time, detecting anomalies like slow builds or resource bottlenecks before they escalate. Devtron also supports progressive delivery strategies such as canary and blue-green deployments, enabling safe testing of changes with the ability to roll back if issues arise.
View Logs, Events, and Metrics in One Unified Dashboard
Devtron’s unified dashboard is a game-changer for managing Kubernetes workloads. It consolidates logs, events, and metrics into a single, intuitive interface, providing a 360-degree view of your applications. Whether you’re tracking CPU usage, memory consumption, or HTTP status codes, Devtron integrates with tools like Grafana and Prometheus to deliver real-time metrics. This eliminates the need to juggle multiple tools, enabling teams to quickly identify performance bottlenecks or errors. For instance, developers can instantly view pod logs alongside cluster events, making it easier to pinpoint issues without switching contexts.
Root Cause Analysis with Deployment History and Audit Trails
When things go wrong, identifying the root cause is critical. Devtron’s deployment history and audit trails simplify this process by providing a detailed record of every change made to your applications. Teams can track configuration drifts, review past deployments, and even roll back to stable versions if needed. For example, if a container enters a CrashLoopBackOff state, Devtron’s logs and event histories help uncover whether the issue stems from misconfigurations, resource constraints, or external dependencies. This transparency accelerates troubleshooting and ensures compliance with security and governance policies.
Alerts and Notifications for Immediate Action
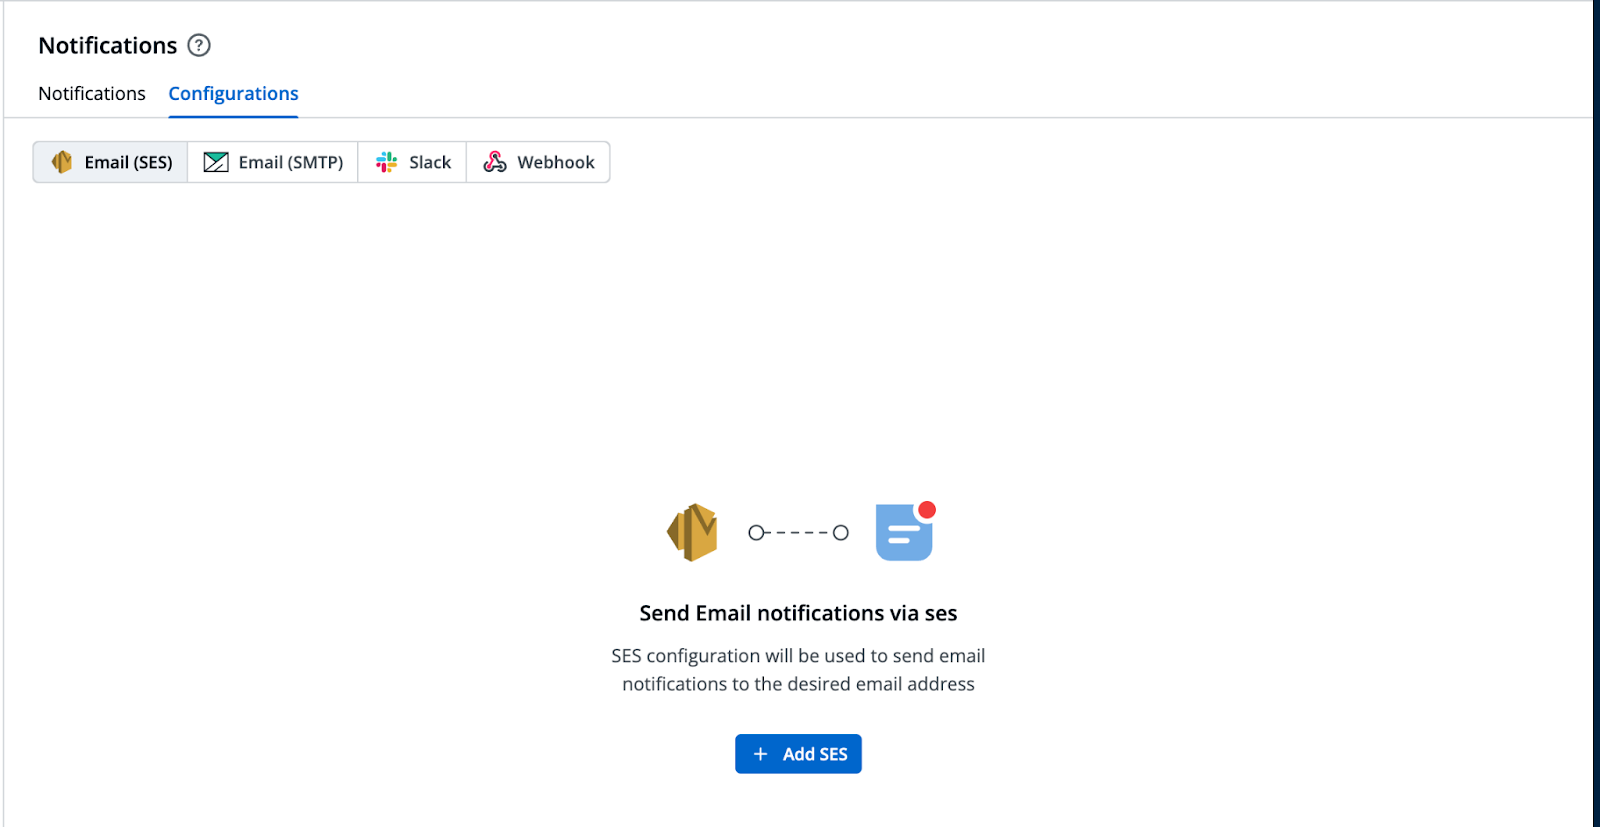
Proactive monitoring is essential for maintaining application health, and Devtron excels in this area with its integrated alerting system. It supports notifications via email, Slack, and custom webhook, allowing teams to receive instant alerts on critical issues like deployment failures across any preferred channel.
CI/CD Monitoring with Devtron
Devtron’s CI/CD monitoring capabilities provide a robust framework for tracking and optimizing both continuous integration (CI) and continuous deployment (CD) pipelines. The following sections highlight key aspects of CI monitoring, deployment history, and deployment metrics, contributing to enhanced observability in a CI/CD environment.
CI Monitoring
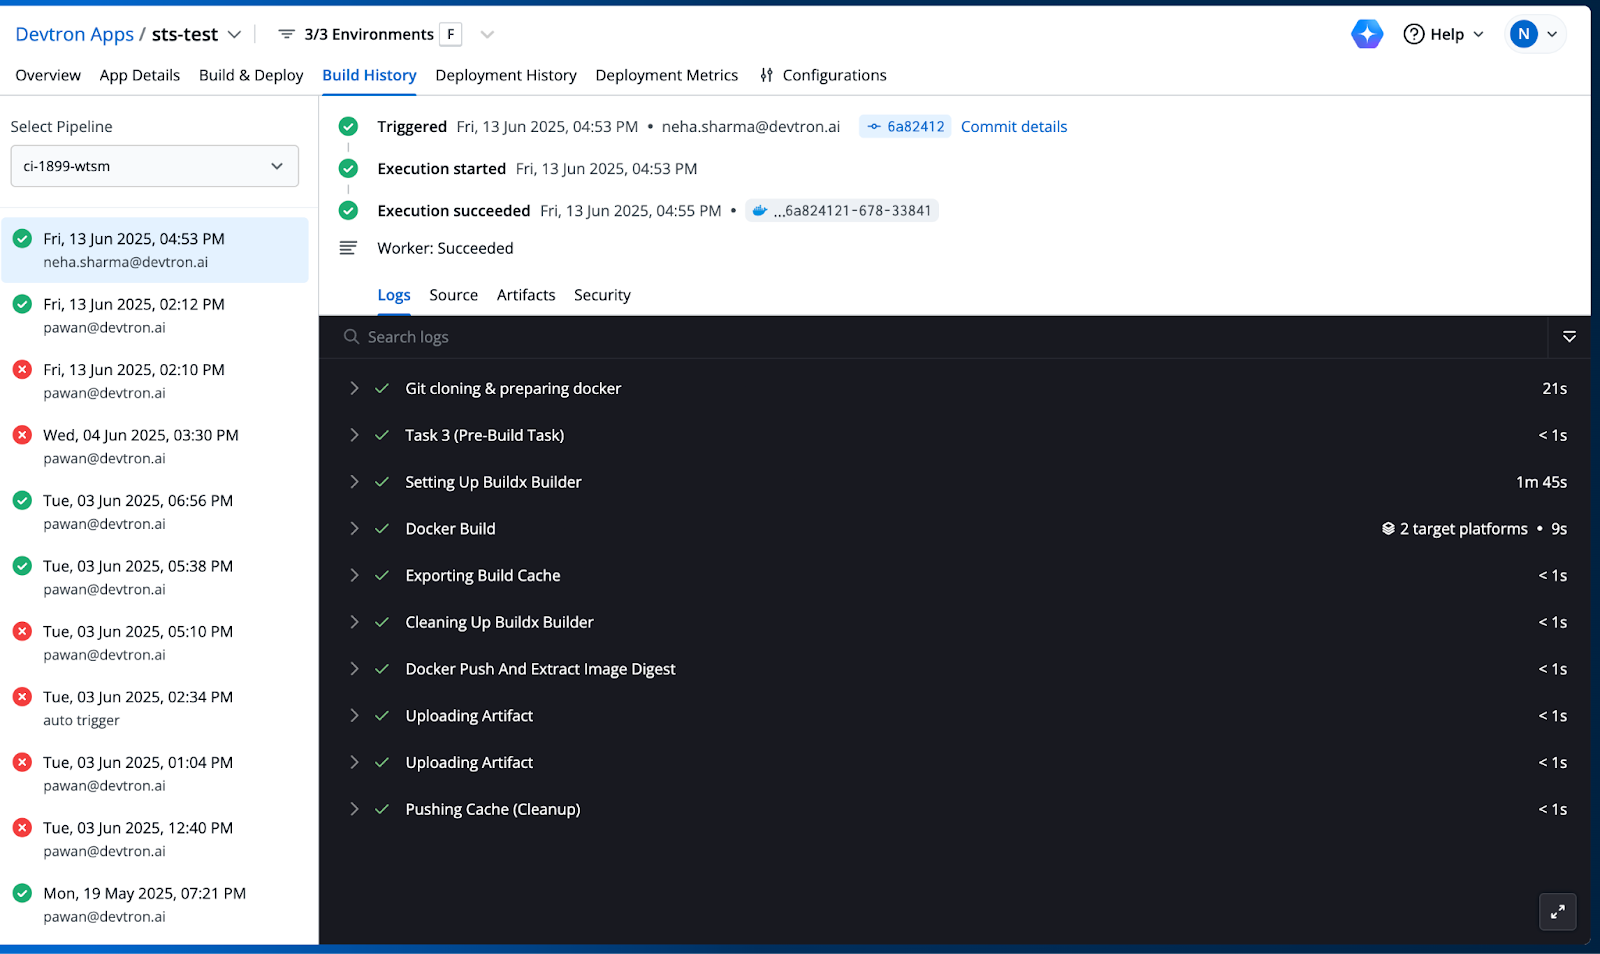
The CI monitoring feature offers real-time insights into the build and integration process. For example, a CI pipeline is triggered, completing successfully within a two-minute window. The process includes:
- Git cloning & preparing docker
- Setting Up Buildx Builder
- Docker Build
- Additional steps like exporting the build cache, cleaning up, Docker push, and artifact uploads are completed. This detailed breakdown allows teams to monitor build times, identify delays, and ensure the integration of code changes into a deployable artifact efficiently.
Deployment History
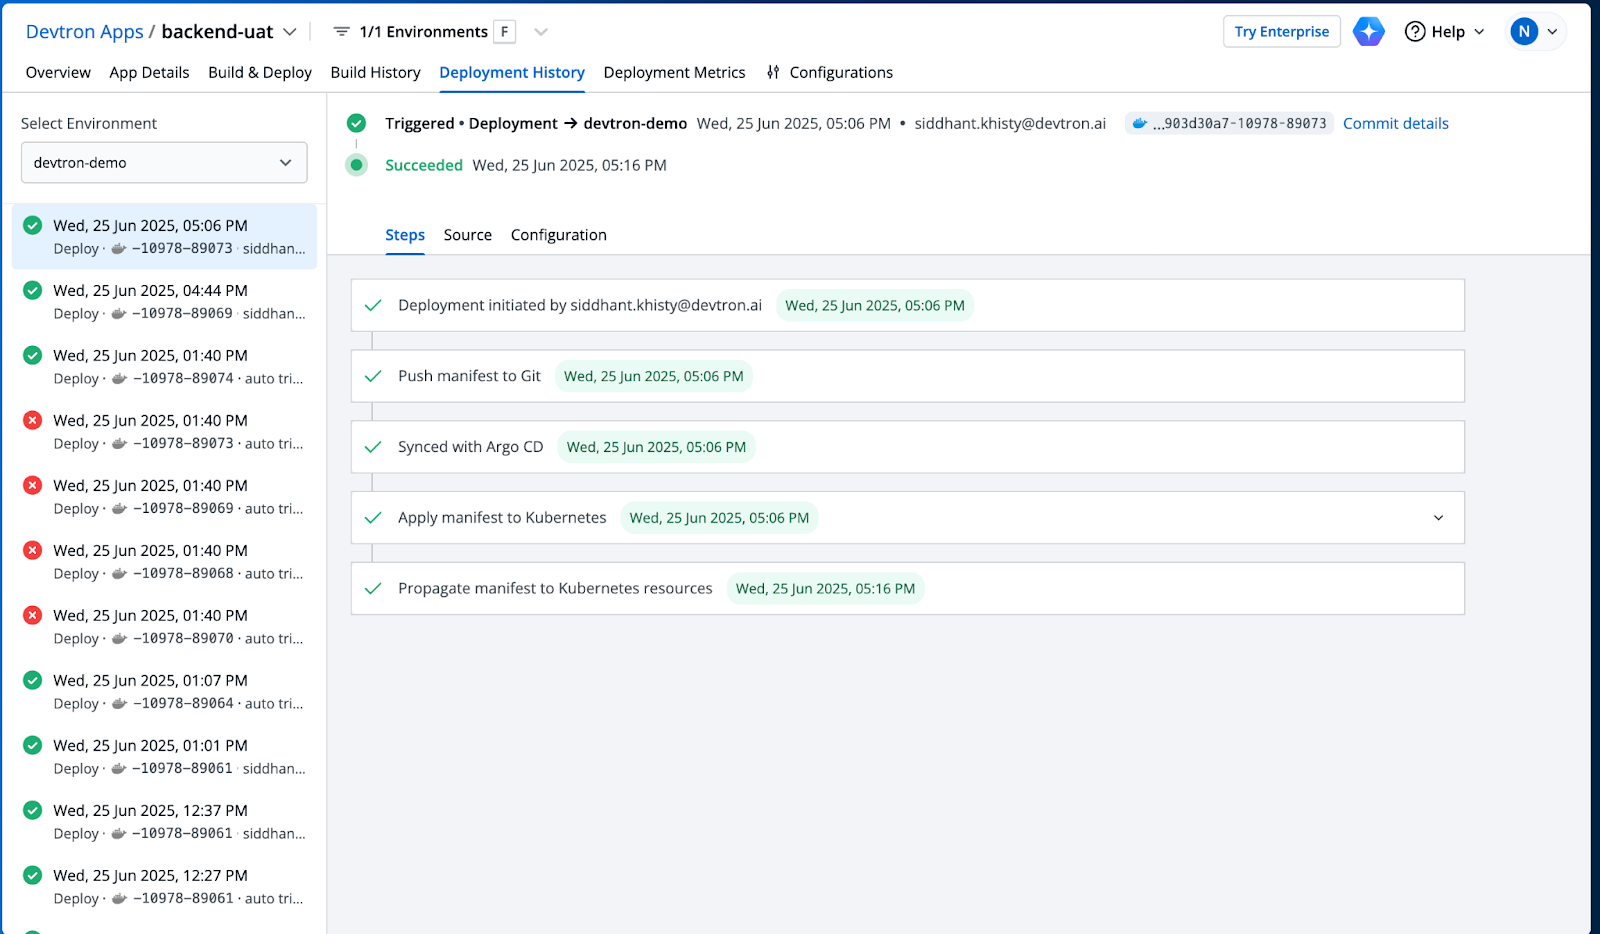
The deployment history feature provides a detailed timeline of all deployment activities within the CI/CD pipeline. A deployment to the staging environment is triggered, with the process completed successfully within minutes. The sequence includes:
- Deployment Initiation: Marks the beginning of the deployment process.
- Push Manifest to Git: Ensures version control integration.
- Sync with Argo CD: Aligns the deployment with the continuous delivery tool.
- Apply Manifest to Kubernetes: Deploys the application to the cluster.
- Propagate Manifest to Kubernetes Resources: Ensures all resources are updated. This history also reflects past attempts, such as a failed deployment, enabling teams to analyze issues like misconfigurations or resource constraints.
Deployment Metrics
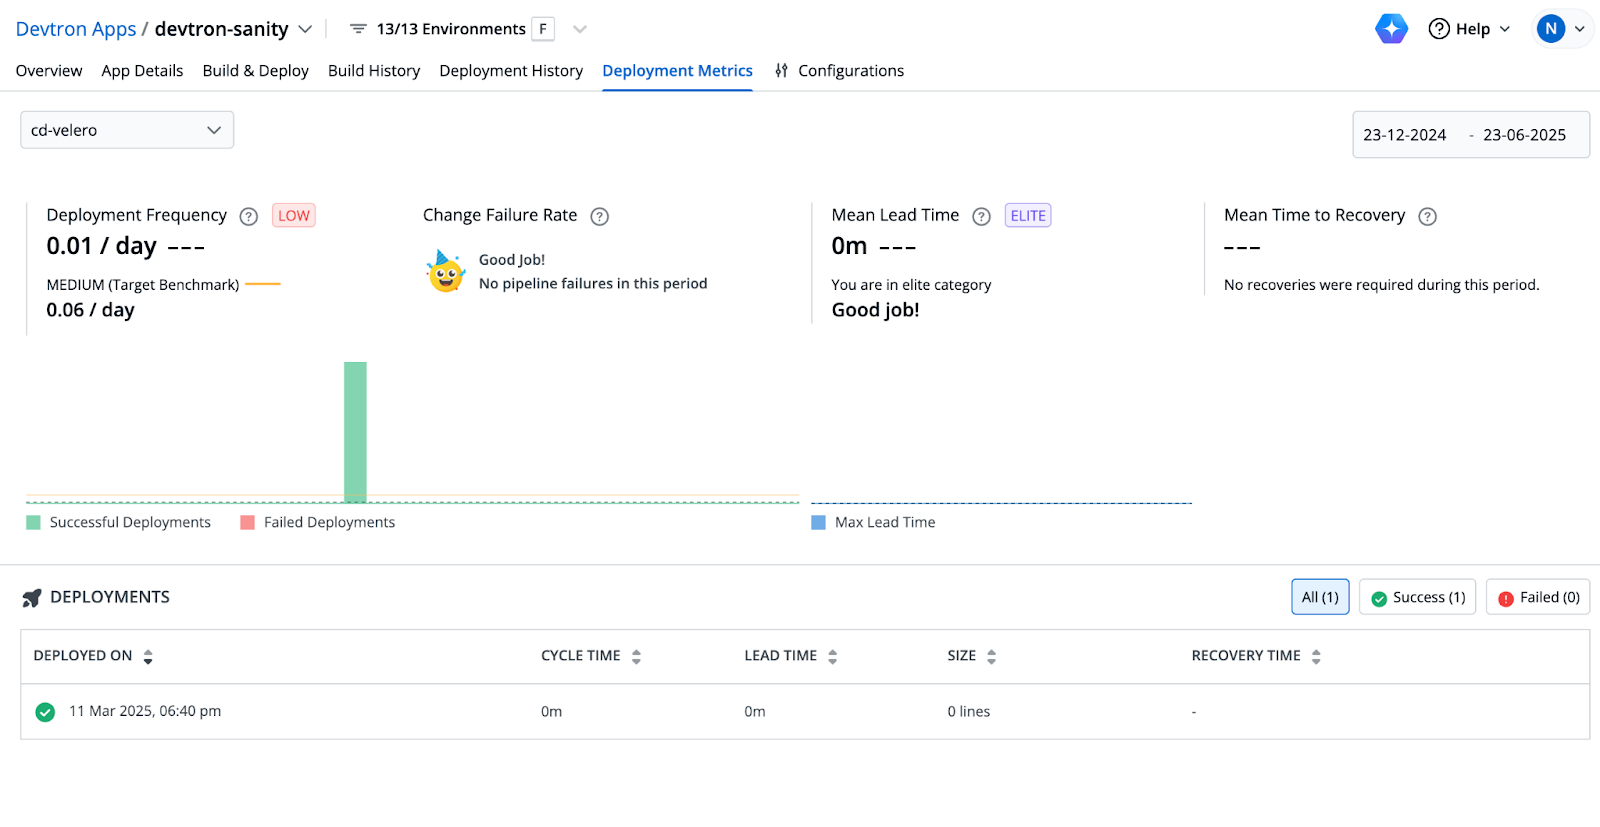
Devtron’s deployment metrics offer actionable insights into the performance and efficiency of the CI/CD pipeline. Over a specified period, the metrics reveal:
- Deployment Frequency: Recorded deployments per day, classified as low compared to a medium target benchmark per day.
- Change Failure Rate: No pipeline failures are noted, earning a "Good job!" status with no incidents requiring recovery.
- Mean Lead Time: Achieves a status within a minute, reflecting an efficient transition from code commit to deployment.
- Mean Time to Recovery: Not applicable, as no recoveries are needed during this period. A single successful deployment with a cycle time, lead time, and size of a minute underscores the stability of the process.
Conclusion
Together, CI monitoring, deployment history, and metrics enhance overall CI/CD observability by providing real-time visibility into build processes, deployment timelines, and performance metrics. The detailed logs and timestamps enable quick identification of success or failure points, while metrics offer a quantitative assessment of efficiency and stability. This integrated approach allows teams to proactively manage the pipeline, reduce downtime, and improve reliability in a Kubernetes environment.
FAQs
What is CI/CD observability?
CI/CD observability refers to the ability to monitor and gain insights into your continuous integration and delivery pipelines. It uses logs, metrics, and traces to provide real-time visibility into pipeline performance, helping teams detect, debug, and resolve issues faster.
Why is observability important in CI/CD pipelines?
Observability ensures the health, reliability, and performance of CI/CD pipelines. Without it, teams risk silent build failures, delayed deployments, and increased downtime. It helps identify bottlenecks, reduce debugging time, and improve overall delivery speed.
What challenges do teams face with CI/CD observability?
Common challenges include fragmented visibility across multi-cluster pipelines, reliance on multiple disjointed tools for monitoring, and reactive debugging instead of proactive issue detection.
How does Devtron improve CI/CD observability?
Devtron provides a unified dashboard that consolidates logs, metrics, and traces across multi-cluster Kubernetes pipelines. It enables real-time monitoring, proactive alerts, root cause analysis, and simplified debugging, all within a single interface.
What are the benefits of using Devtron for CI/CD monitoring?
With Devtron, teams gain faster issue detection, improved pipeline efficiency, enhanced developer productivity, and greater stability in large-scale Kubernetes environments.