In today’s world, Kubernetes has become the de-facto method for deploying and managing application workloads. While it offers several advantages and is renowned for its incredible scaling capabilities, managing Kubernetes is quite challenging. Moreover, with every single release, it becomes increasingly more complex, adding additional learning curves, and things that operators need to consider when deploying their applications. A single cluster may not be able to satisfy the scale that many companies wish to operate at. In such a scenario, folks tend to use multiple Kubernetes clusters, across different cloud providers.
While shifting to a multi-cluster architecture allows companies to scale to huge numbers, the complexity also increases. Trying to manage multiple clusters with CLI tools is a recipe for disaster. CLI tools involve a lot of context switching, which can easily lead to common errors, and misconfigurations, and introduce a risk of downtime and potential security flaws due to the increased cognitive burden upon developers.
To mitigate the challenges and risks of managing Kubernetes clusters, there are a number of Kubernetes dashboards. These Kubernetes dashboards abstract much of the complexity in Kubernetes and make it easy to manage clusters through a single intuitive dashboard.
In this article, we delve into a side-by-side comparison of Devtron and Headlamp, highlighting their strengths and identifying which dashboard suits your Kubernetes strategy.
Devtron
Devtron is an open-source Kubernetes dashboard that is designed to give the user comprehensive visibility into their cluster, while also reducing context switching. Rather than using kubectl to switch between clusters. Devtron can connect to multiple different Kubernetes clusters and enable you to observe and manage the clusters with ease. To use Devtron, you will have to install it on your target Kubernetes cluster.
Apart from the resource browser, Devtron also has robust application management functionality. You can use public helm charts for integrating tools from the Cloud Native ecosystem such as Nginx or Prometheus, or you can package your custom application, and upload it to a chart repository. Then you can deploy the chart on Devtron and manage your application workload. Devtron has a couple of robust features for managing applications which will be discussed below.
To read more about Devtron, please refer to their documentation and the GitHub repository.
Headlamp
Headlamp is a user-friendly Kubernetes UI focused on extensibility and a CNCF sandbox project. It was created as a Kubernetes web UI with the traditional dashboard features of listing resources, along with some additional features. It can be installed either locally and connected to your clusters, or you can directly install it within your Kubernetes cluster.
To read more about Headlamp, please refer to their documentation and the GitHub repository.
Within this blog, we will be comparing all the functionalities offered by Headlamp and Devtron, and see how they both approach managing Kubernetes clusters at scale. We will look at the different features that are essential for a Kubernetes Dashboard such as multi-cluster management, how it approaches and helps with managing application workloads, ease of navigation through the dashboard, and extensibility via platform integrations.
Kubernetes Cluster Management
One of the things that make Kubernetes so complex is the sheer number of resources that exist within a cluster. Adding fuel, to the fire, there are resources in Kubernetes that are interlinked and work together. Figuring out how these resources are related to one another, and how they are referenced in a third resource can become a very big challenge. As the scale of the application grows, so does this complexity. One of the most essential features of any Kubernetes dashboard is providing the user with a good level of visibility into the resources in the cluster. To reduce context switching, a good Kubernetes dashboard should enable us to debug and run commands from the dashboard to avoid context switching.
Cluster management in Headlamp
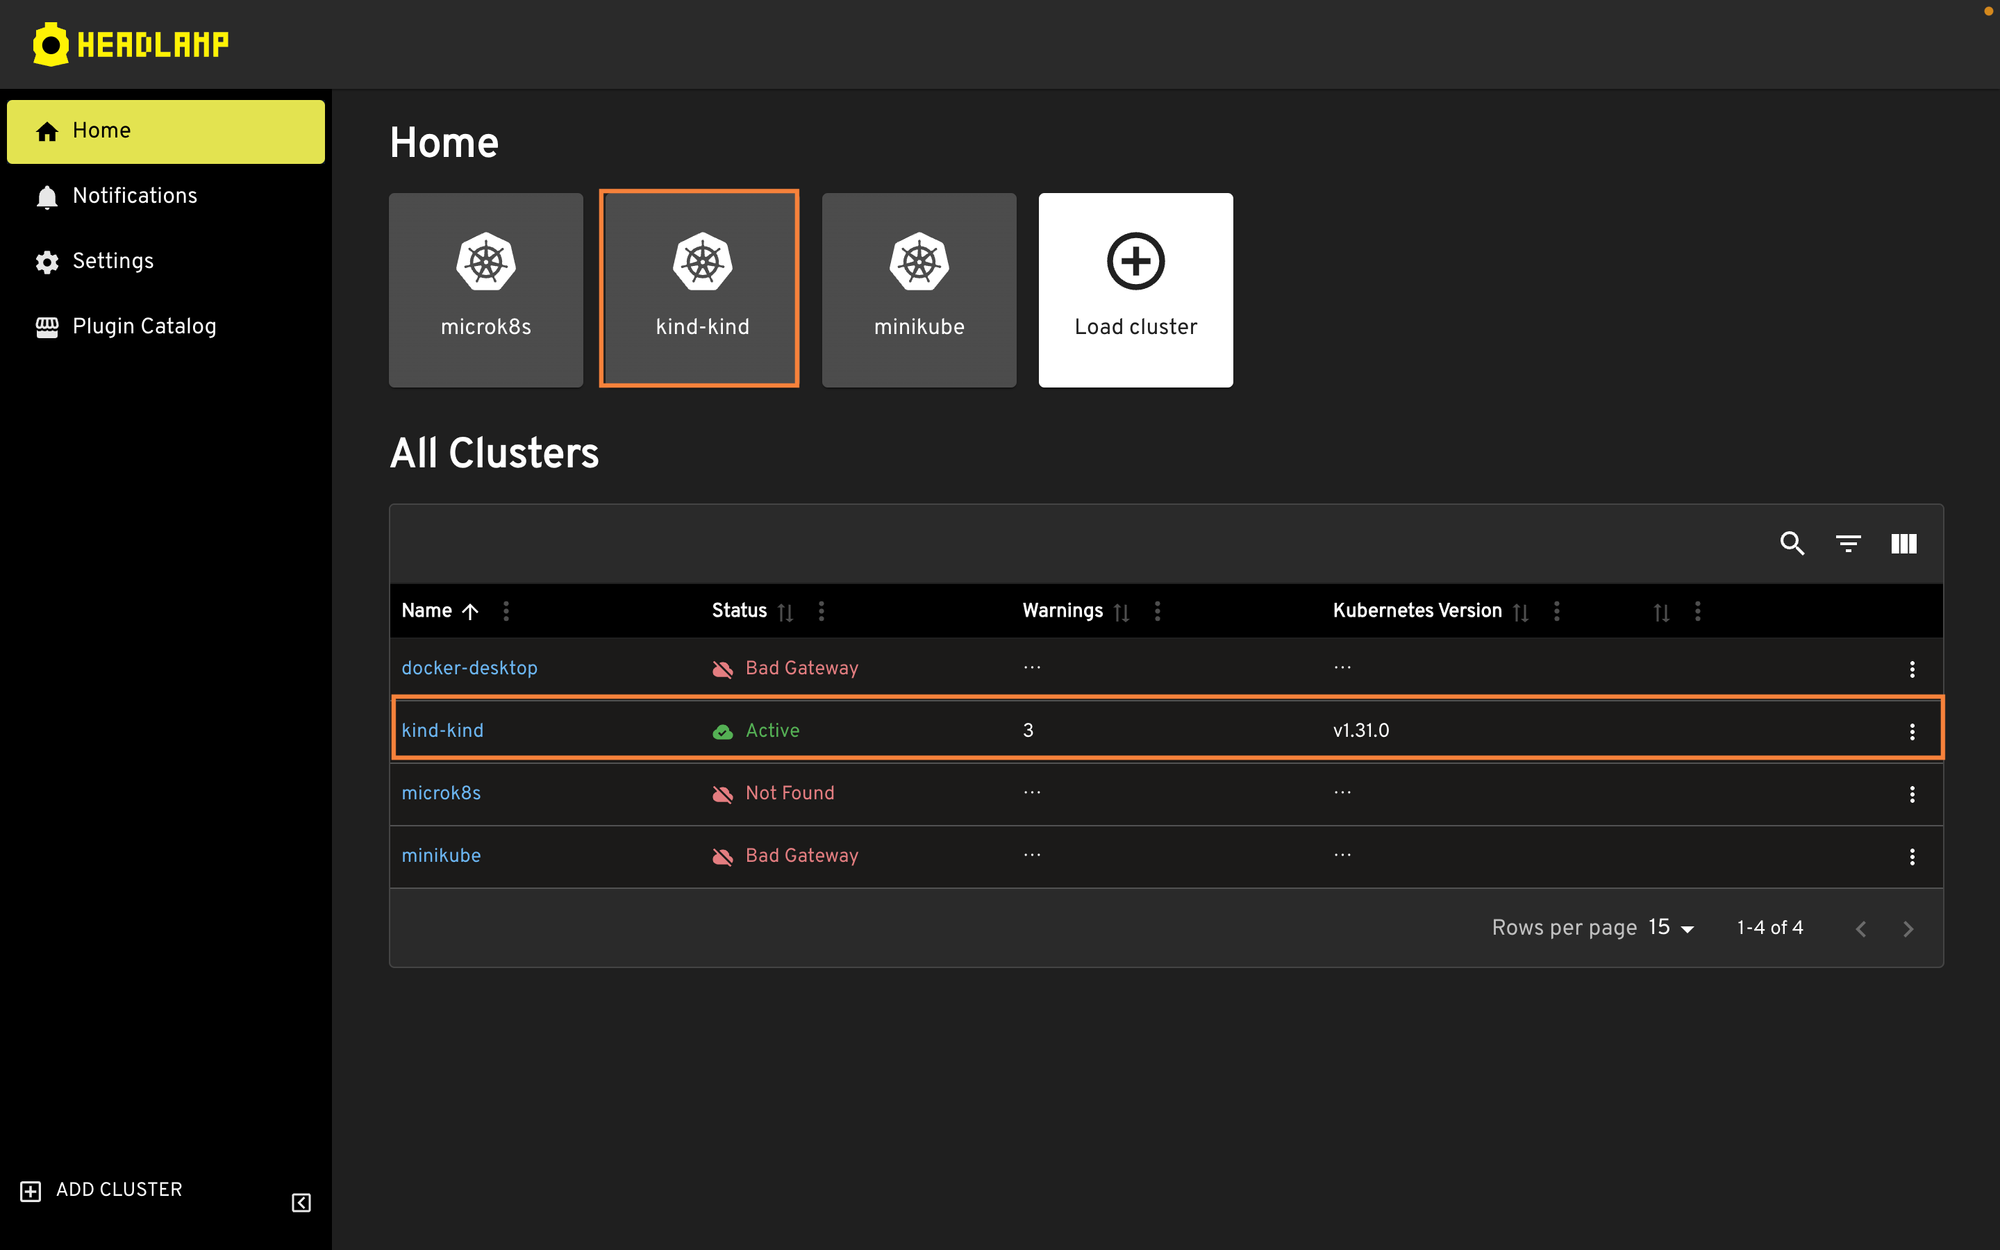
The first thing that Headlamp will ask you for, is to connect a Kubernetes cluster with it. Since Headlamp can run locally, it will scan your KubeConfig file to gather information about the clusters and connect to them. You can also pass in a custom kubeconfig file to connect to your Kubernetes clusters. Once the cluster is added to Headlamp, you can see the cluster status, the Kubernetes version as well as any warnings that the cluster might have.
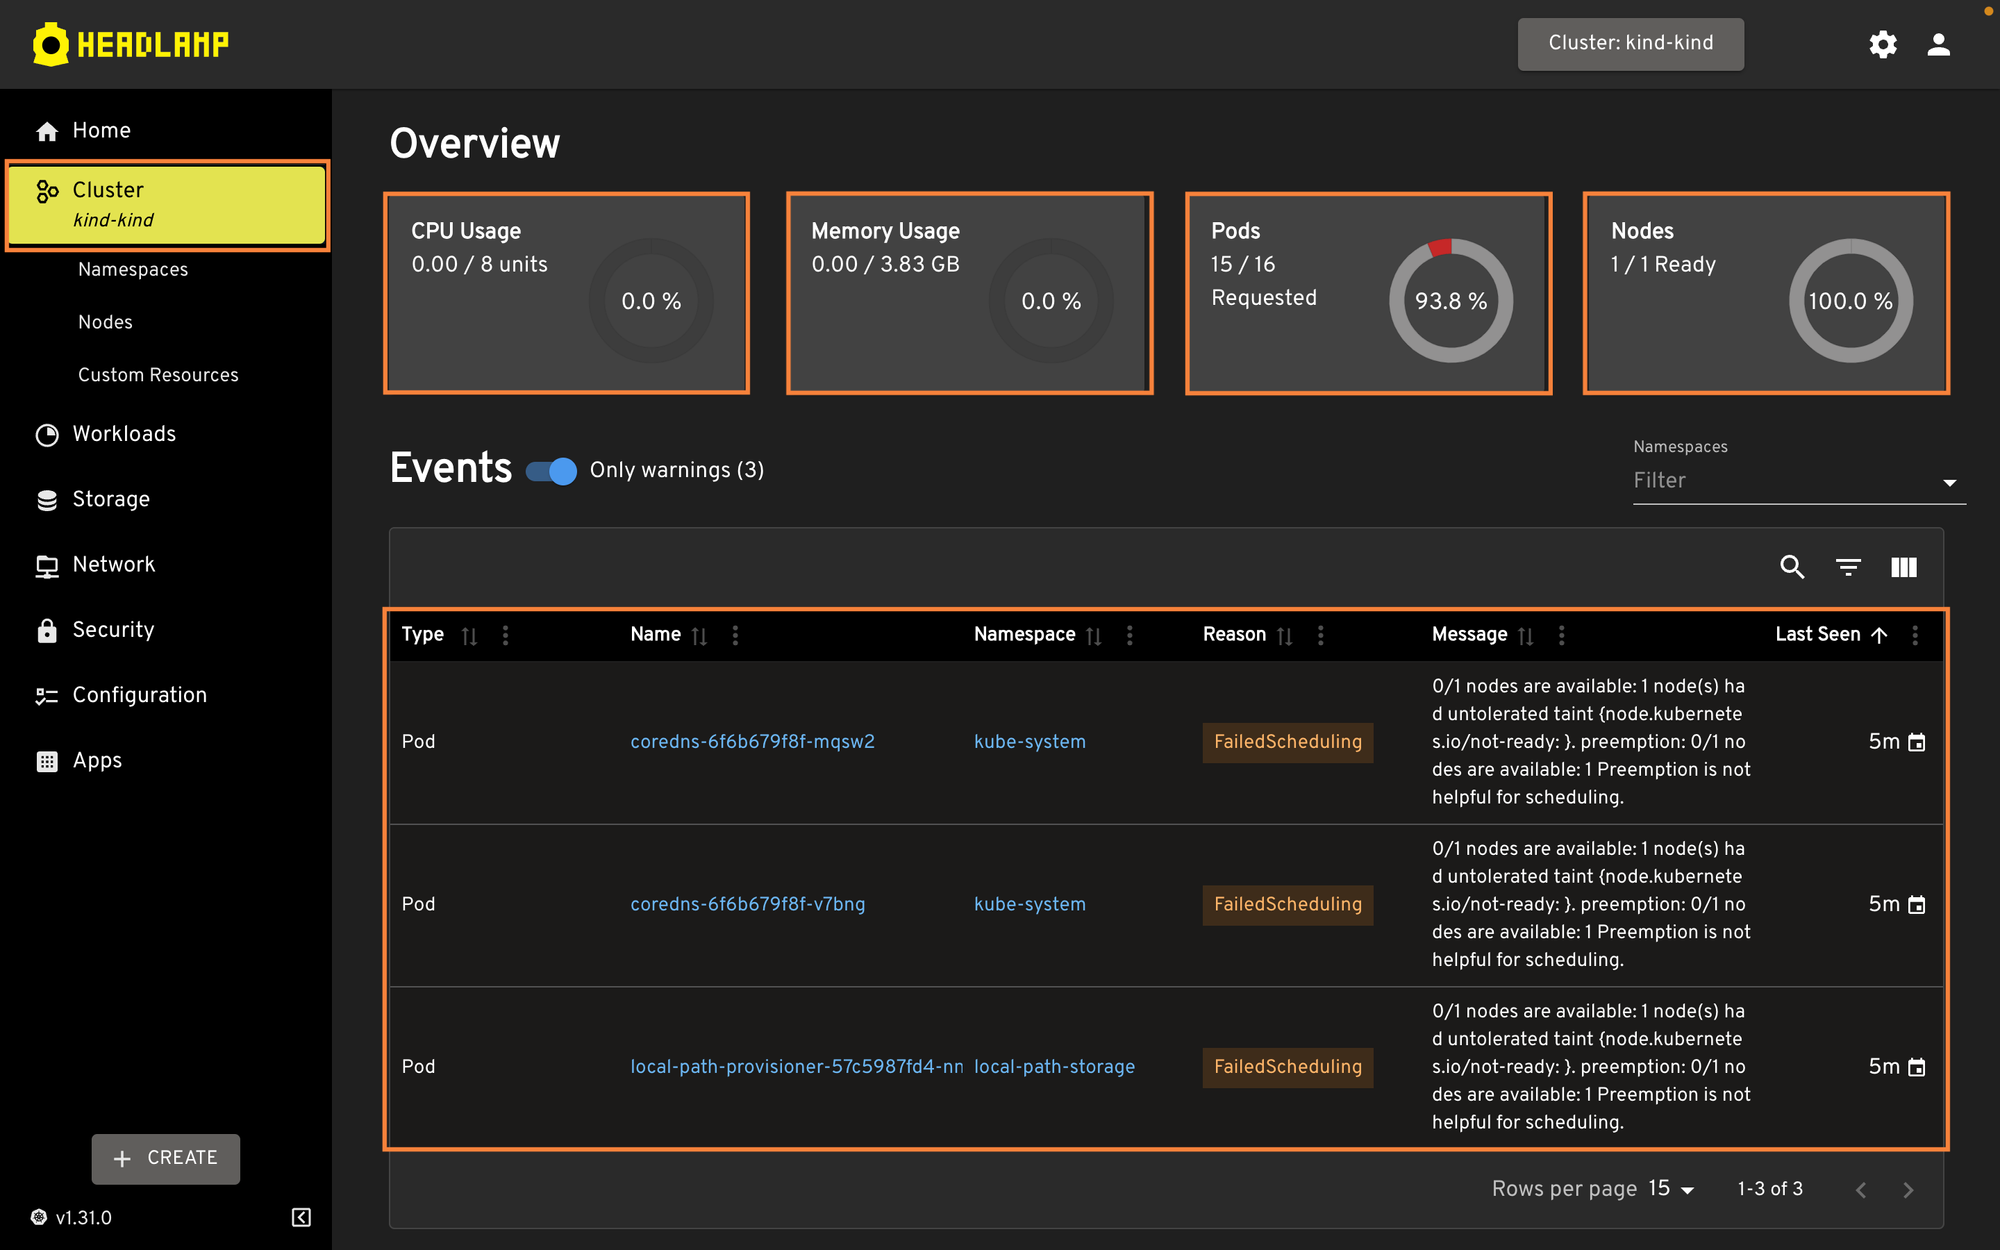
If you click on an individual cluster, you will be able to see some useful information related to the cluster as a whole such as CPU & Memory usage, the number of pods that are requested and the number of available pods, the number of nodes and the events that occur in the cluster. There are also comprehensive filter conditions for finding a specific event.
Headlamp also provides features for observing and viewing the Nodes within the cluster. It can show you information about the Node’s available and used resources, how long the node has been up, etc. You also get a look into all the pods that are scheduled on the particular node, along with the taints and labels added to the node.
Headlamp also provides some useful Node functions such as draining and cordoning the node which can prove to be useful when upgrading cluster versions. You can also edit the Node manifest and change some values as you see fit.
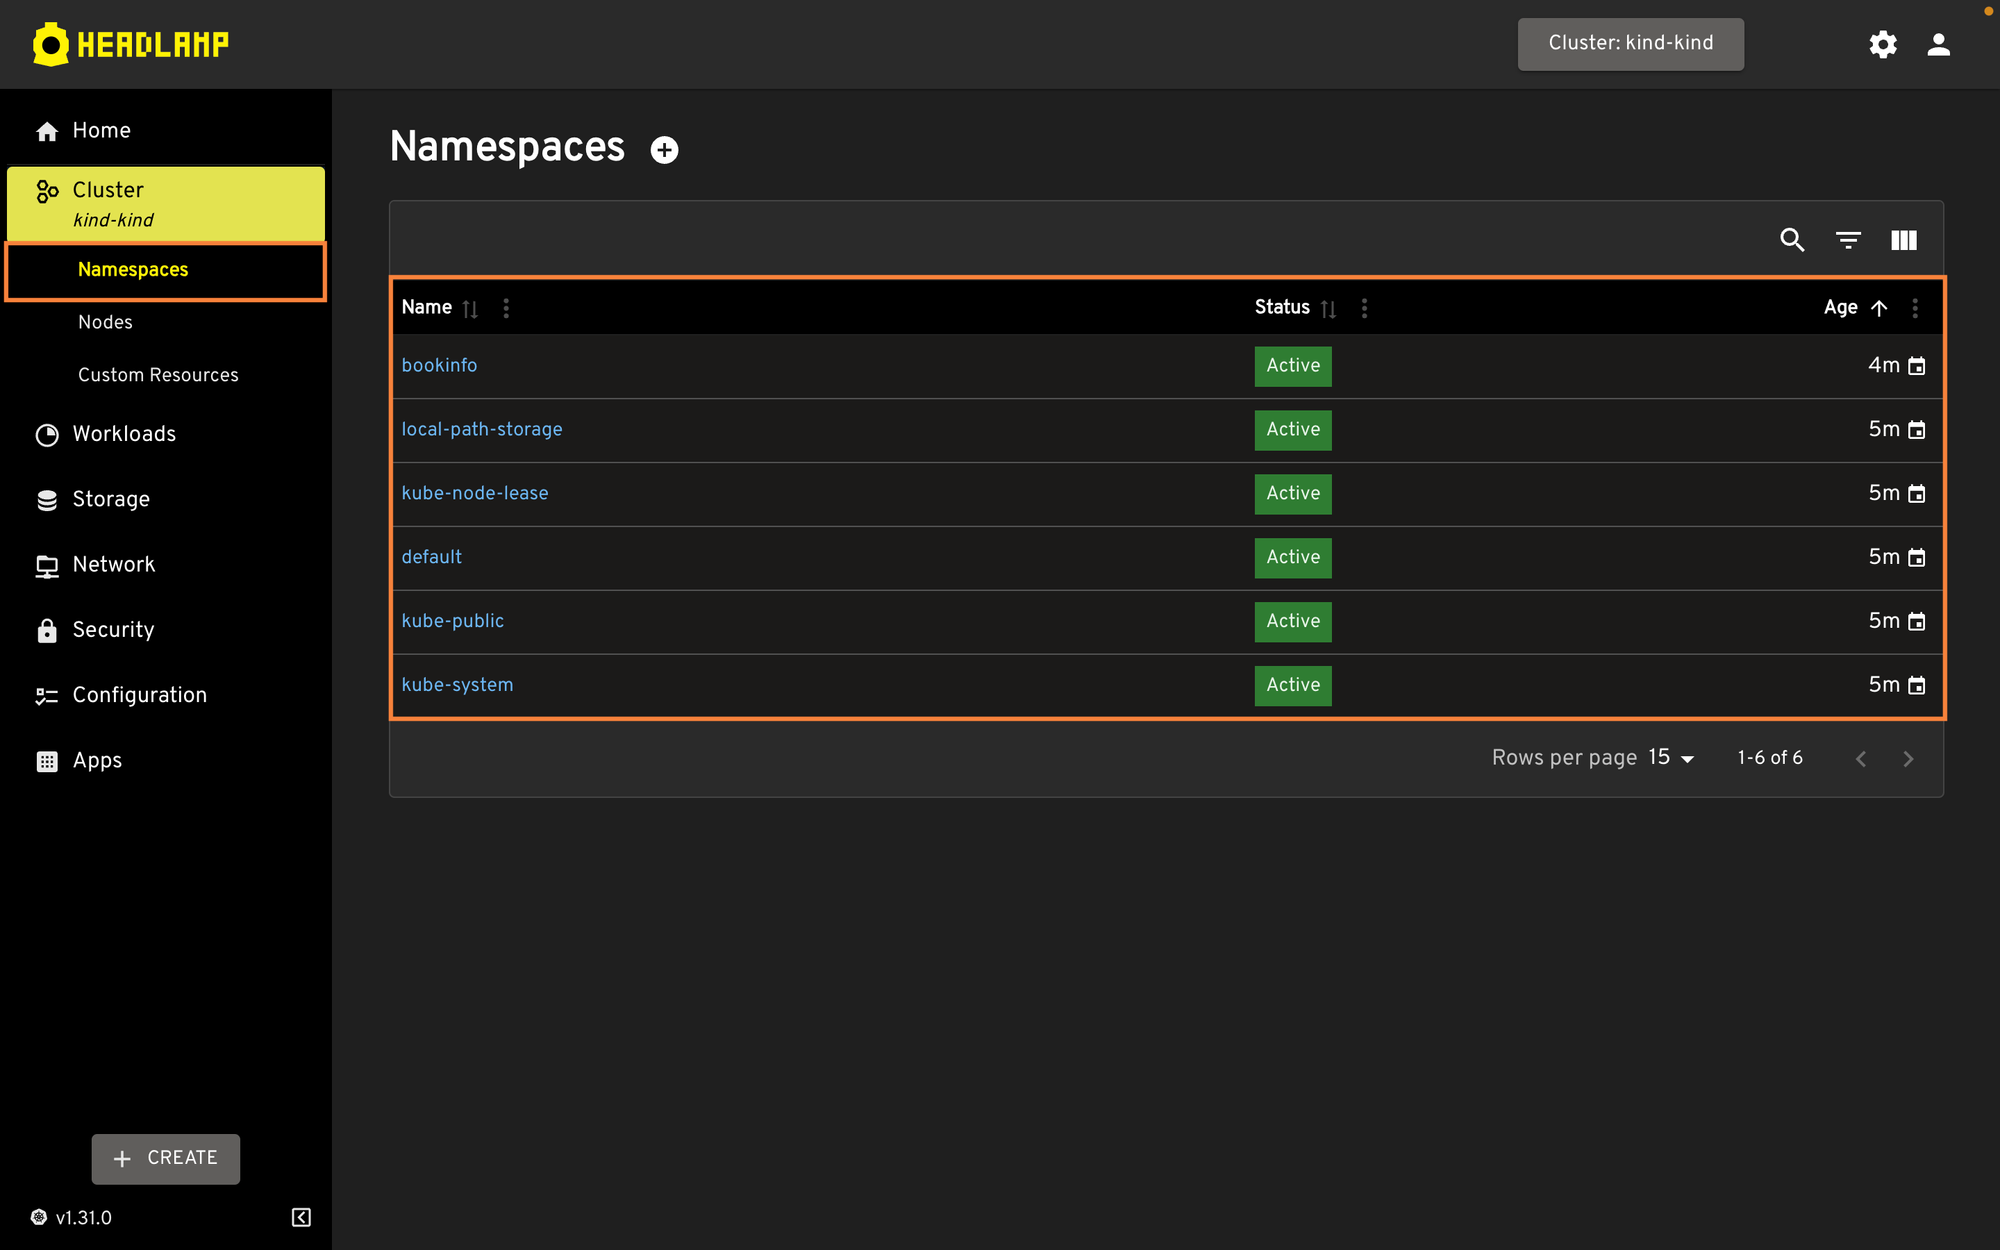
You can also see all the Namespaces that exist within the cluster, view their details, and edit the manifest if needed.
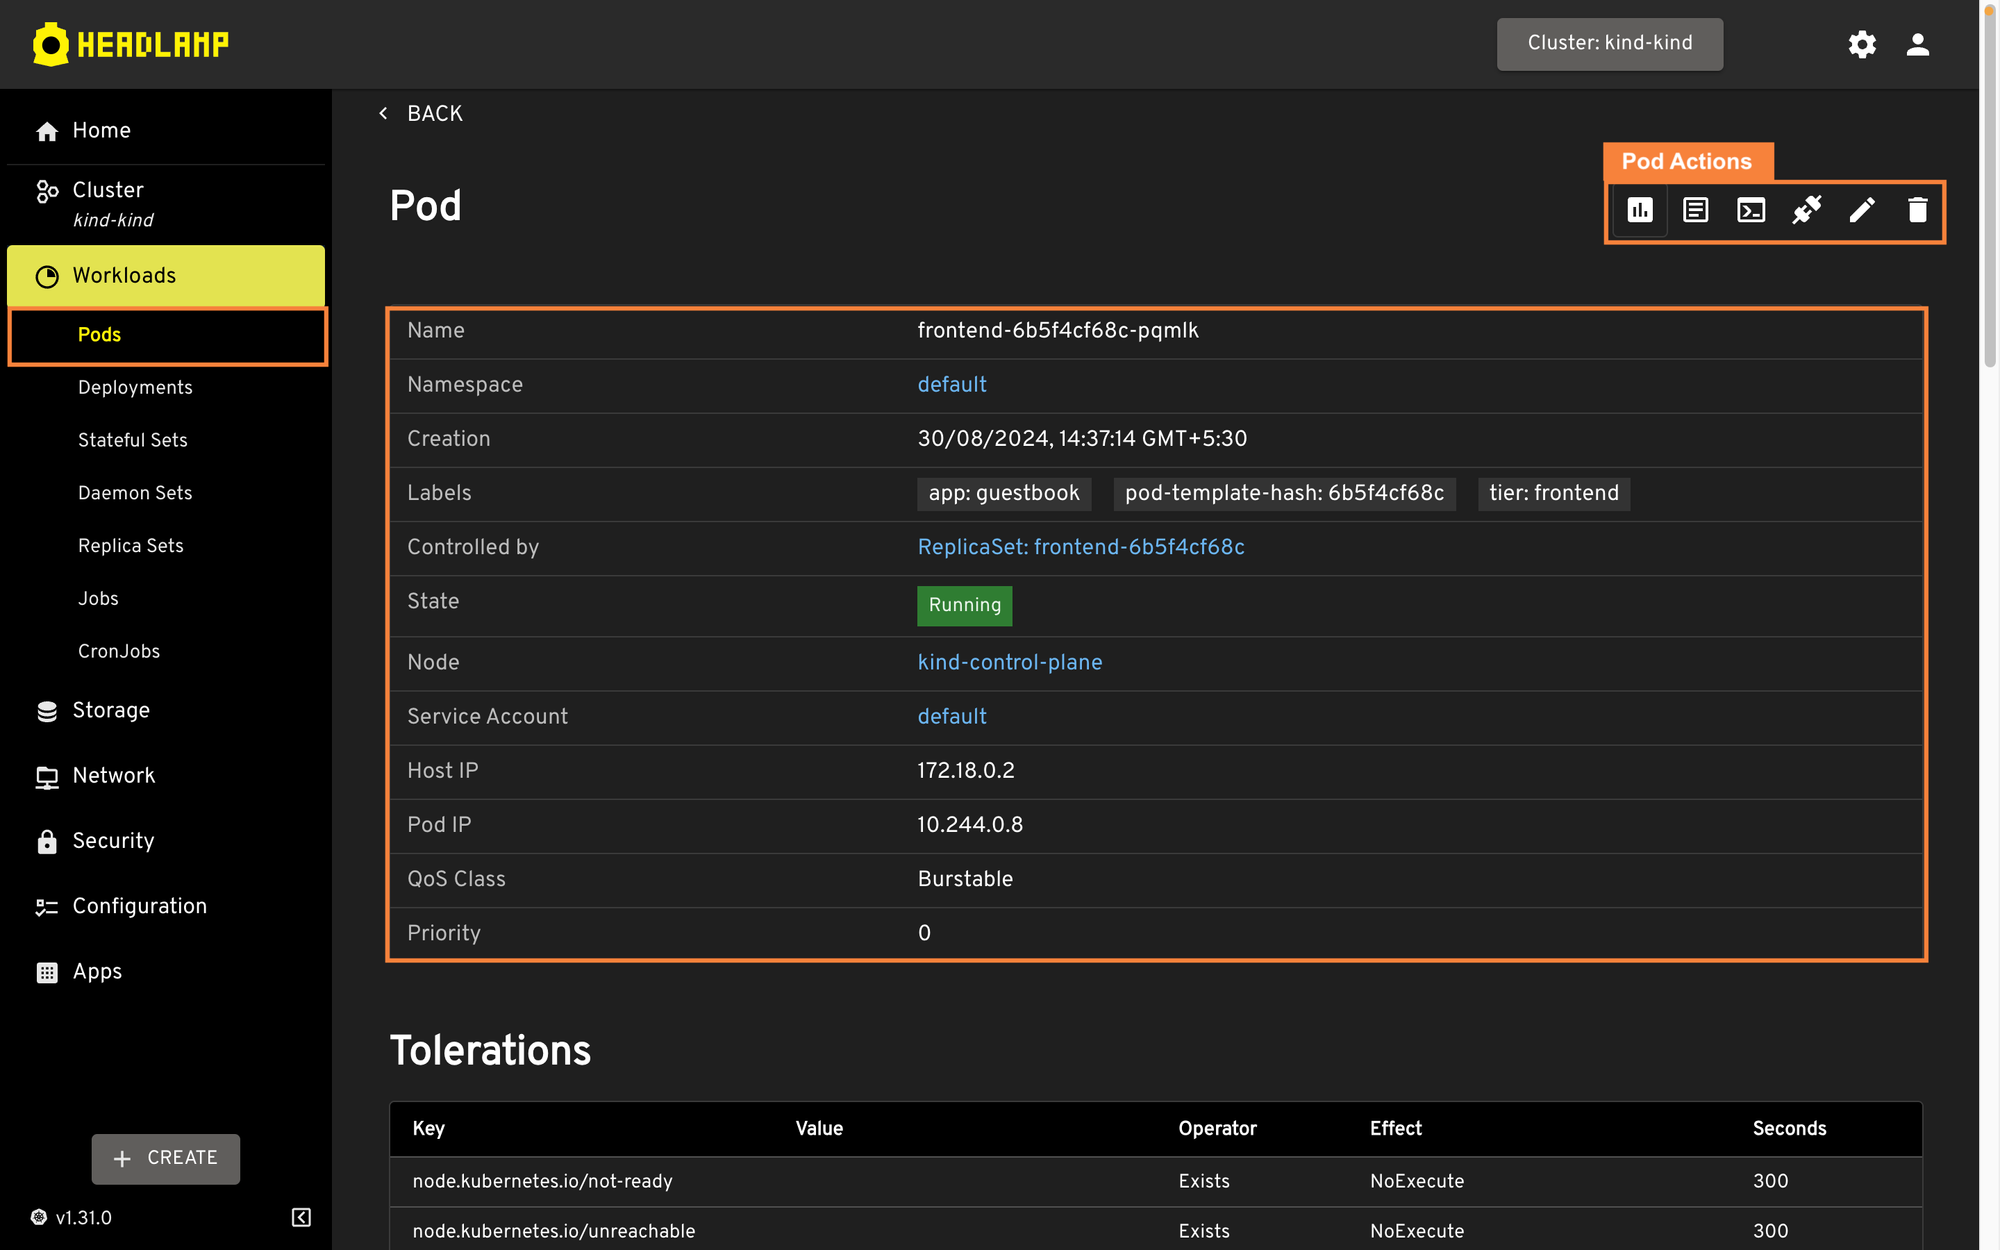
Within the workloads section of Headlamp, you are able to view the Pods, Deployments, StatefulSets, Daemon Sets, Jobs, and CronJobs. Within each resource type, you are able to see different details about it, the labels, tolerations, etc. Headlamp also allows you to directly port forward a pod, so you do not need to figure out the port numbers and run the port forwarding command manually.
Additionally, if you install the Promethus plugin, you are able to view the Promethus metrics for the pods. You can also check the logs, exec into the pod, and edit the pod manifest from the dashboard.
Cluster management in Devtron
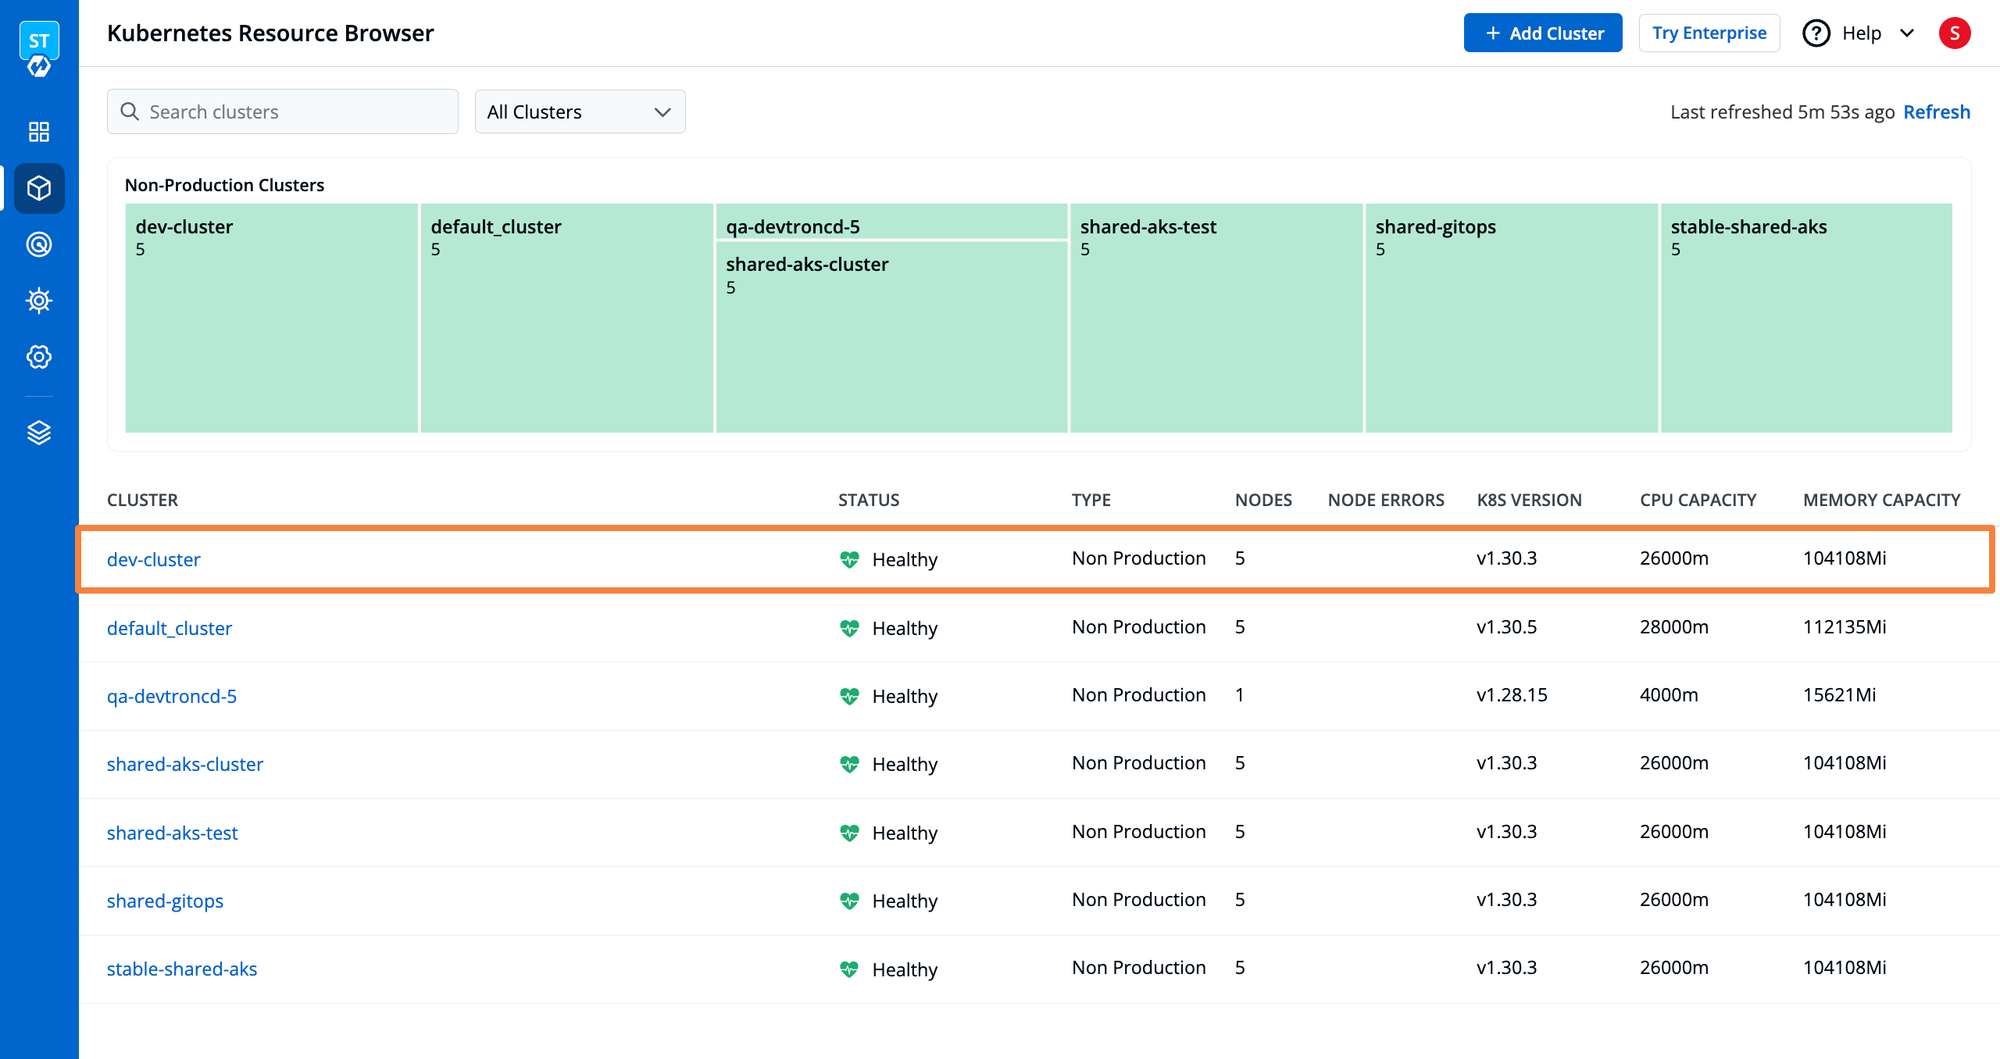
Devtron provides full visibility into the cluster through its Resource Browser. As the name suggests, it shows you a complete list of the resources within the cluster. As you can see in the below image, the resource browser has listed all the clusters connected to Devtron along with useful information such as CONNECTION STATUS, NODES, NODES ERRORS, K8S VERSION, CPU CAPACITY, and MEMORY CAPACITY of each Kubernetes cluster.
*Within the enterprise version of Devtron, you can also get a visualization of all the different clusters that are connected to the cluster.
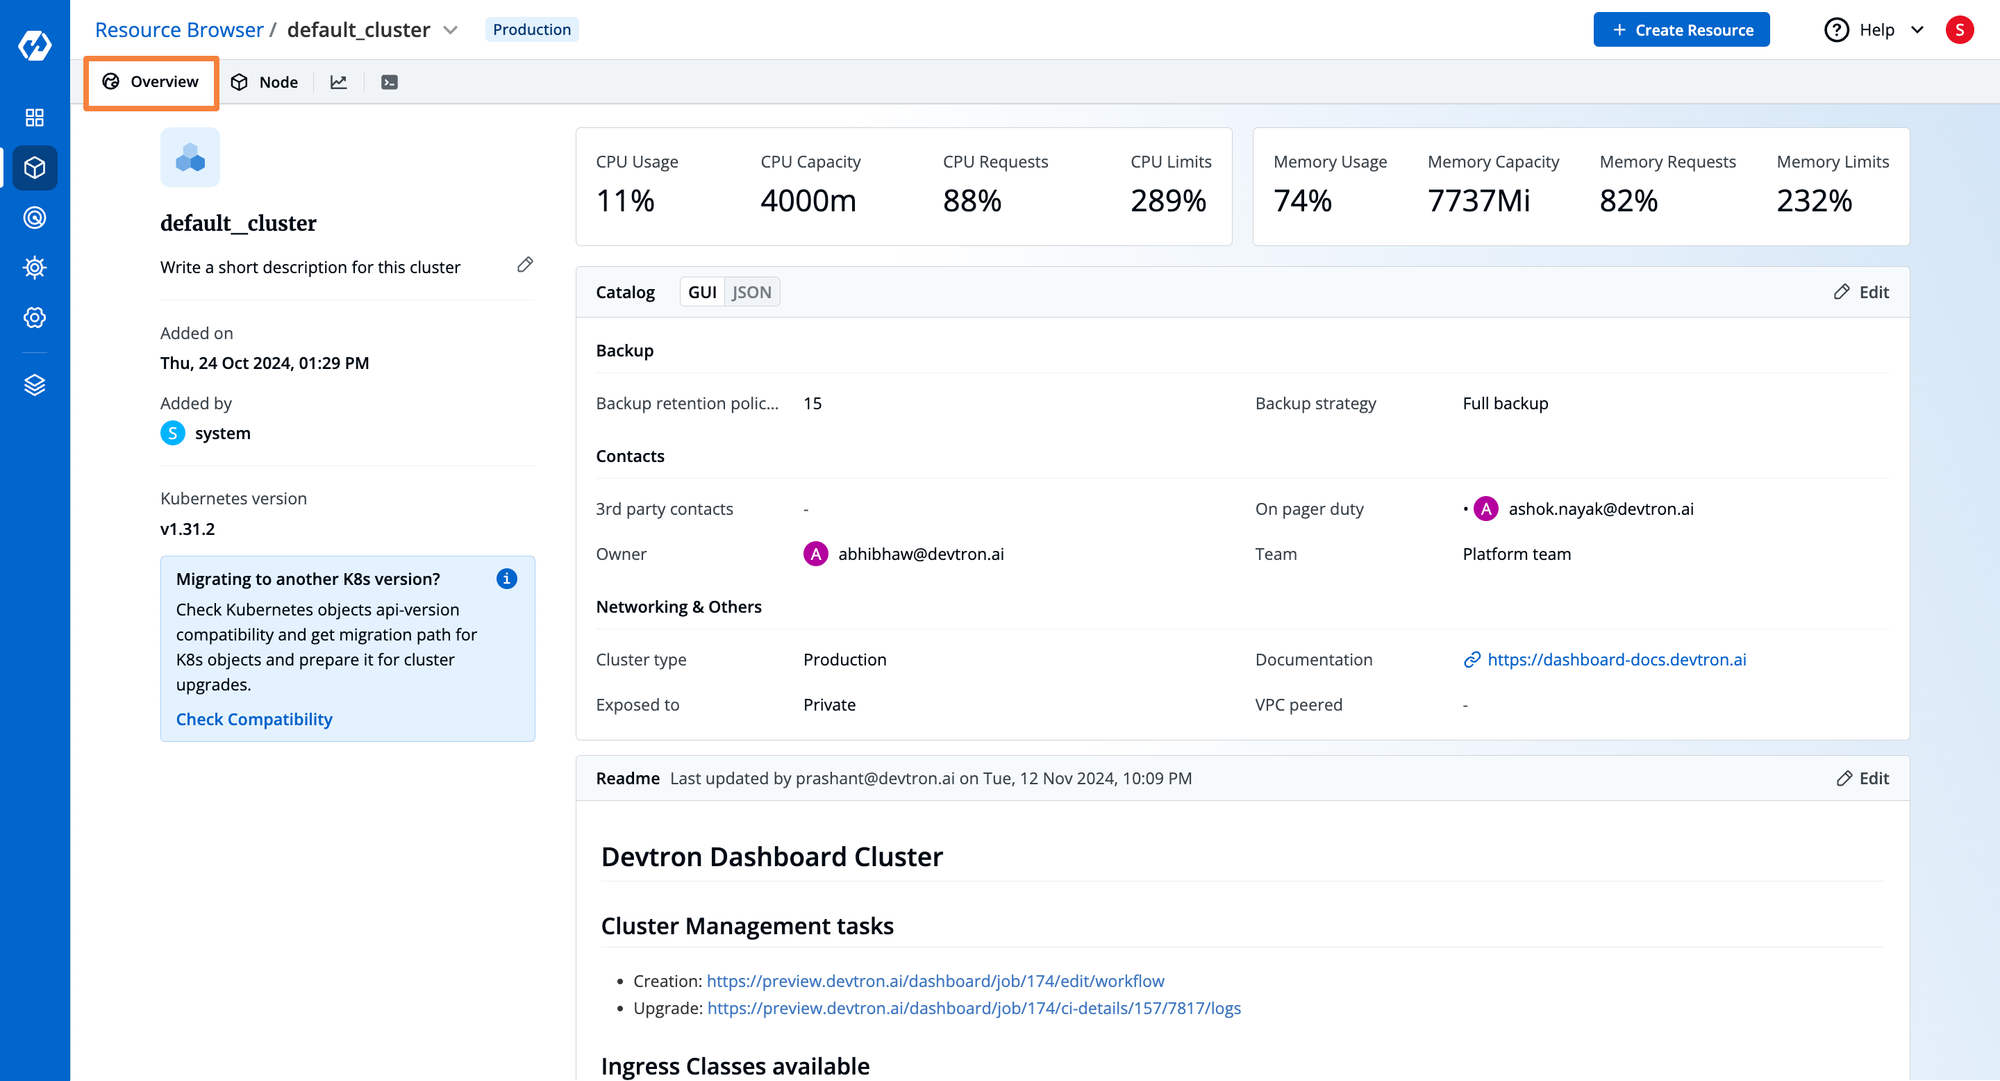
When navigating to each cluster you get an Overview of the selected Kubernetes cluster. You can visualize information about the utilization and availability of assigned resources, the owner of the cluster, and a Readme file where we can describe the cluster. The Readme attached to the Kubernetes cluster can help teams collaborate and understand the purpose and configuration of our cluster.
* The enterprise version of Devtron comes with additional features such as a catalog framework which lets you create a custom catalog that contains information about the cluster such as Cluster owners, backup strategies, etc. There is also an integration with silver-surfer which helps during Kubernetes cluster upgrades by showing the APIs with breaking changes.
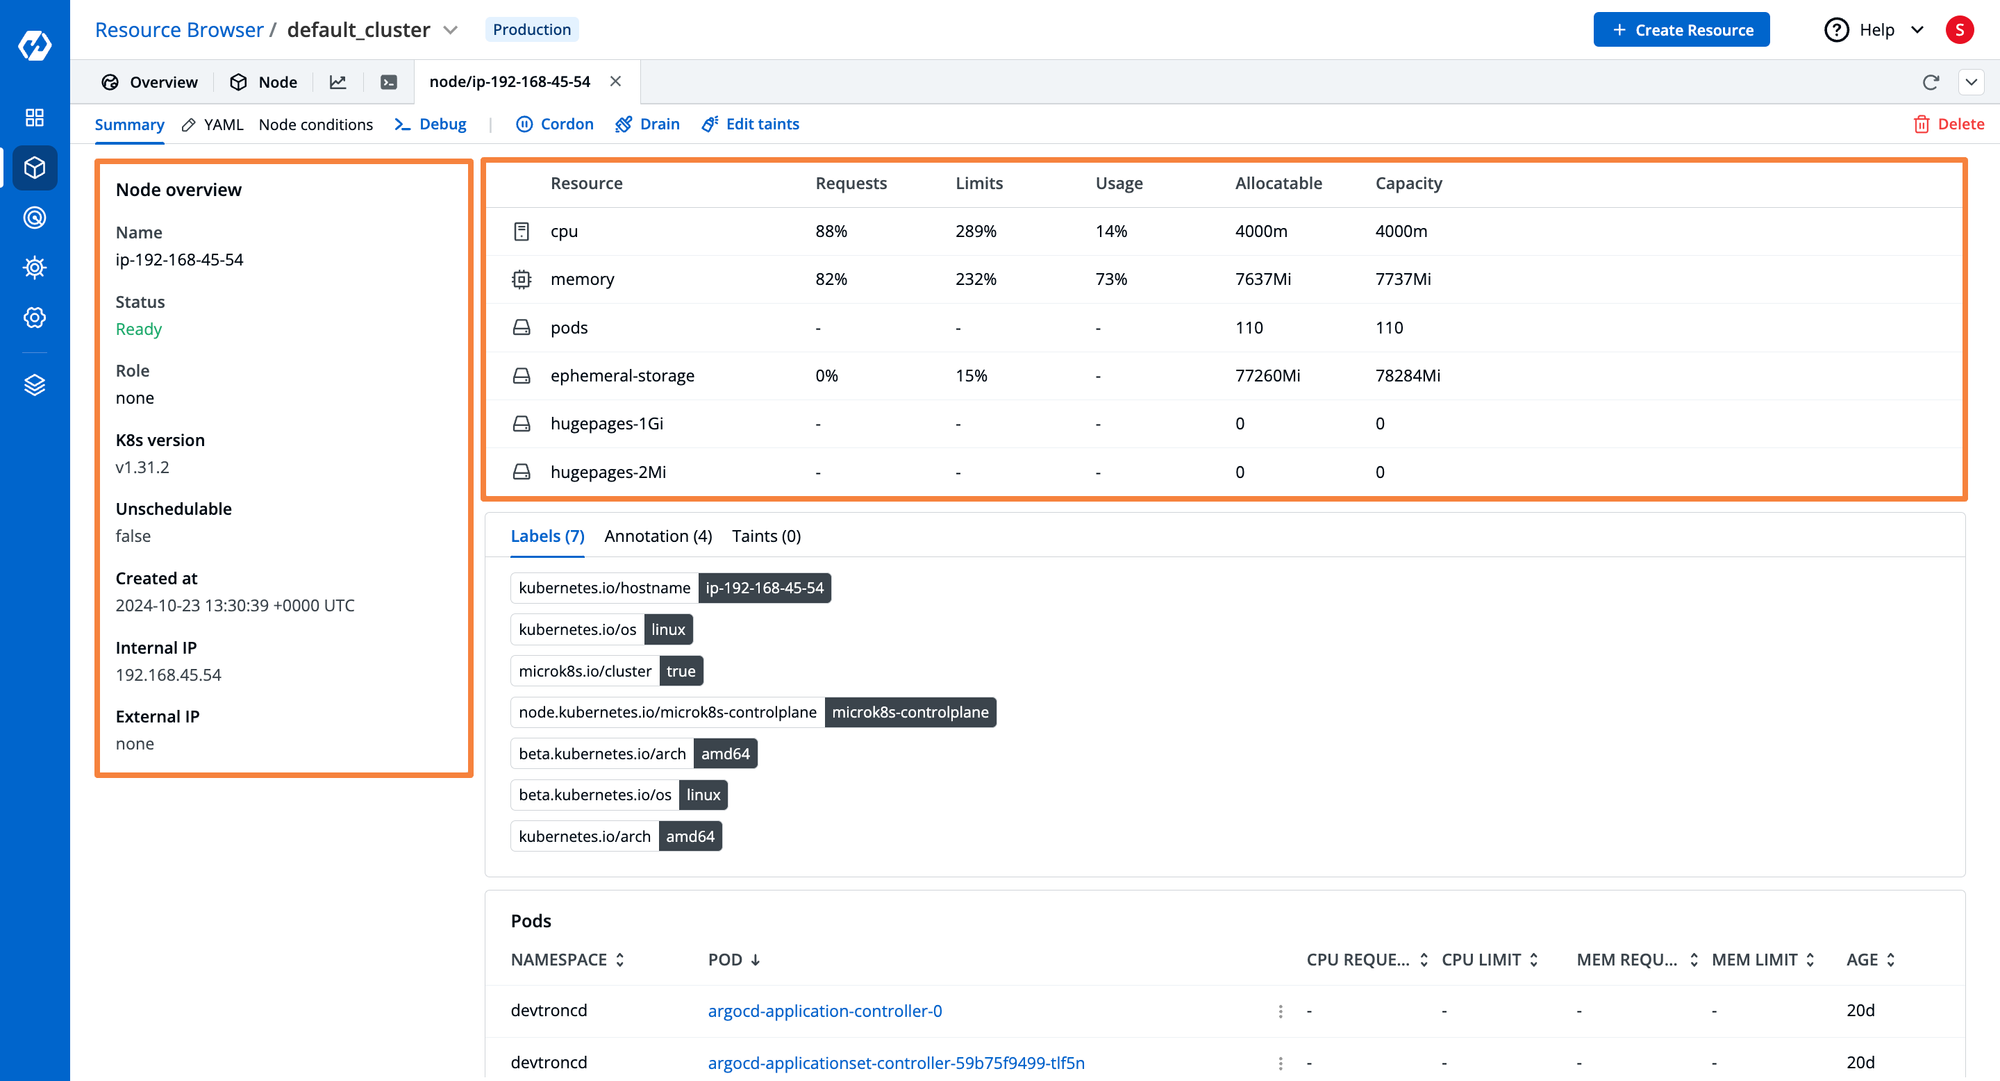
At the Node level of the Kubernetes cluster, Devtron’s Resource Browser allows executing essential operations like visualizing and editing live YAML manifest, viewing the Node Conditions, Debug (Devtron provides a dedicated terminal for each node), Cordon, Drain, Edit the taints, and Create & delete Resources.
Along with the above operations, the Node Overview tab shows resource consumption by the node, along with the pods running on the specific node.
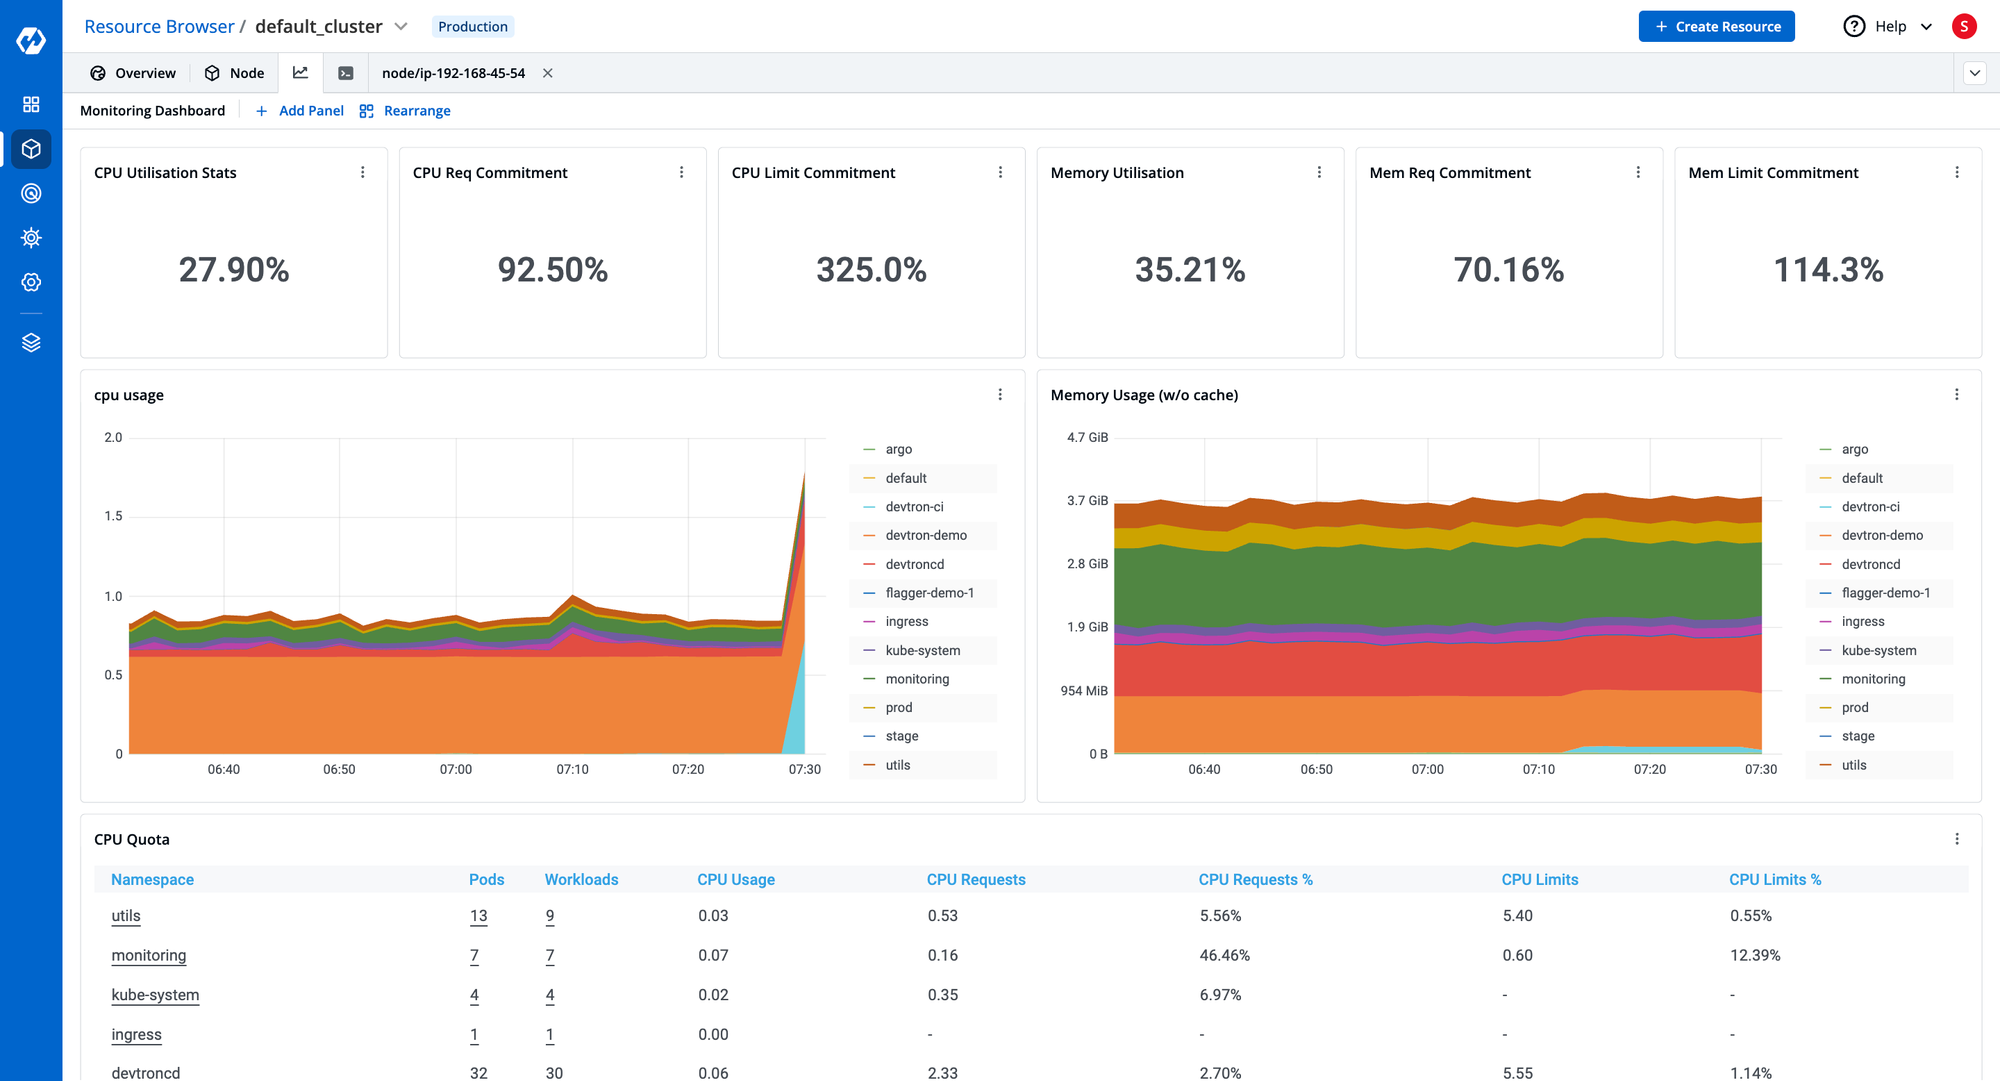
Devtron’s Kubernetes dashboard also has a fully customizable monitoring dashboard. This dashboard can be used to fetch and visualize custom metrics from Prometheus and Grafana dashboards. The layout can be customized as you wish, and the metrics are embedded using iframes.
The Namespace tab of Devtron’s Resource Browser lists out all namespaces from specific Kubernetes clusters. It allows us to perform actions over the namespace like visualize and edit live Manifest, check for namespace events, and Delete namespace.
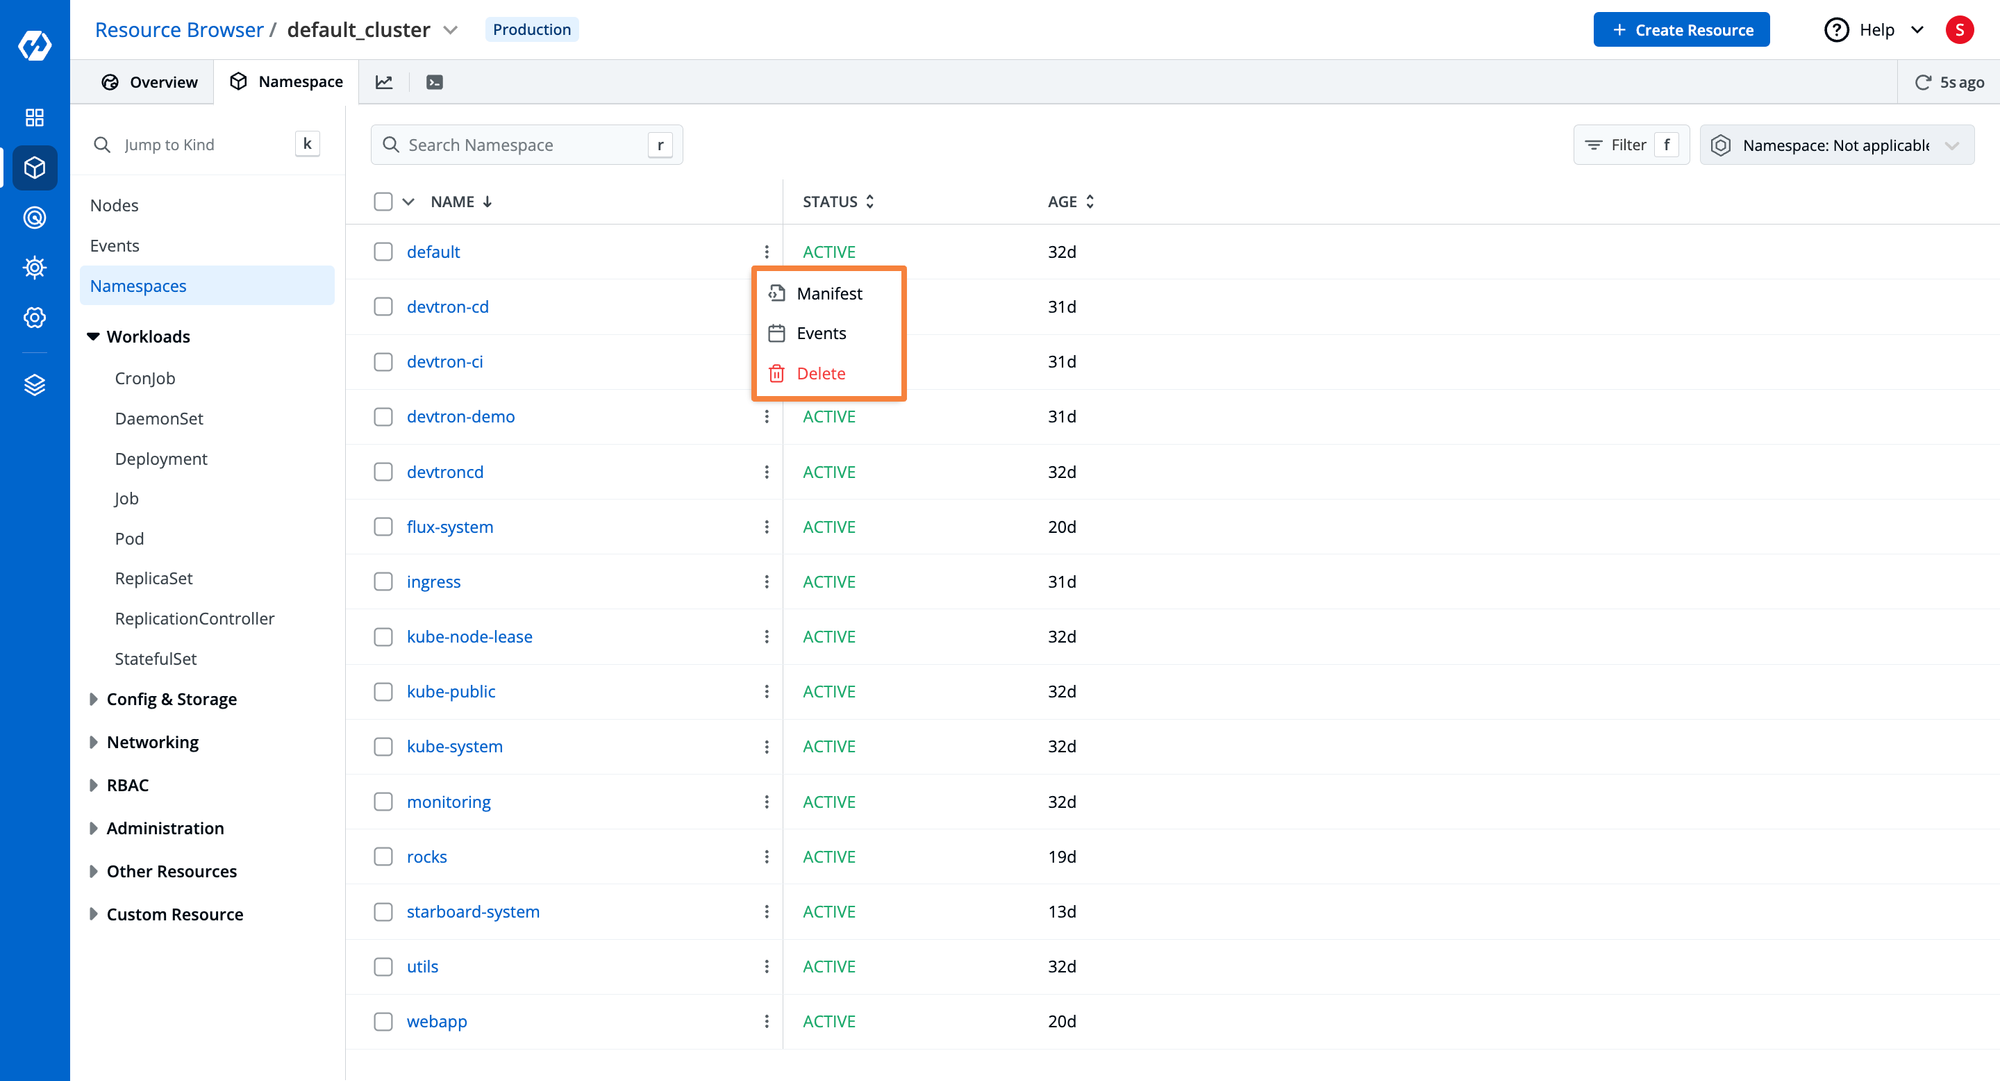
The Resource Browser of Devtron provides a lot more capabilities compared to Headlamp. Unlike headlamp where we can only exec inside the running pod, Devtron can launch a cluster-wide terminal within which you can run kubectl commands, without leaving the Devtron dashboard. This helps reduce context switching. Within Headlamp, you constantly need to context switch to a CLI for performing any kubectl operations.
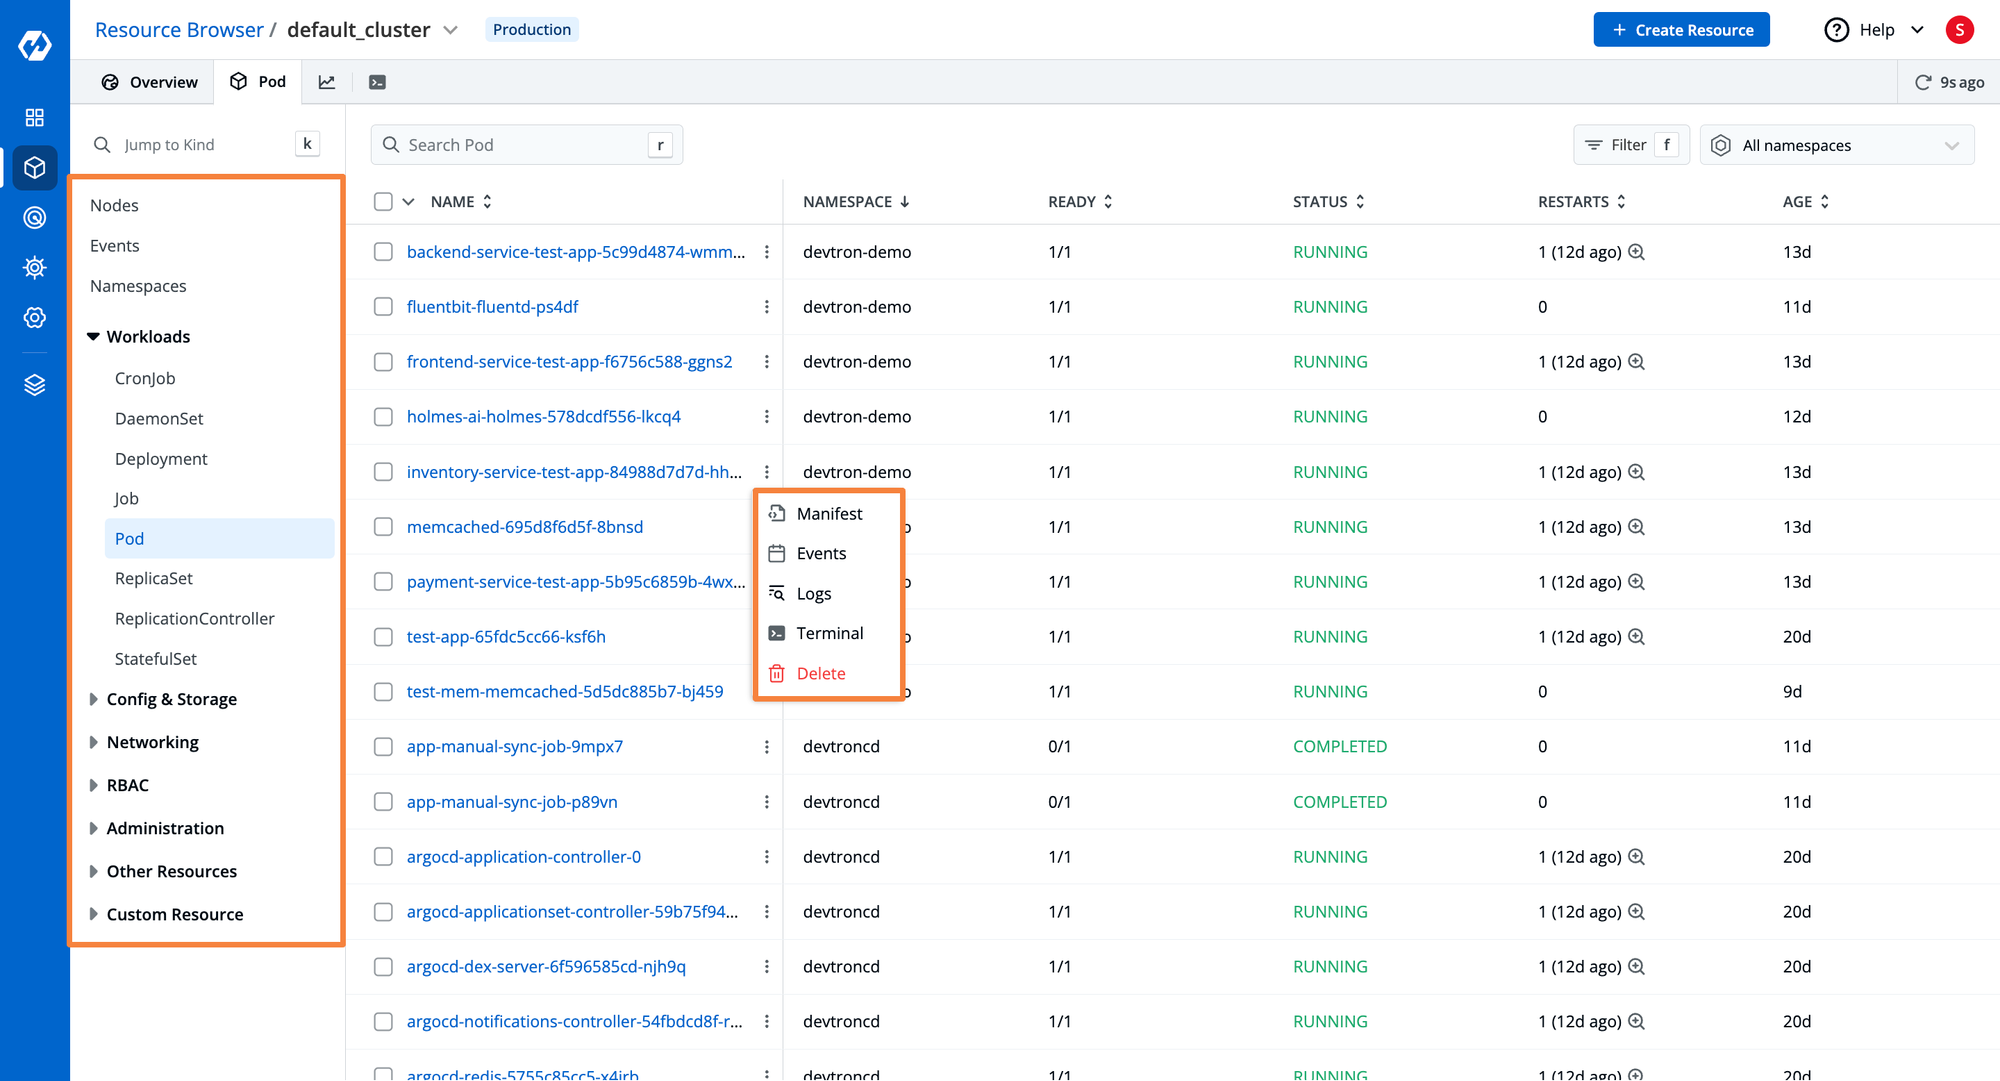
The Resource Browser of Devtron lists out all the workloads with visibility for their namespace, current status, restarts, IP, and node. The Resource Browser has a logical separation of different Kubernetes resources. As an example, the workloads category consists of K8s objects like CronJob, DeamonSet, Deployment, Job, Pod, ReplicaSet, Replication Controller, and StatefulSet. Other resources of the Kubernetes clusters are being listed accordingly under categories like Config & Storage, Networking, RBAC, Administration, Other Resources, and Custom Resources.
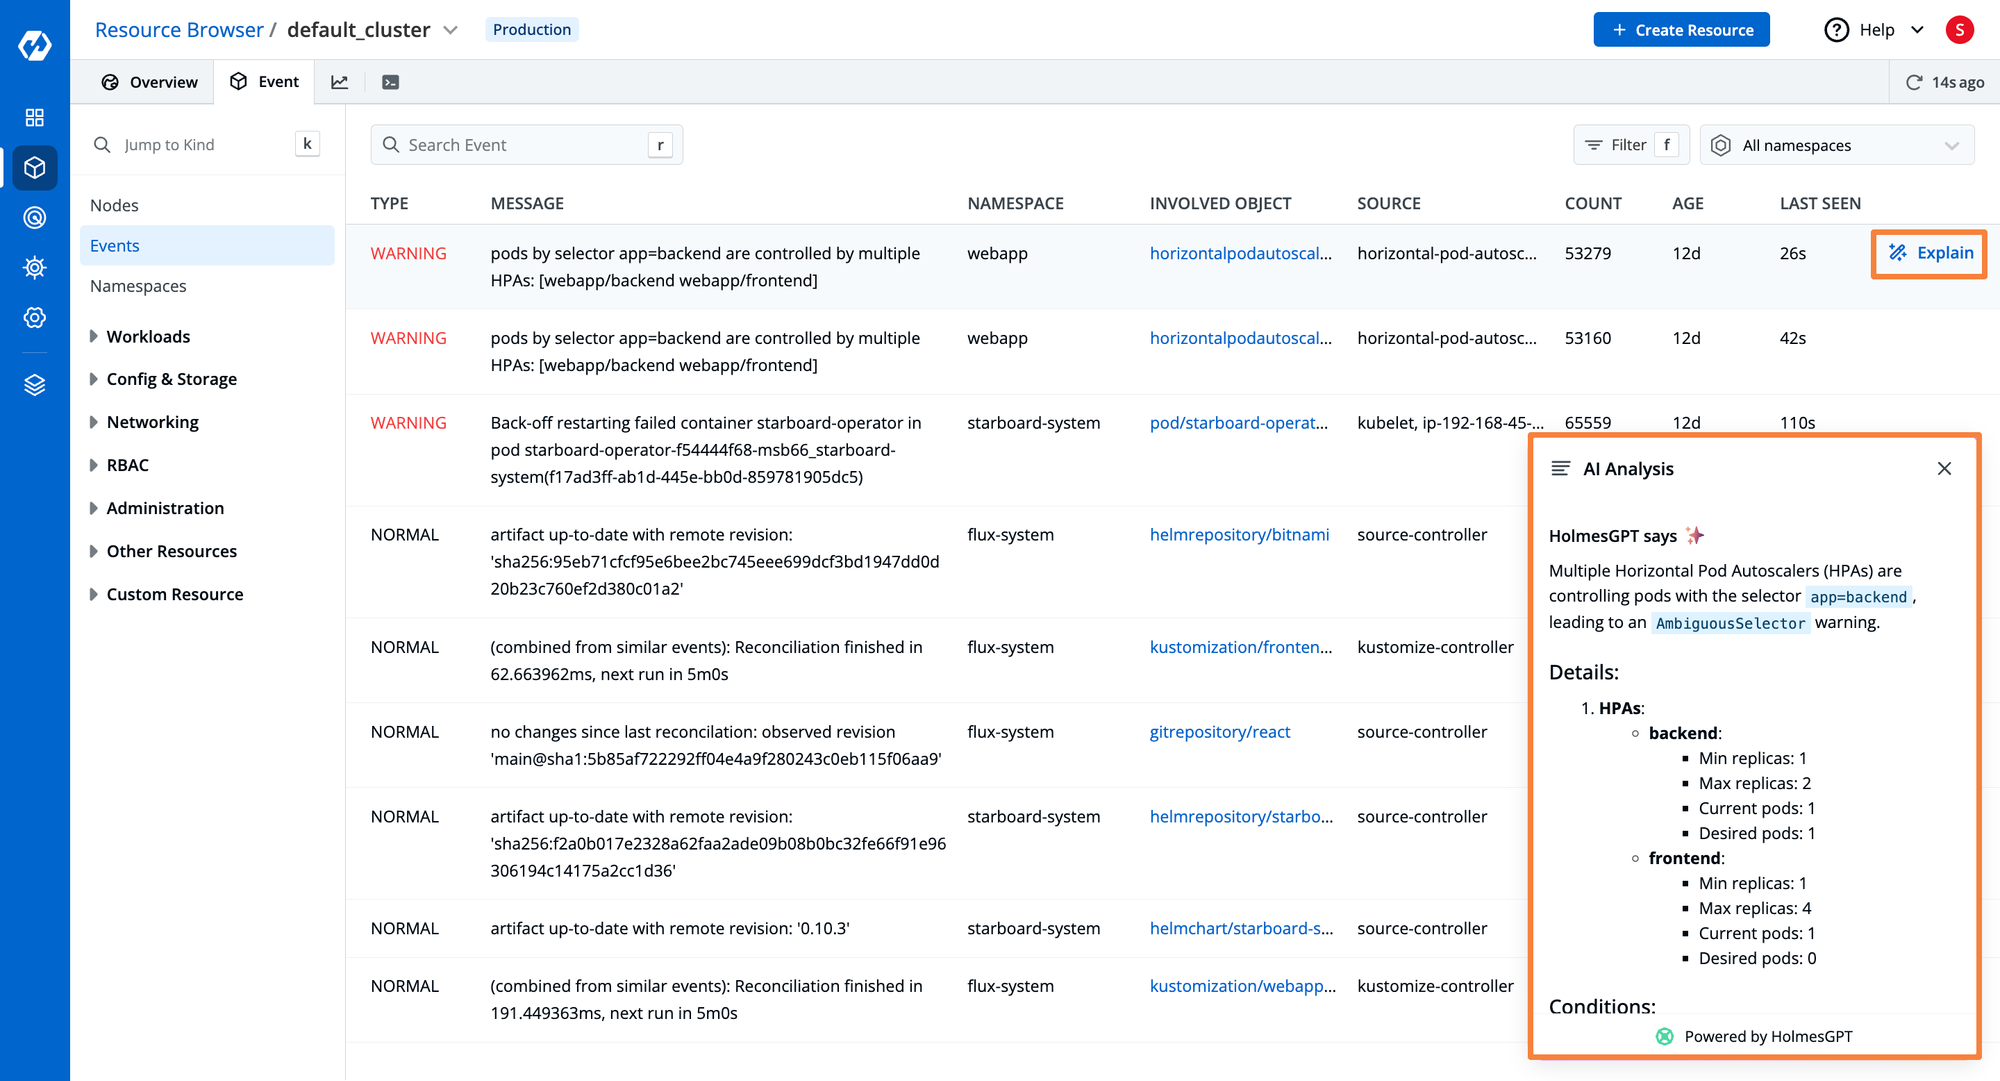
When debugging any cluster events, it can often get tricky to understand the problems that are occurring and what can be the action steps to resolve the problem. Devtron has a built-in AI tool that will analyze the events and help you gain actionable insights into warnings and error events.
On Workloads like Pods, it is possible to execute actions like visualizing and editing live Manifest, checking Events and logs, and exec into a particular container running in the pod. When you exec, you have the option to select the particular shell that you want to use and are familiar with.
| Capability | Devtron | Headlamp |
|---|---|---|
| Multi-Cloud & Multicluster Management | ✅ | ✅ |
| Terminal Support for Kubernetes Nodes | ✅ | ❌ |
| Real-time Logs | ✅ | ✅ |
| Support for the custom image to use tools like k9s, netshoot, busybox, and kubectl, for debugging | ✅ | ❌ |
| Dedicated Panel for Cluster Resource Monitoring | ✅ | ✅ |
| Preconfigured RBAC Access Management | ✅ | ❌ |
| Resource Grouping of all K8s resources present in Cluster | ✅ | ✅ |
Kubernetes Application Management
After deploying your applications to Kubernetes, it is quite difficult to manage all the running applications, especially when applications are deployed across multiple clusters. When debugging an application, teams often struggle with multiple CLI tools, which is an error-prone process and poses the risk of potential downtime and misconfigurations.
A Kubernetes dashboard is expected to provide some capabilities for managing applications and gaining better visibility into application workloads, simplifying application configuration, and providing troubleshooting capabilities.
Application Management with Headlamp
Headlamp does not have any robust features for managing application workloads. You can visualize all the running pods, deployments, secrets, volumes, etc, but there is no way to determine what application these resources are related to.
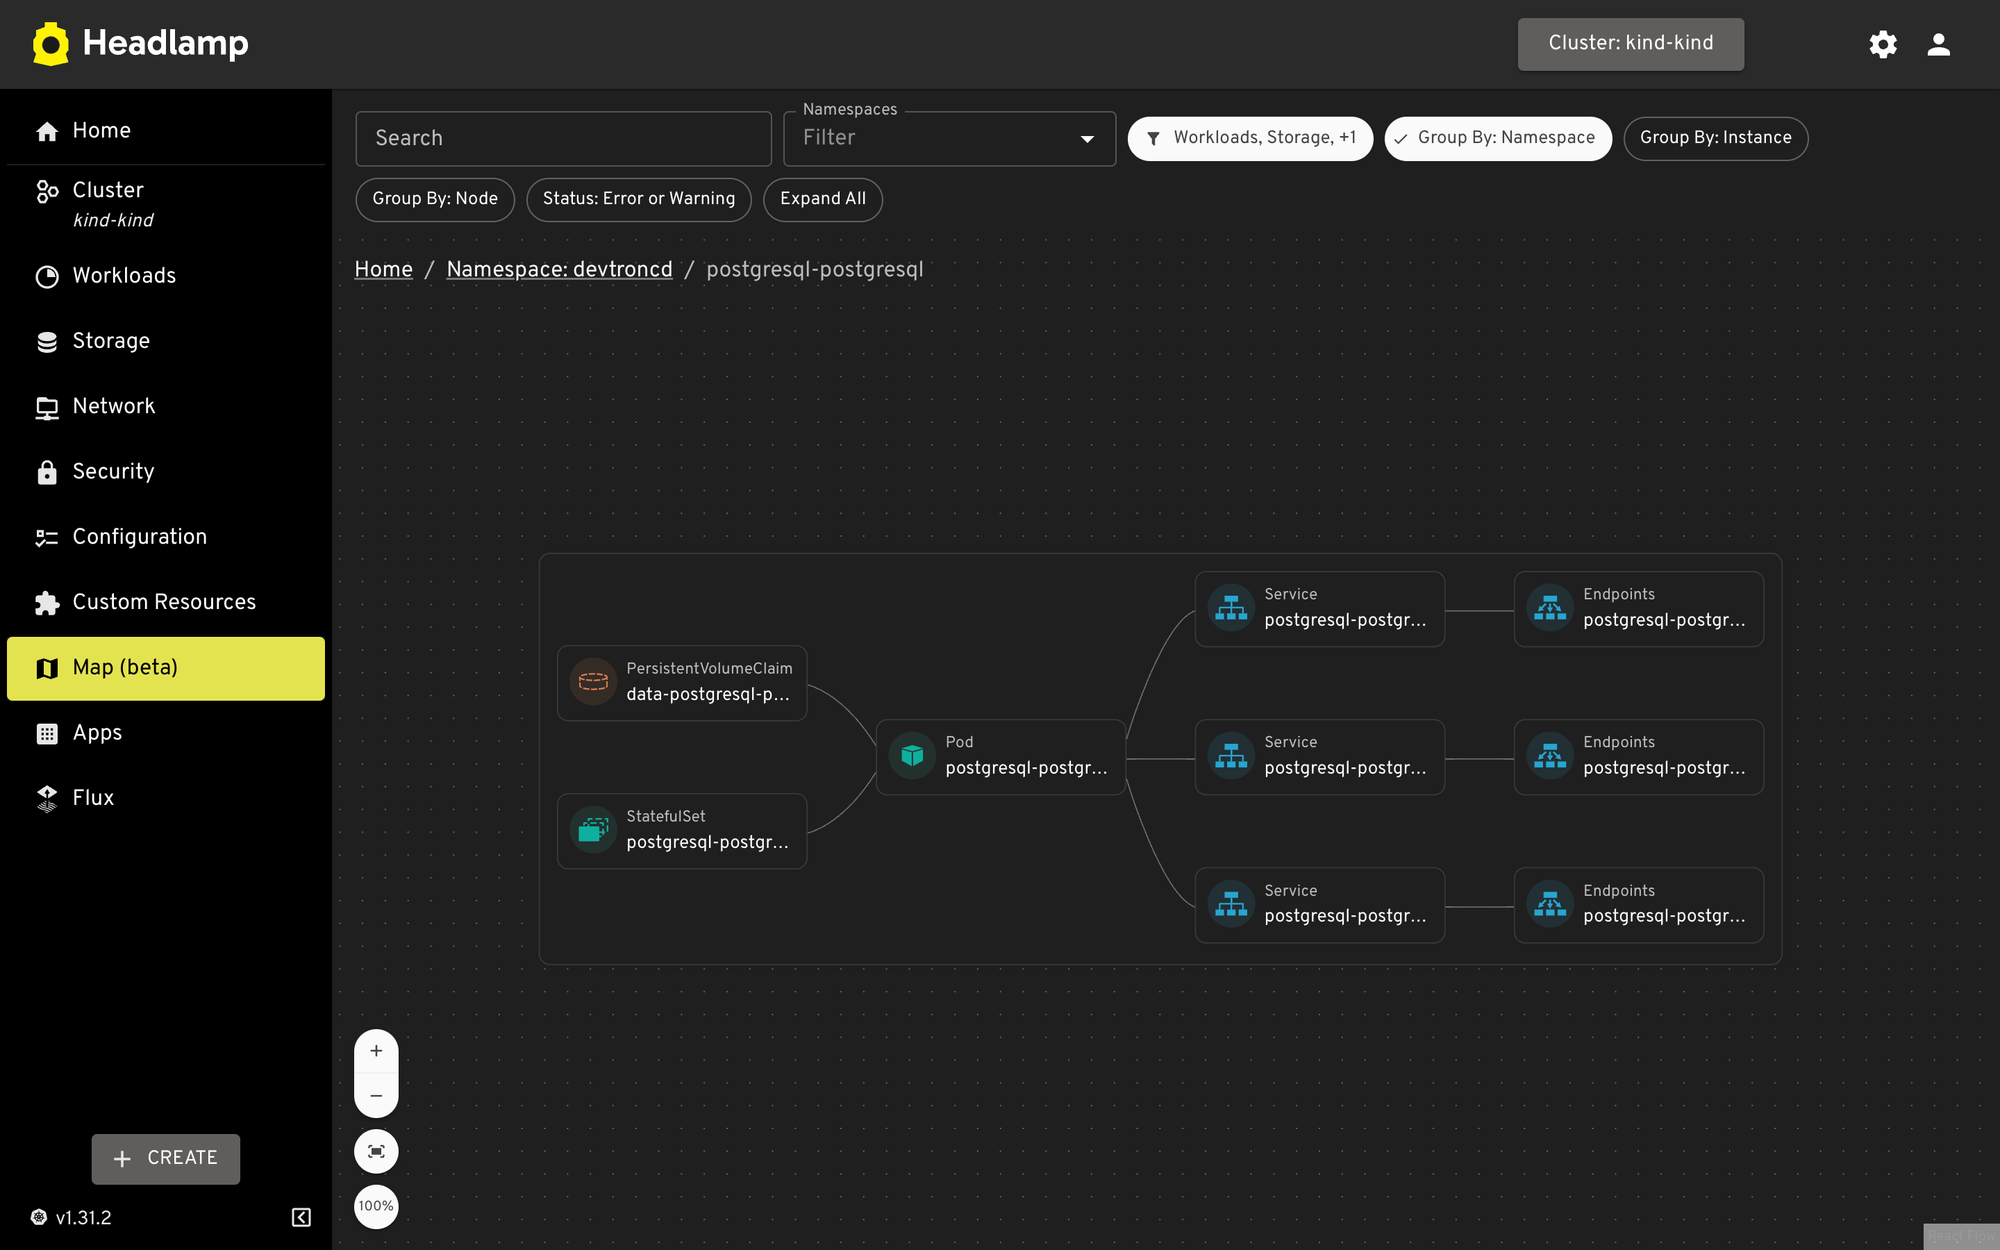
The headlamp does have a resource map which helps to visualize how different resources are connected. It can show the connection between different pods, and services and the persistent volumes that are being mounted to the pod. This helps visualize the resources of the application. It does however fall short in a few places. For example, it does not show the connections of configuration resources such as secrets, config maps, assigned service accounts, or the roles and role bindings.
To view these resources, you would be required to navigate through the pod’s manifest file, see which service account is being used, and navigate to it from the security tab.
Furthermore, when creating a new version of a resource, a deployment for example, Headlamp does not display the history of previous versions. Being able to view the manifest of a previous deployment would be useful when rolling back.
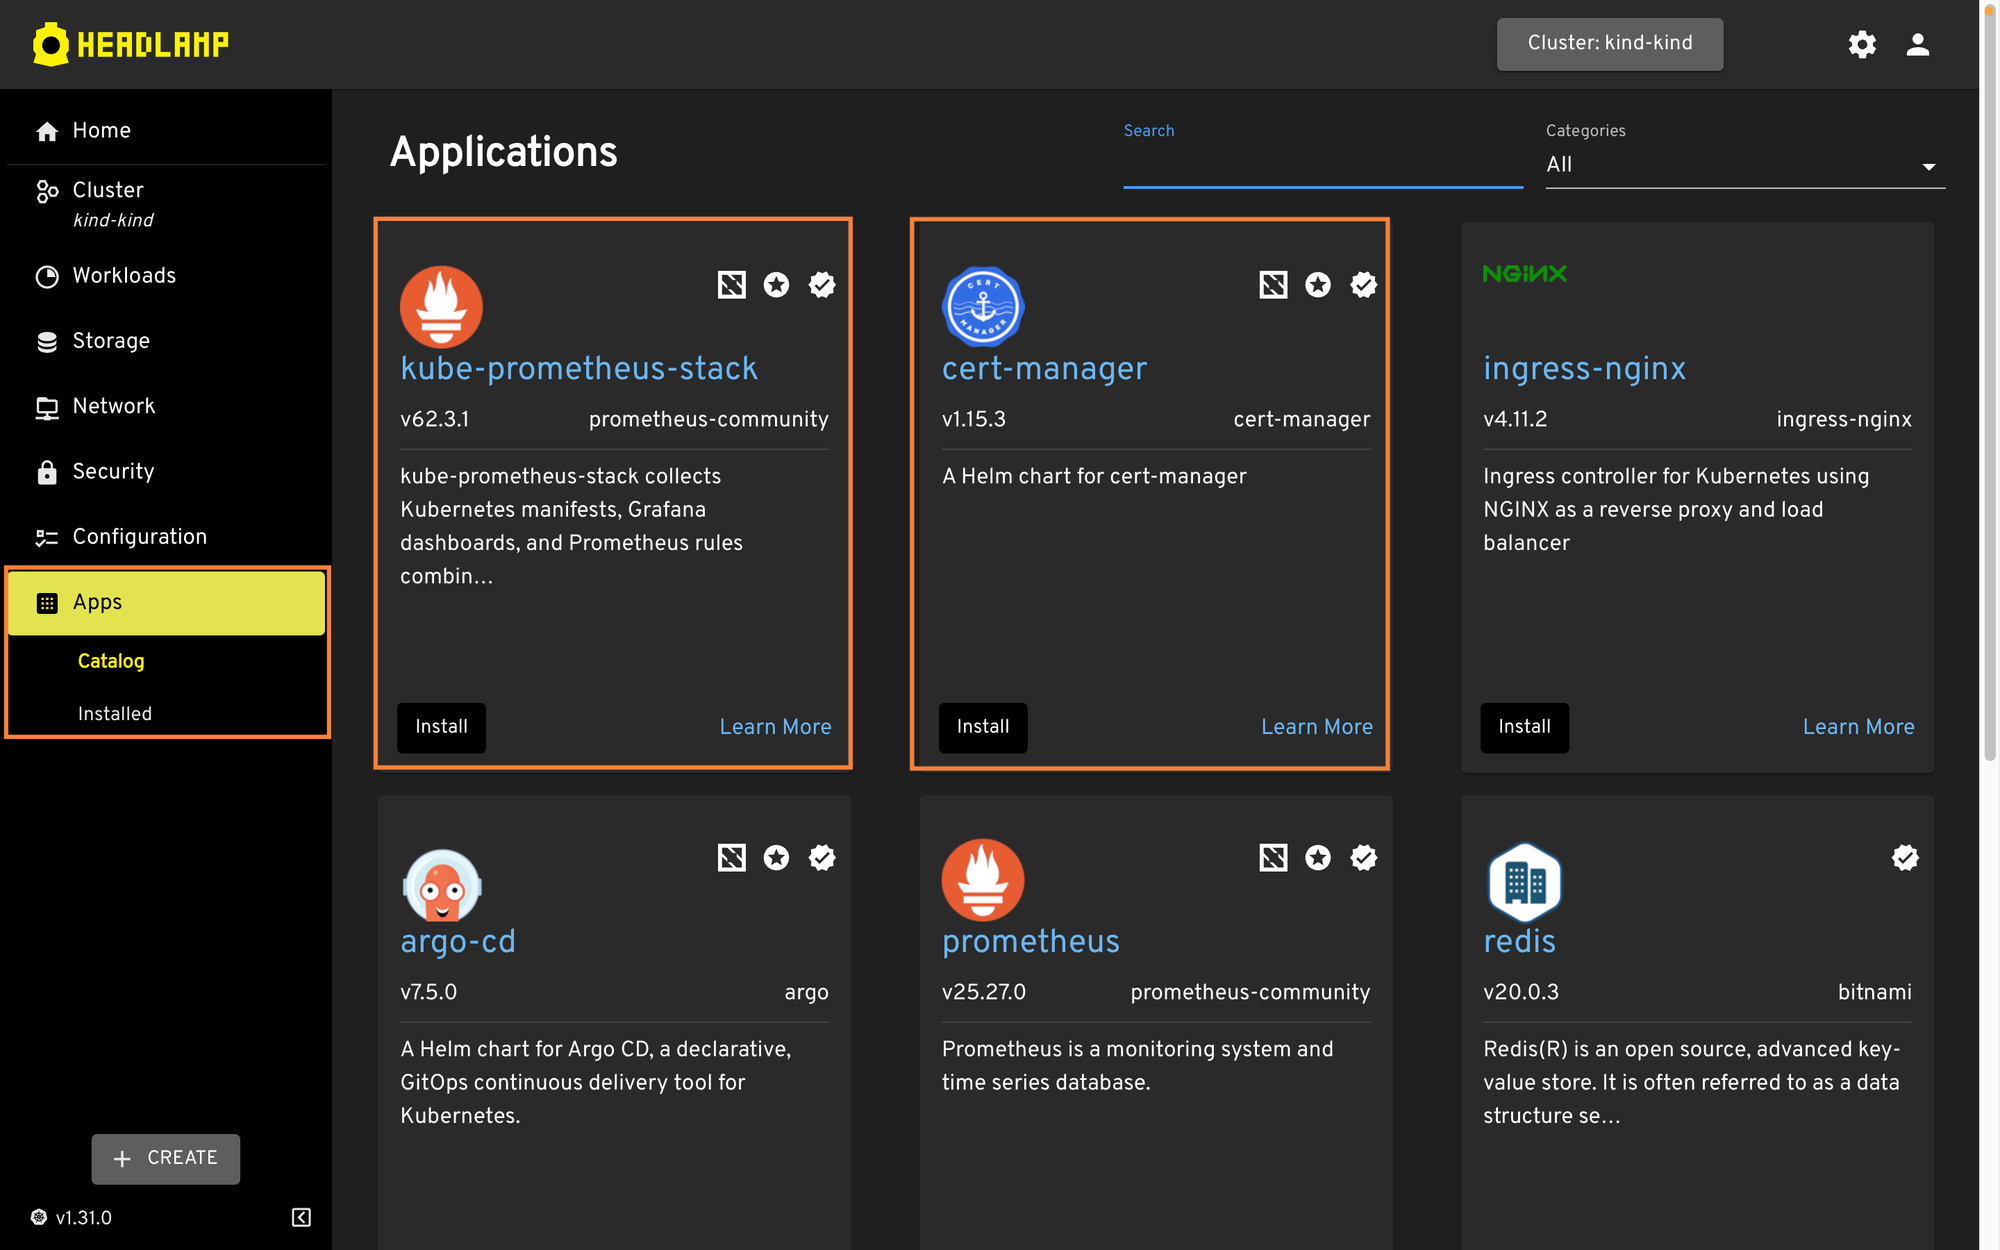
Headlamp does allow you to configure and deploy Helm applications. You can find a huge list of different applications under the Apps Catalog. From here you can search and install any chart you want and give it the appropriate configurations. All the helm charts present are being fetched from the ArtifactHub. If you wish to deploy a Helm Chart on a different OCI repository, you will have to rely on the Helm CLI.
Application Management with Devtron
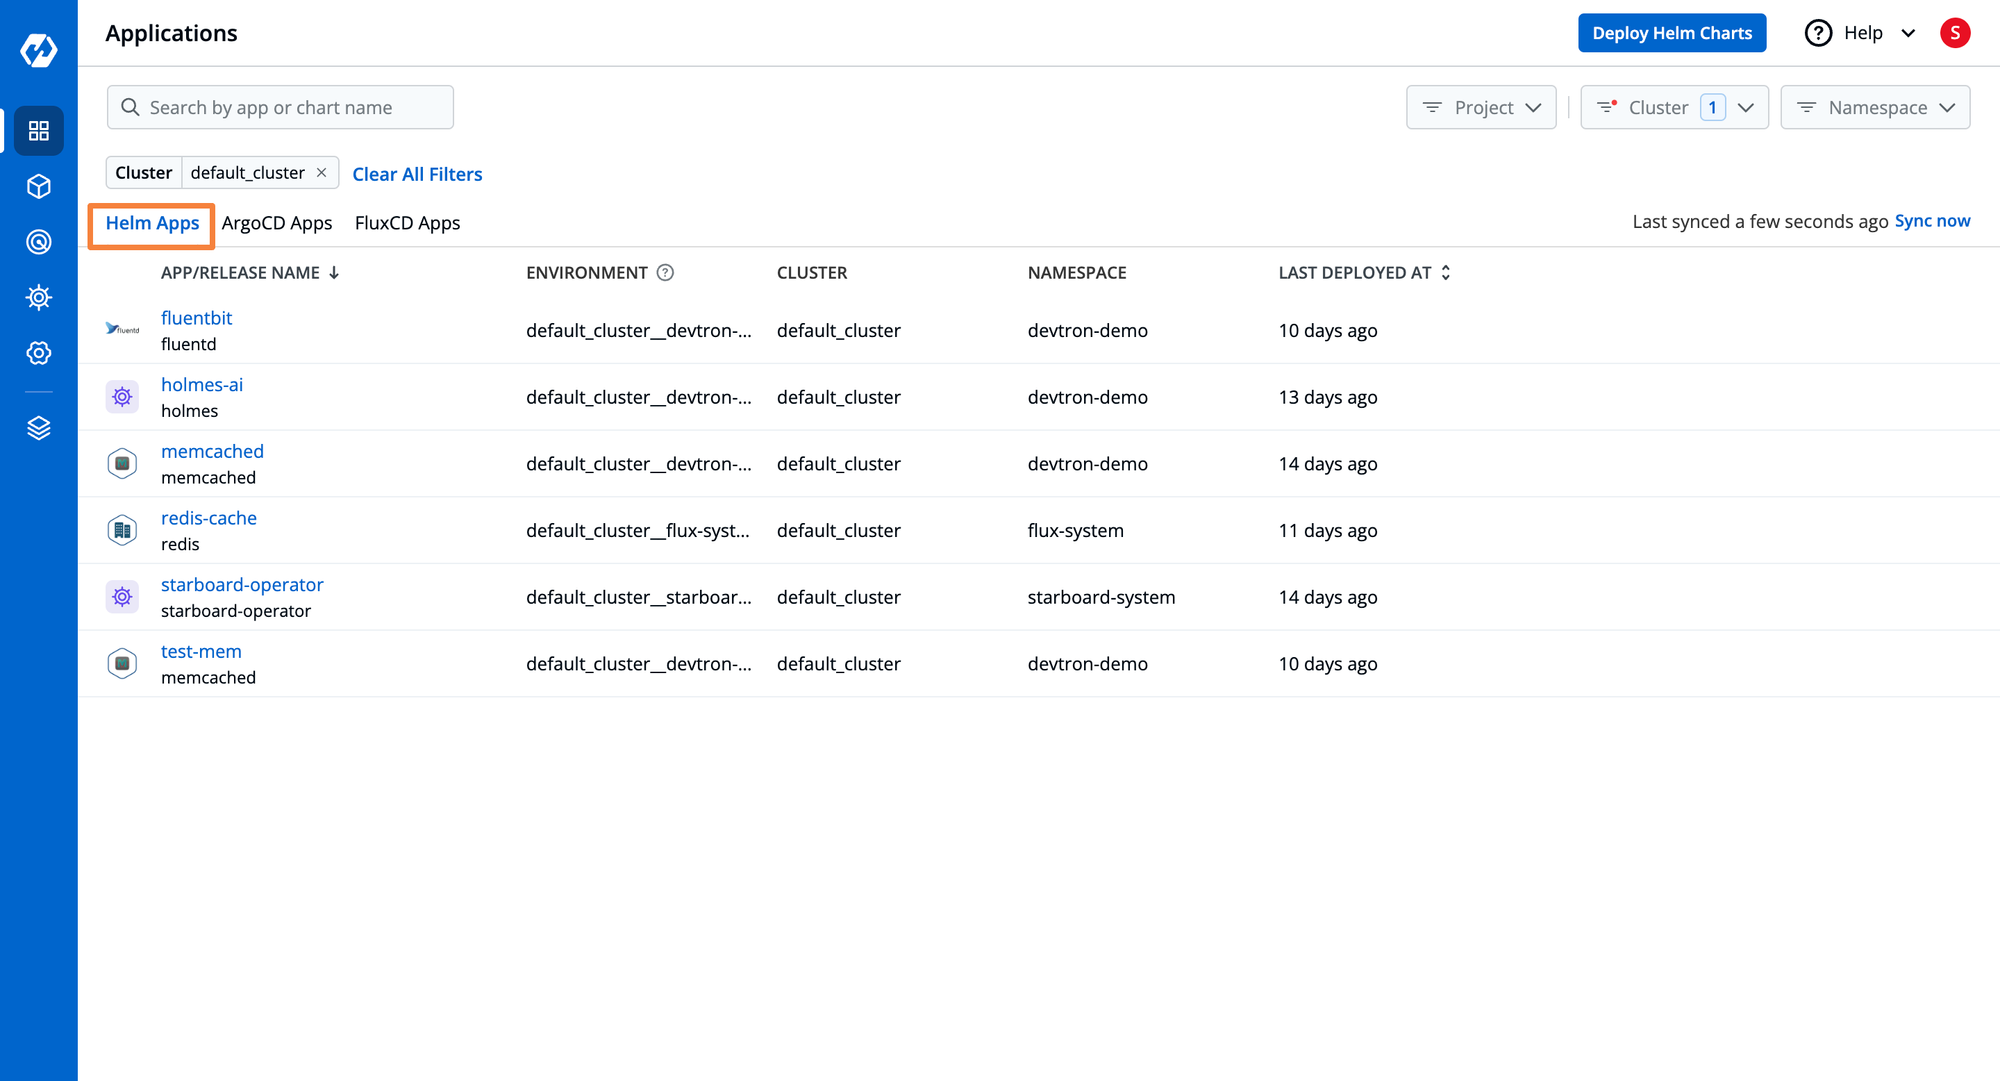
Devtron’s Kubernetes Dashboard helps manage Kubernetes applications with its dedicated Helm Apps management dashboard. In this dashboard, Devtron lists all Helm applications deployed across multiple Kubernetes clusters providing you with a 360-degree view of all applications. You can also filter applications of choice using multiple filters such as Projects, Clusters, and Namespace. By providing a Helm dashboard similar to the Kubernetes dashboard of Devtron, you can now manage all your Helm applications in a single pane of glass. Having a single and intuitive application management dashboard helps you to easily navigate through multiple applications that are spread across multiple Kubernetes clusters without any context switching and tedious processes.
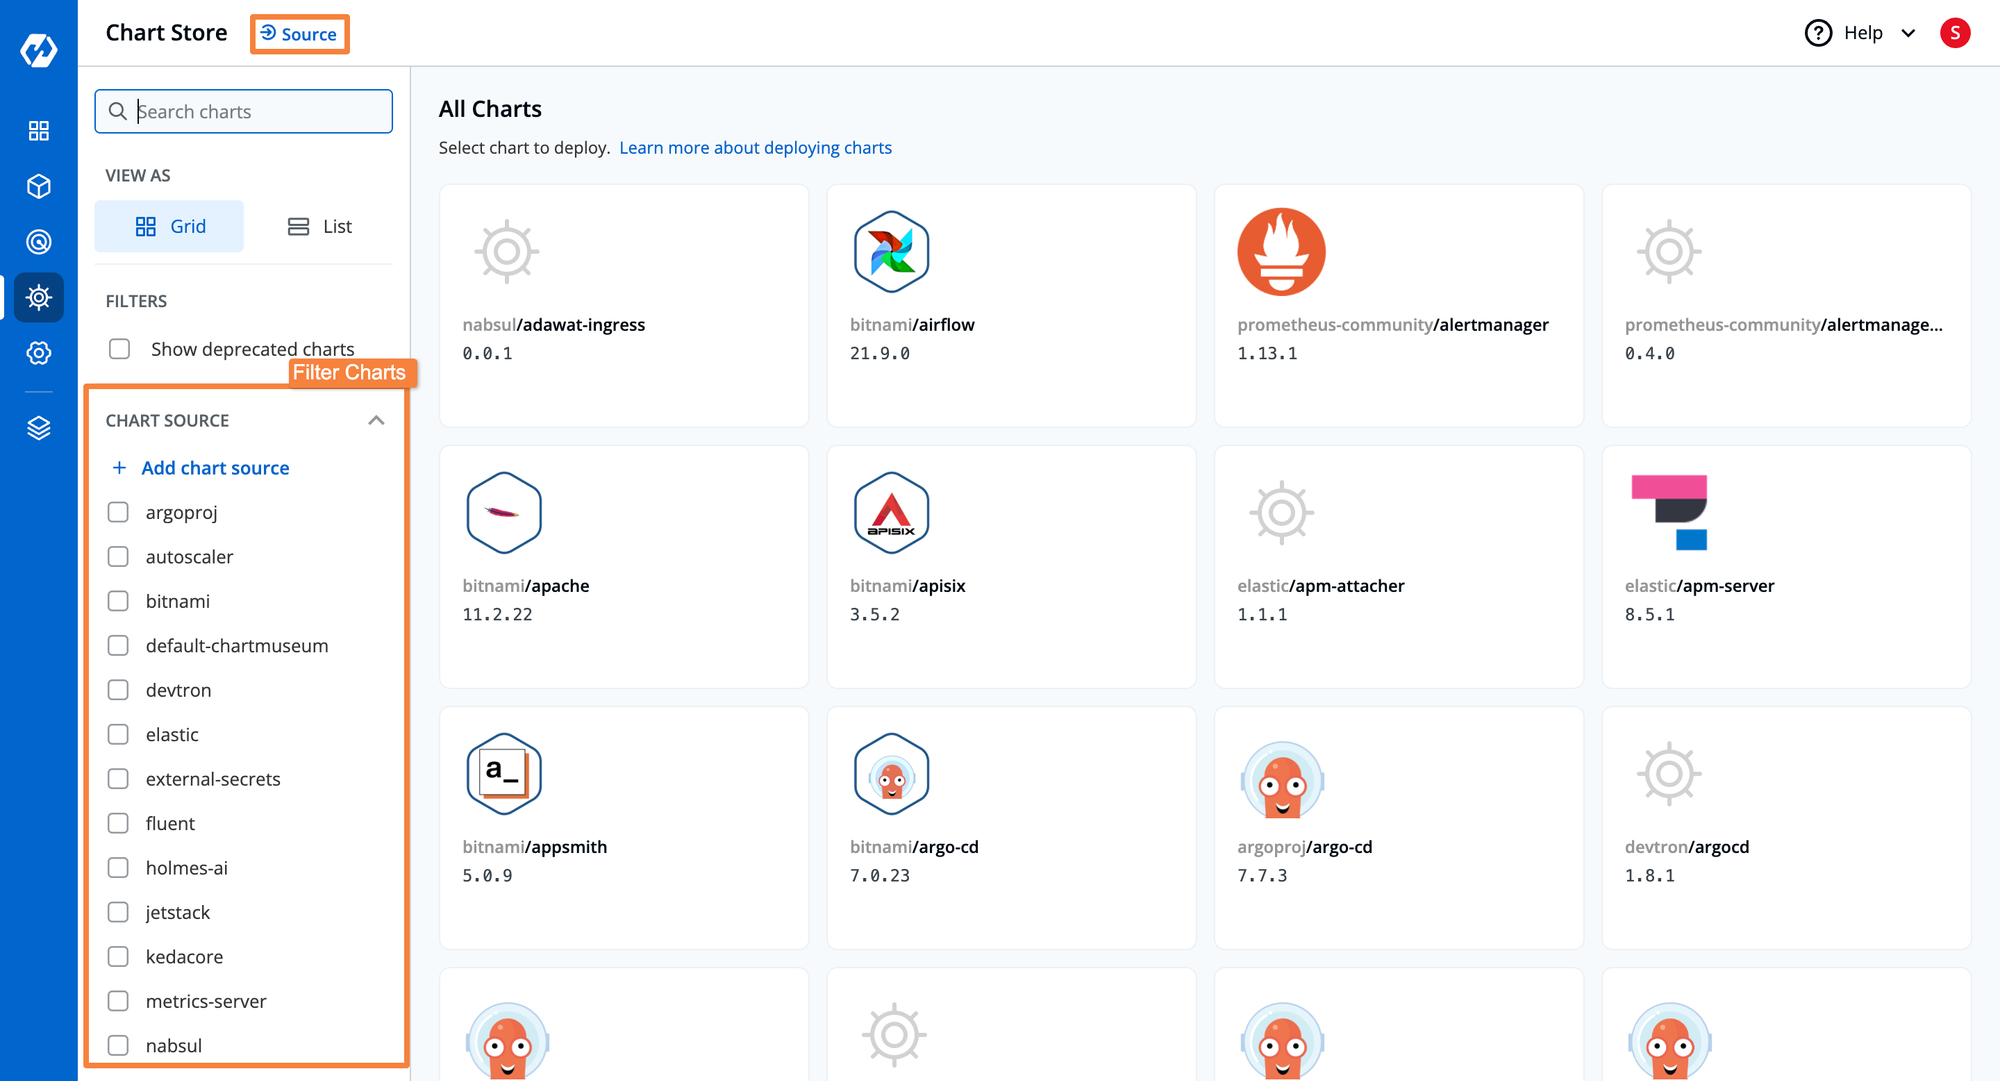
The Helm App dashboard of Devtron allows you to create and deploy new applications to target the Kubernetes cluster and environment. By navigating to the top right corner at Create > From Chart Store you are redirected to the Chart Store entity of Devtron. The Chart Store contains multiple Helm charts readily available for deployment. You can configure your own Helm registry to deploy custom applications too.
Devtron’s Helm dashboard comes with some advanced capabilities like troubleshooting the application, managing the configurations, and handling the configuration drifts. Some more features that devtron provides are resource grouping at the application level, real-time health status, and Deployment History.
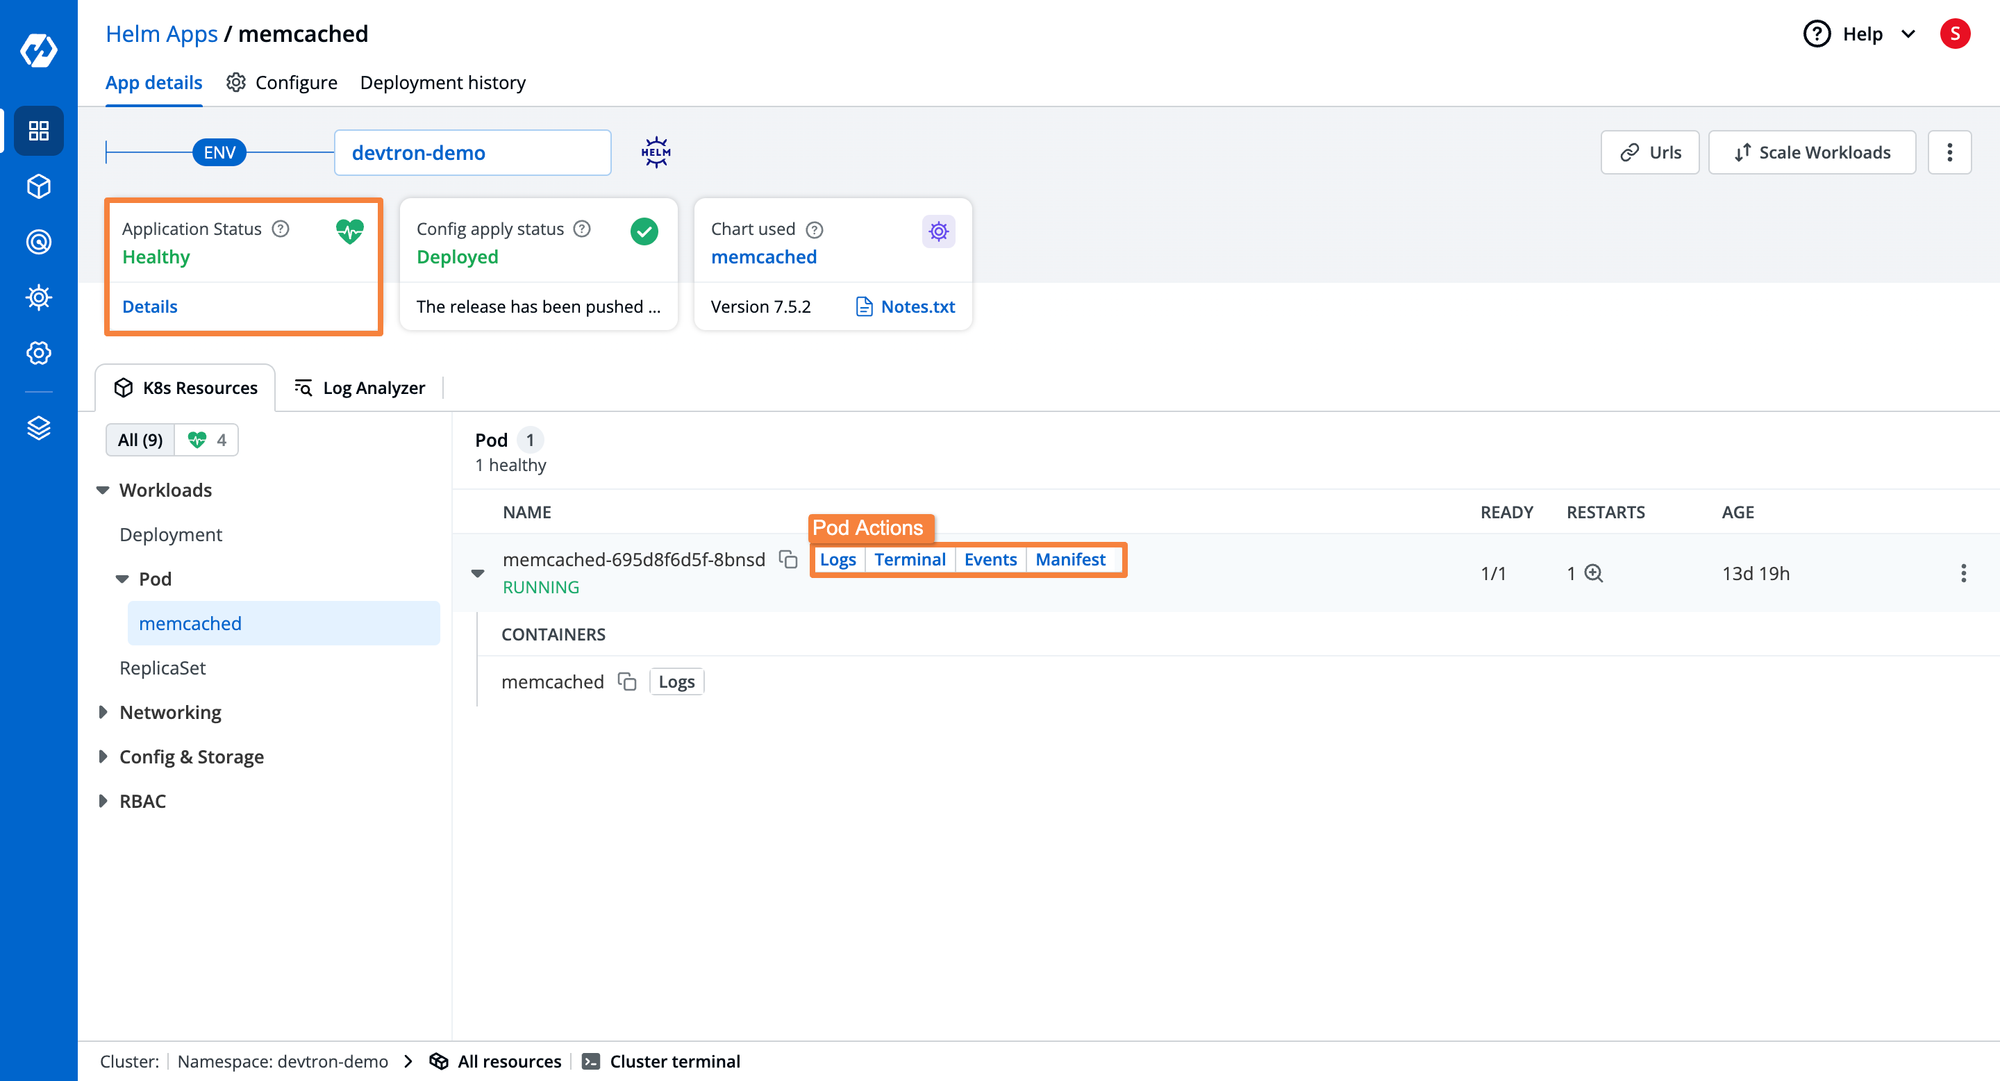
In case you need to visualize the logs of specific pods and perform some troubleshooting. Devtron provides you the capability to visualize the real-time logs on the same Helm dashboard. Some more additional features that the Helm dashboard provides to you are Manifest (view and edit live manifest), and Events.
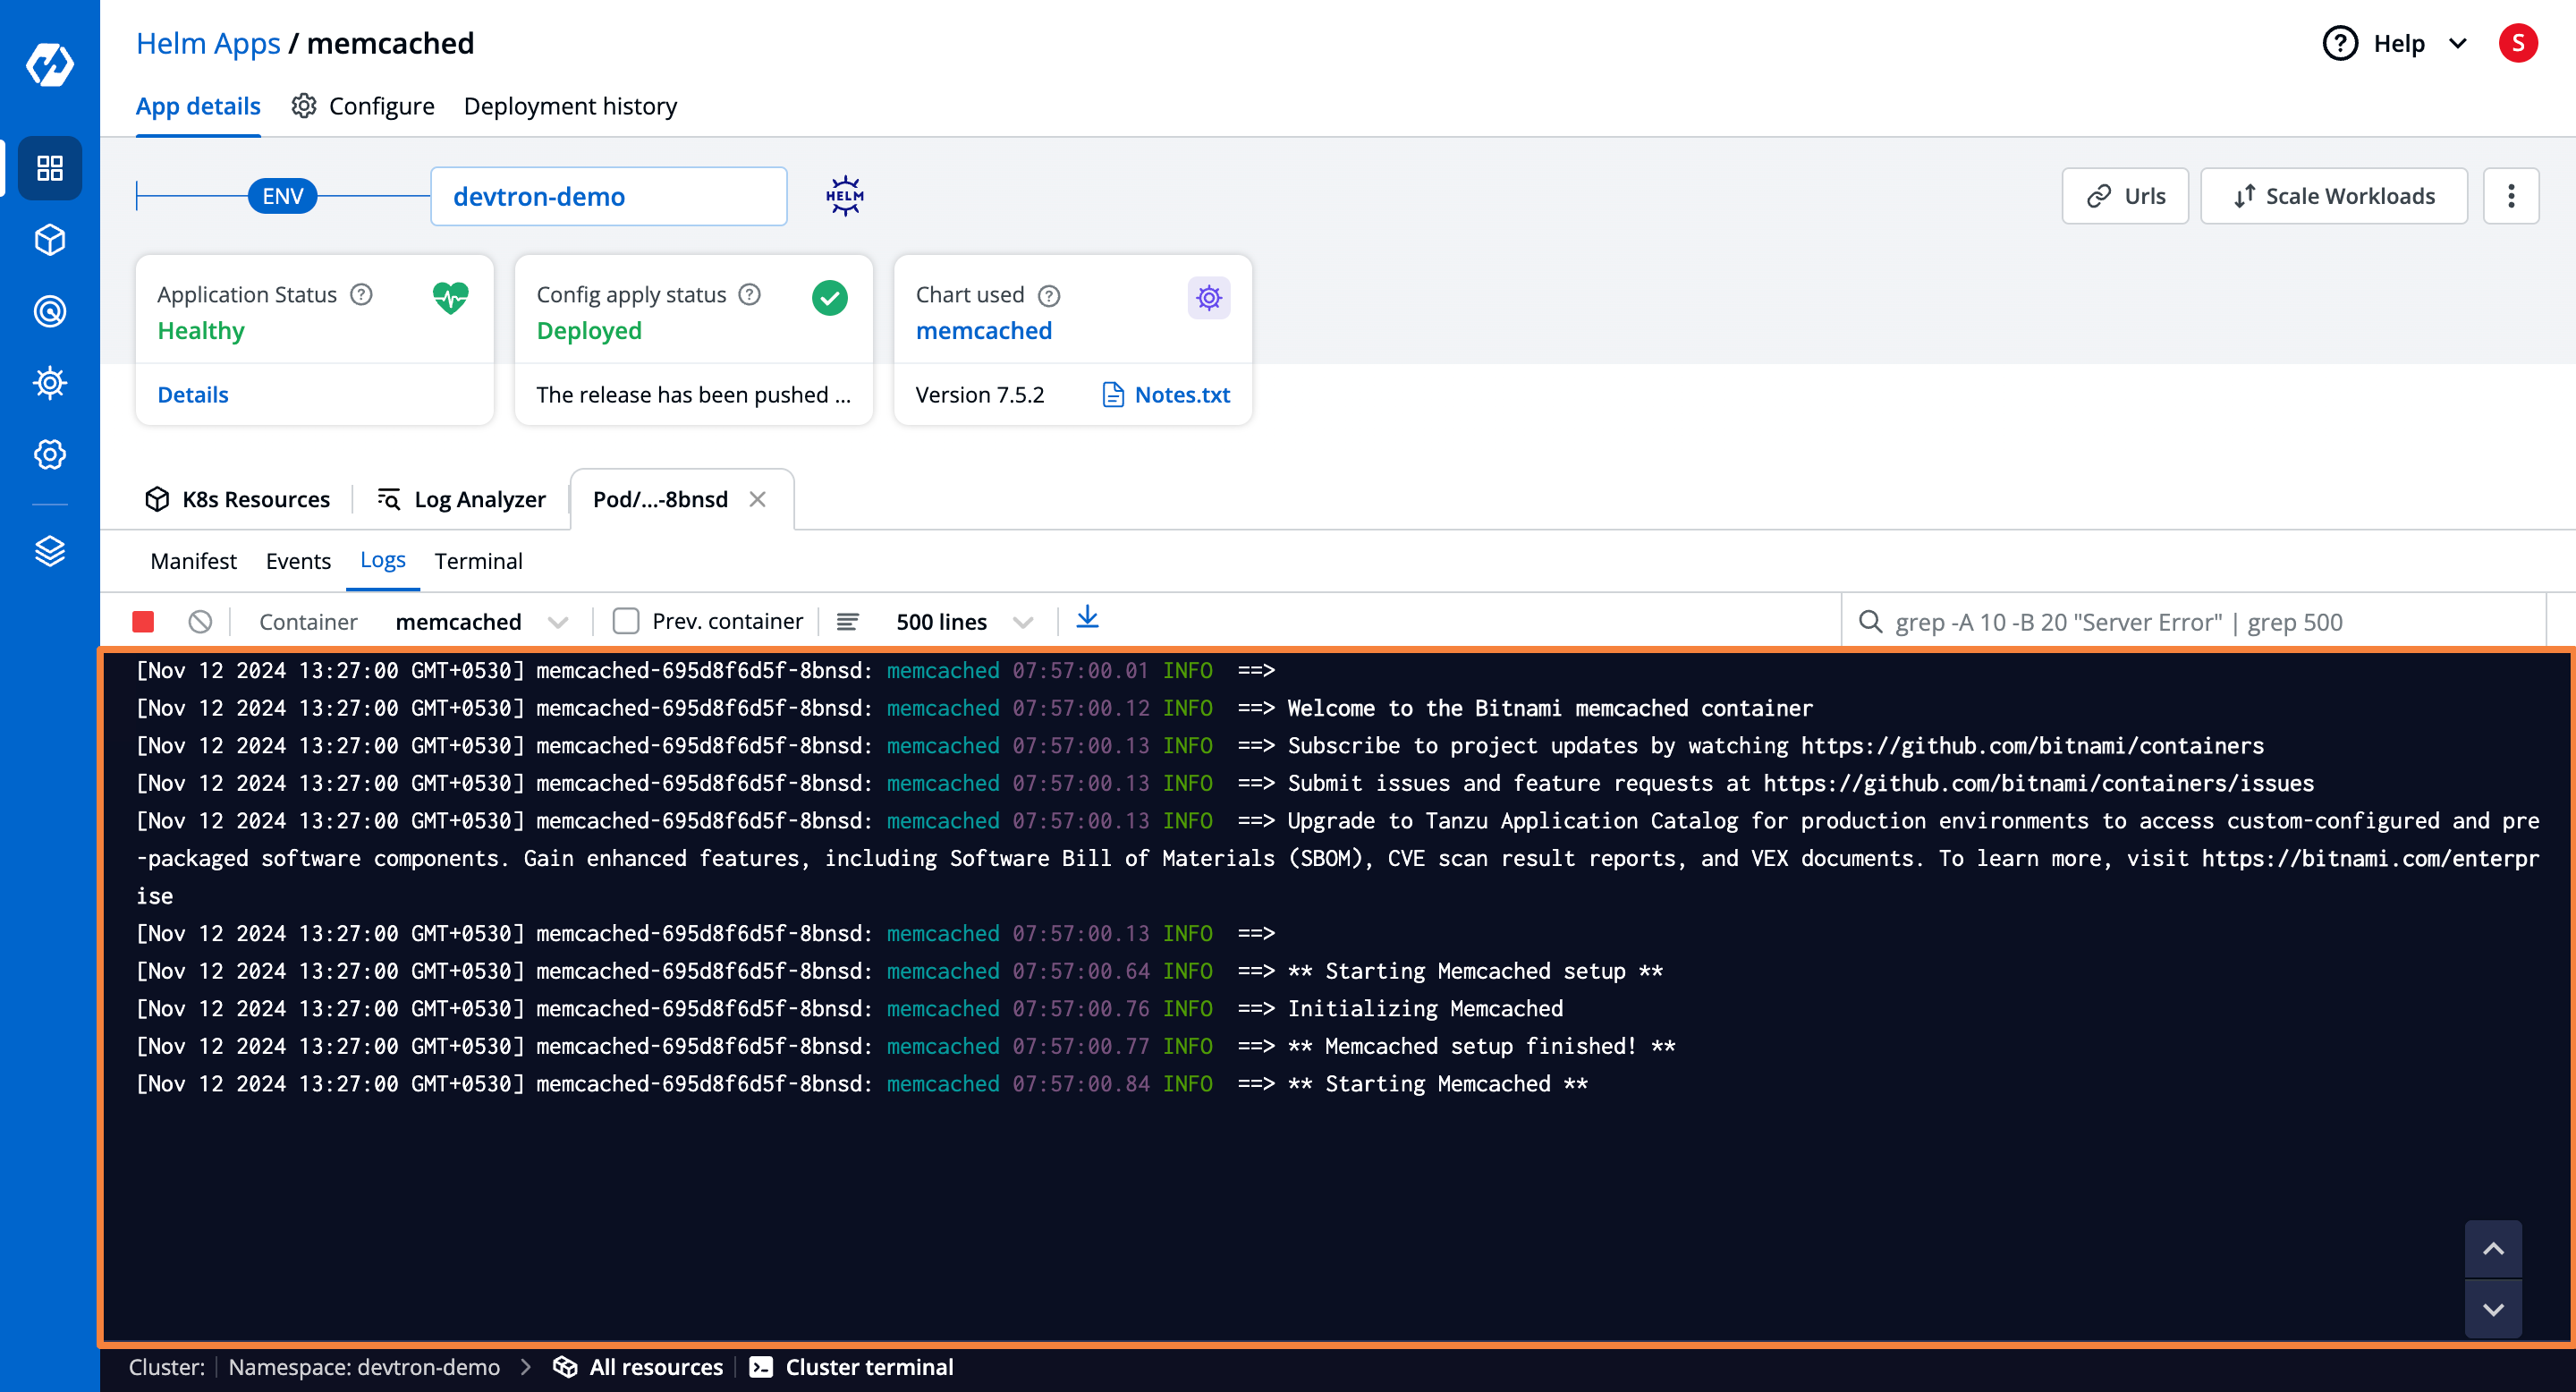
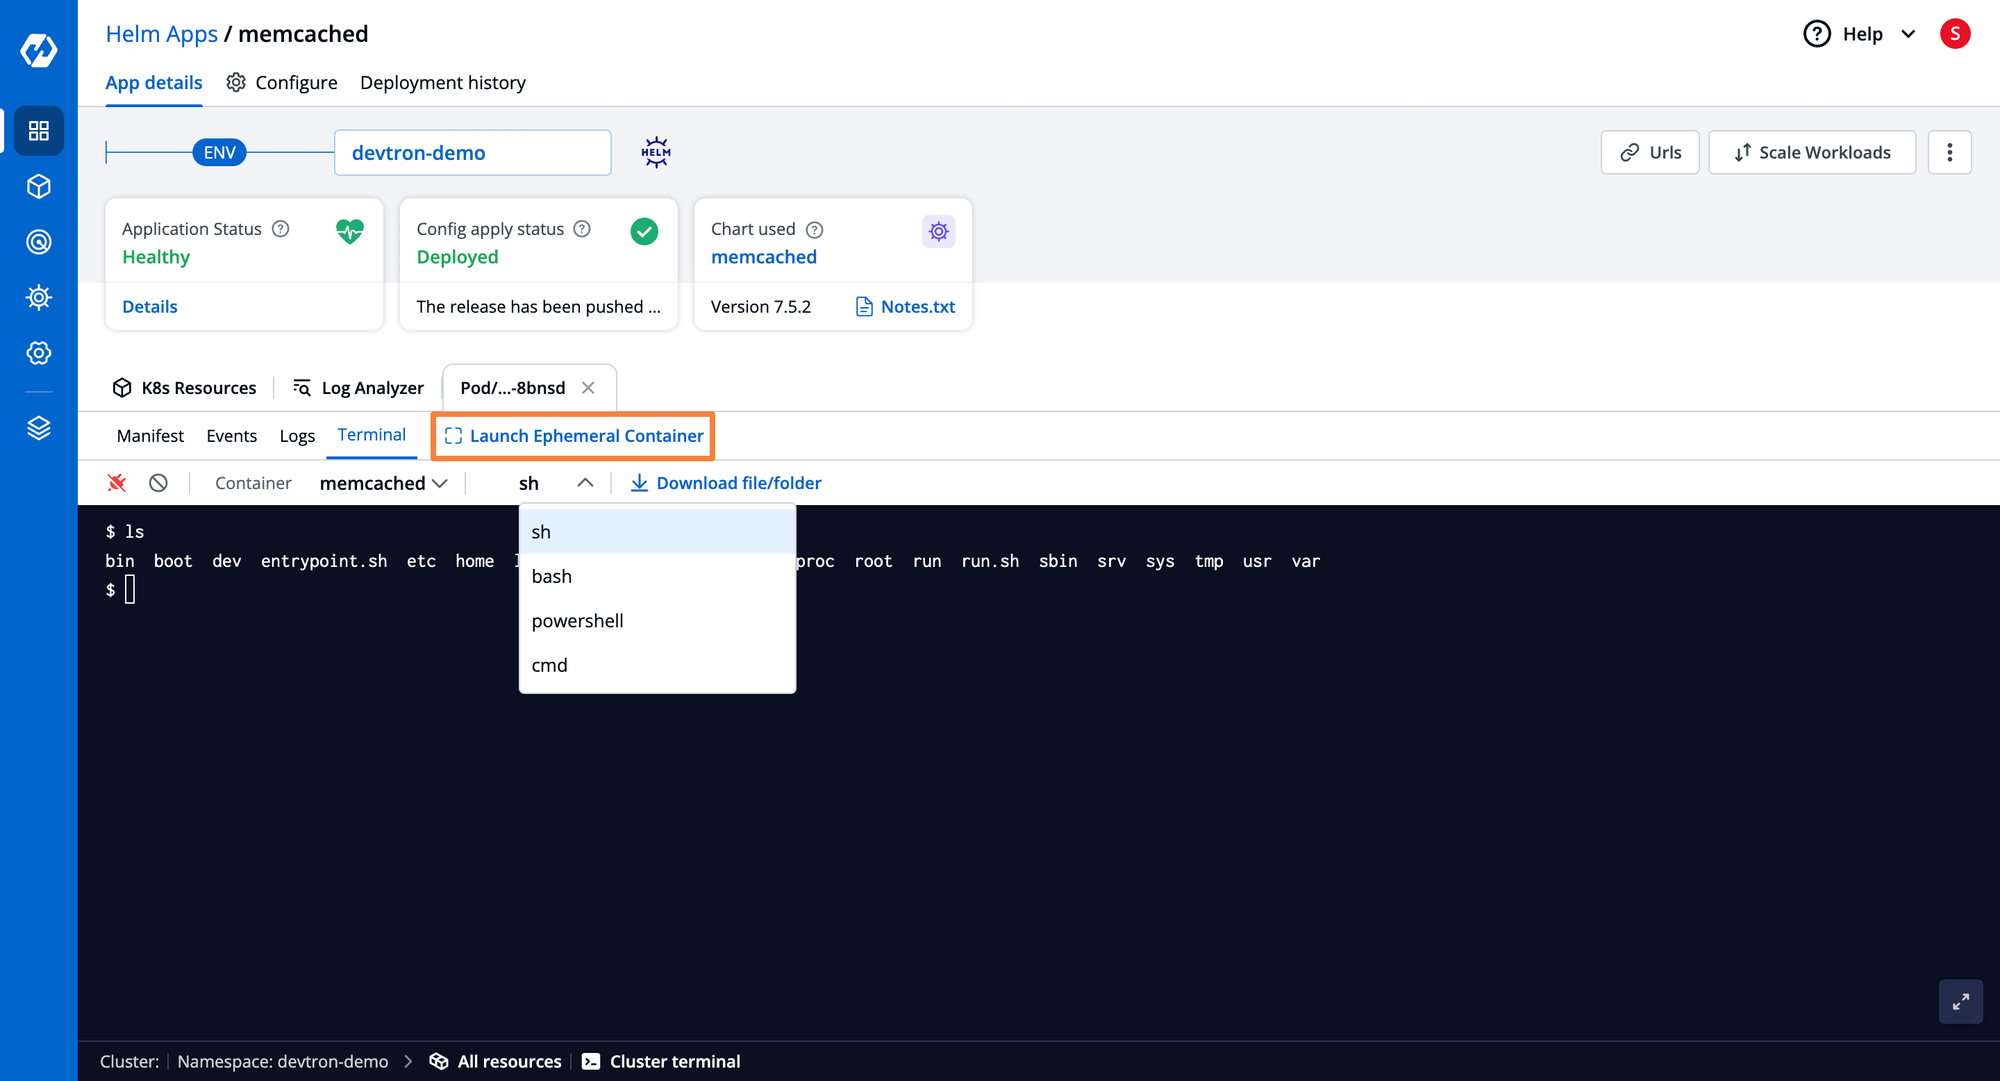
For troubleshooting errors of applications, with the Helm dashboard of Devtron, you can launch a dedicated Terminal for a specific pod and fire up some commands for troubleshooting. You can use some advanced capabilities of Devtron’s Helm dashboard for troubleshooting like Launch Ephemeral Containers.
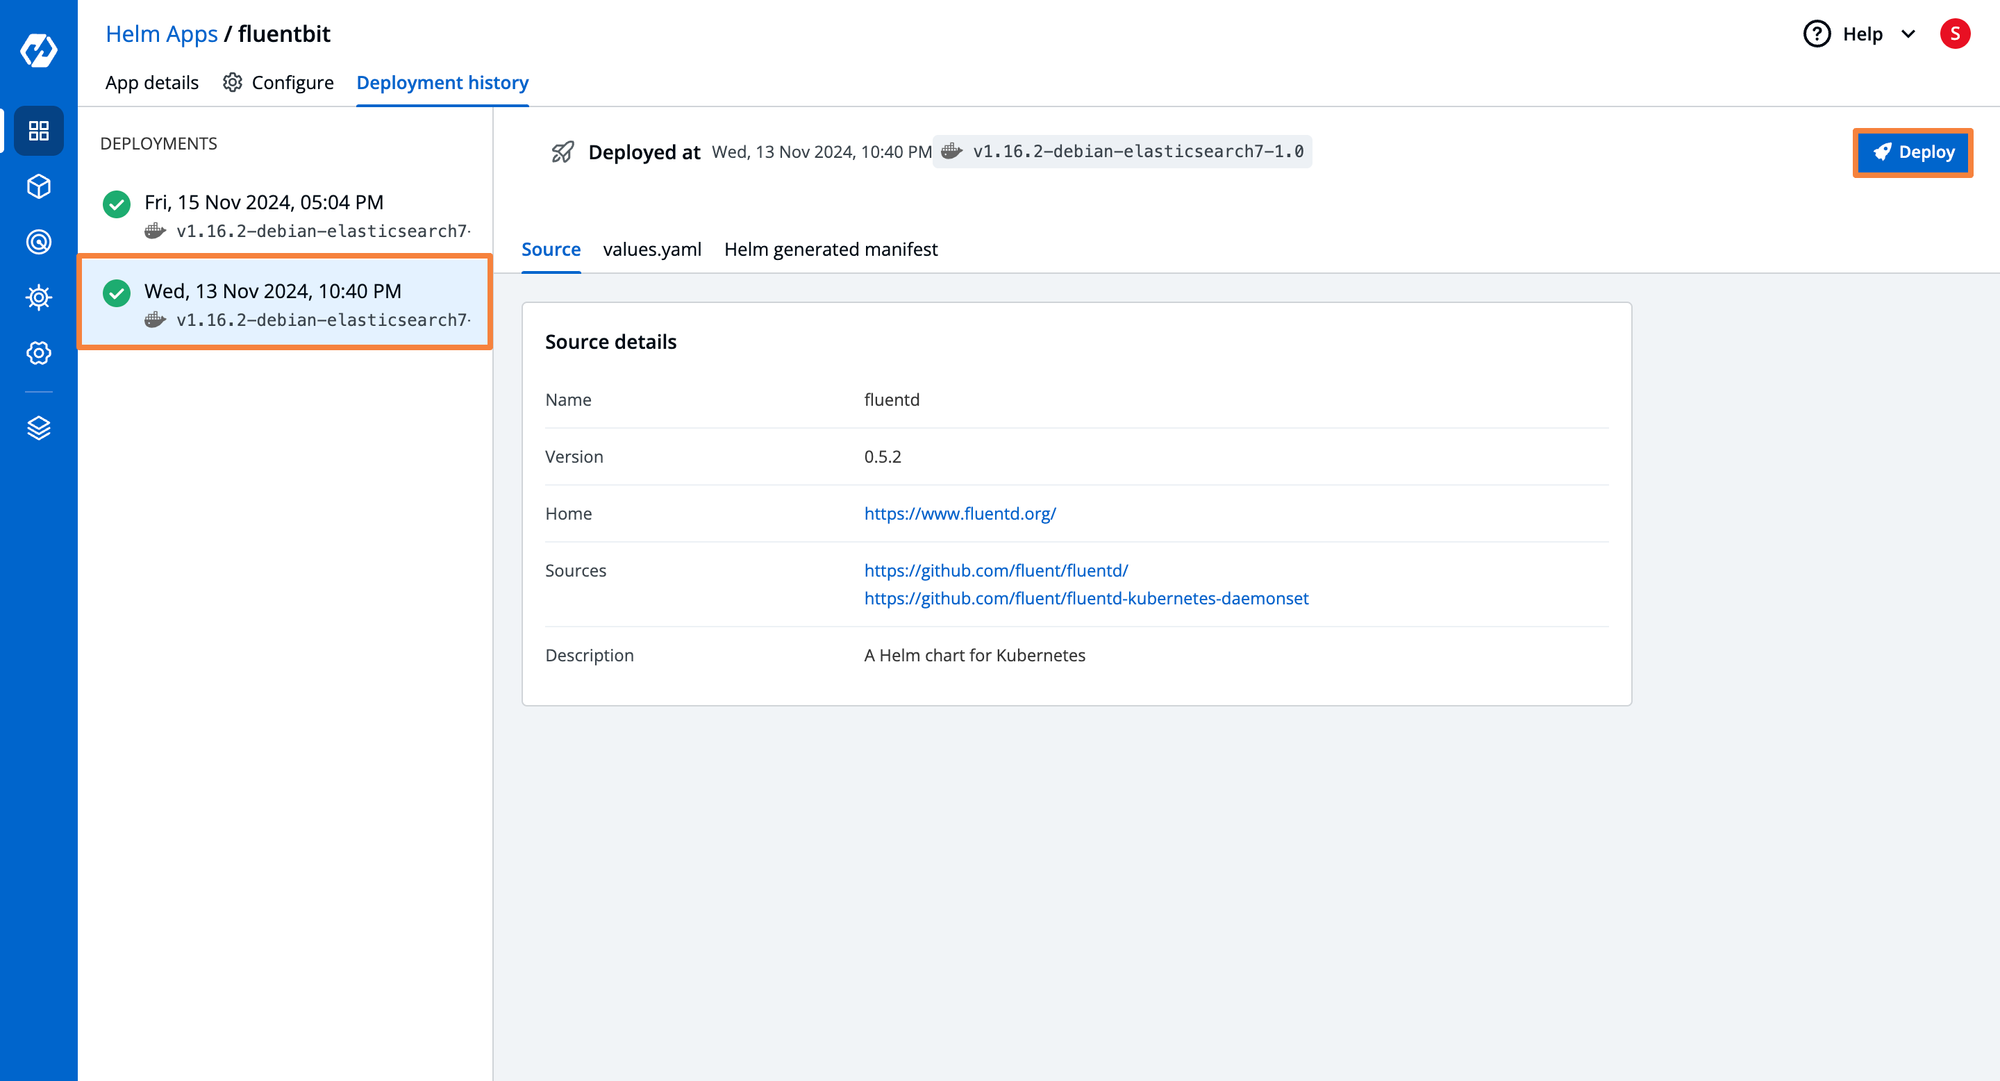
To trace the changes in applications and their configurations at scale the audit log is something that can help. The Helm dashboard of Devtron provides you with a complete audit log of each deployment of applications along with their configurations. The Deployment History of Helm dashboard provides an audit log of deployments with day-date-time for deployment, an artifact that has been deployed, values.yaml, and the Helm-generated manifest. If your new deployments does not meet the expected outcome you can perform one-click rollbacks with this Helm dashboard.
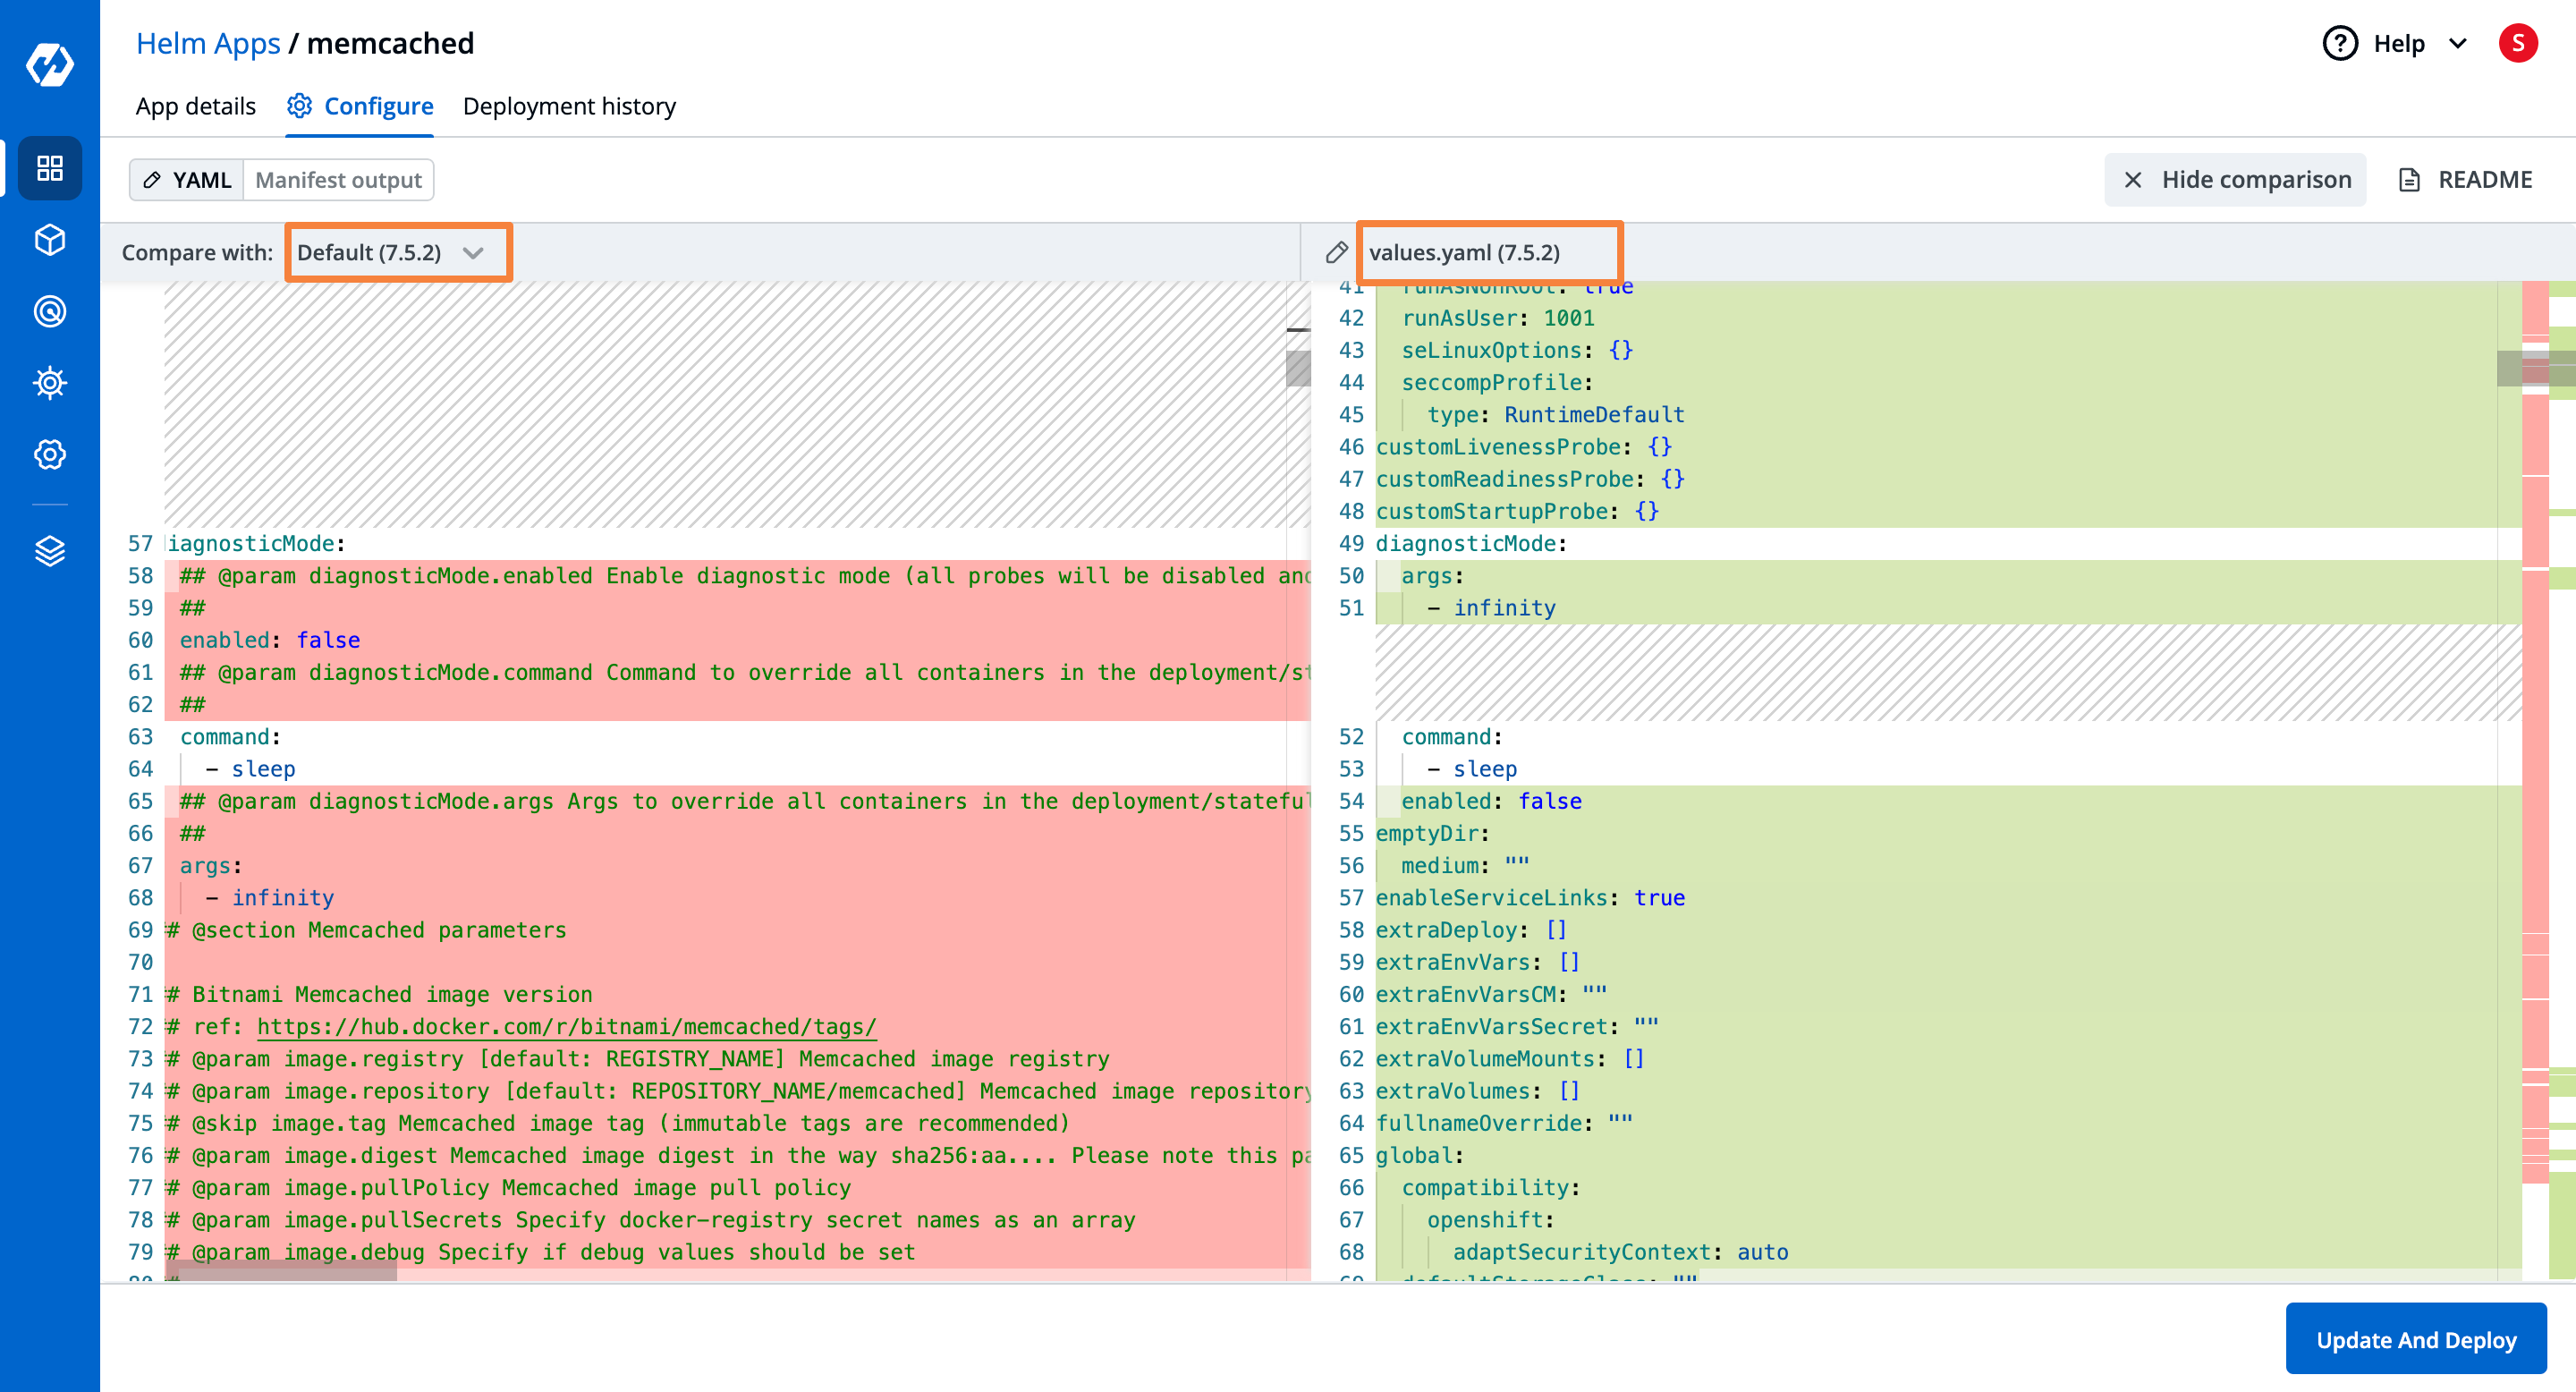
Before executing the newer version deployment of your Helm application, you may want to check the previous configurations. The Helm dashboard of Devtron allows you to compare configurations of previous deployments with the newer ones.
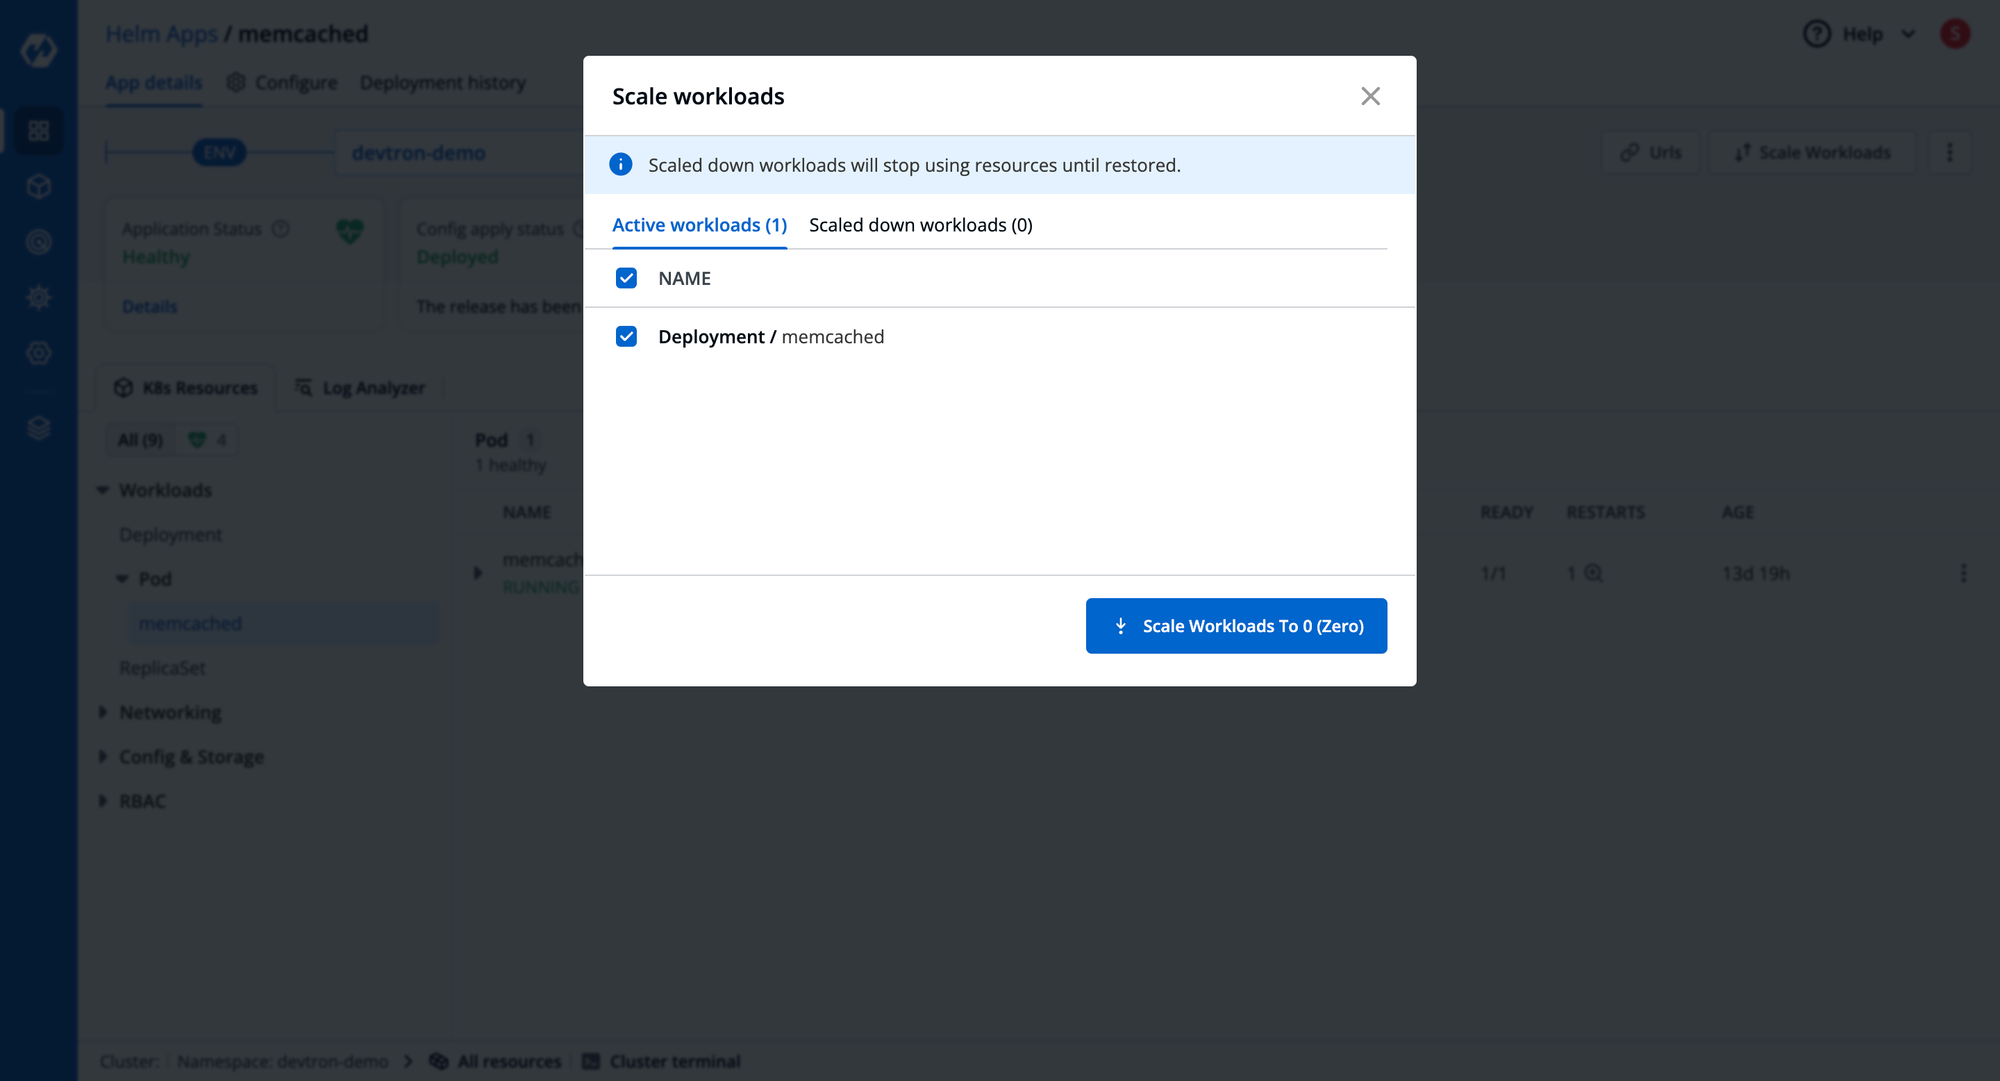
For optimizing the cost of infrastructure you may sometimes need to scale down some workloads of applications. With Devtron the workloads can be scaled down with a single click.
| Capability | Devtron | Headlamp |
|---|---|---|
| Deploy Helm Charts from UI | ✅ | ✅ |
| Default Charts Marketplace | ✅ | ✅ |
| Add Custom Charts & Deploy | ✅ | ❌ |
| Chart Groups for Multi-charts deployment | ✅ | ❌ |
| Charts Configuration and Manifest Diff | ✅ | ❌ |
| Easy Rollback | ✅ | ❌ |
| Deployment History with Configs | ✅ | ❌ |
| Resource Grouping at Charts Level | ✅ | ❌ |
| Exec into Pods | ✅ | ✅ |
| Logs Analyzer to grep/view logs of multiple pods | ✅ | ✅ |
| RBAC Managed Access at Helm Charts Level | ✅ | ❌ |
| Easy Charts Upgrade from UI | ✅ | ❌ |
| GitOps-Based Charts Deployments | Possible with Integrations | ❌ |
| Port forward pods from the dashboard | ❌ | ✅ |
Controlling Access Management & Collaboration
One of the most critical, yet challenging aspects of Kubernetes is managing the proper level of access for users and applications. Even if you have a single cluster, with a small team, the permissions for each user have to be configured, and that can be a challenge. Kubernetes has baked in RBAC features with the help of Roles (to define the permissions) and RoleBindings (to assign permissions). Creating these two resources to manage permissions for users is easy enough.
The challenge arises when you have to update the permissions and understand which role is assigned to which user. This also becomes a repetitive task when you have to assign the same set of permissions to multiple users, for example, the developer teams should have access within the developer namespace.
You want a Kubernetes Dashboard to have some kind of capability to abstract away the complexities of creating and assigning the proper permissions to users. The dashboard should provide an easy way to create and update permissions and make access management easier.
Access Management in Headlamp
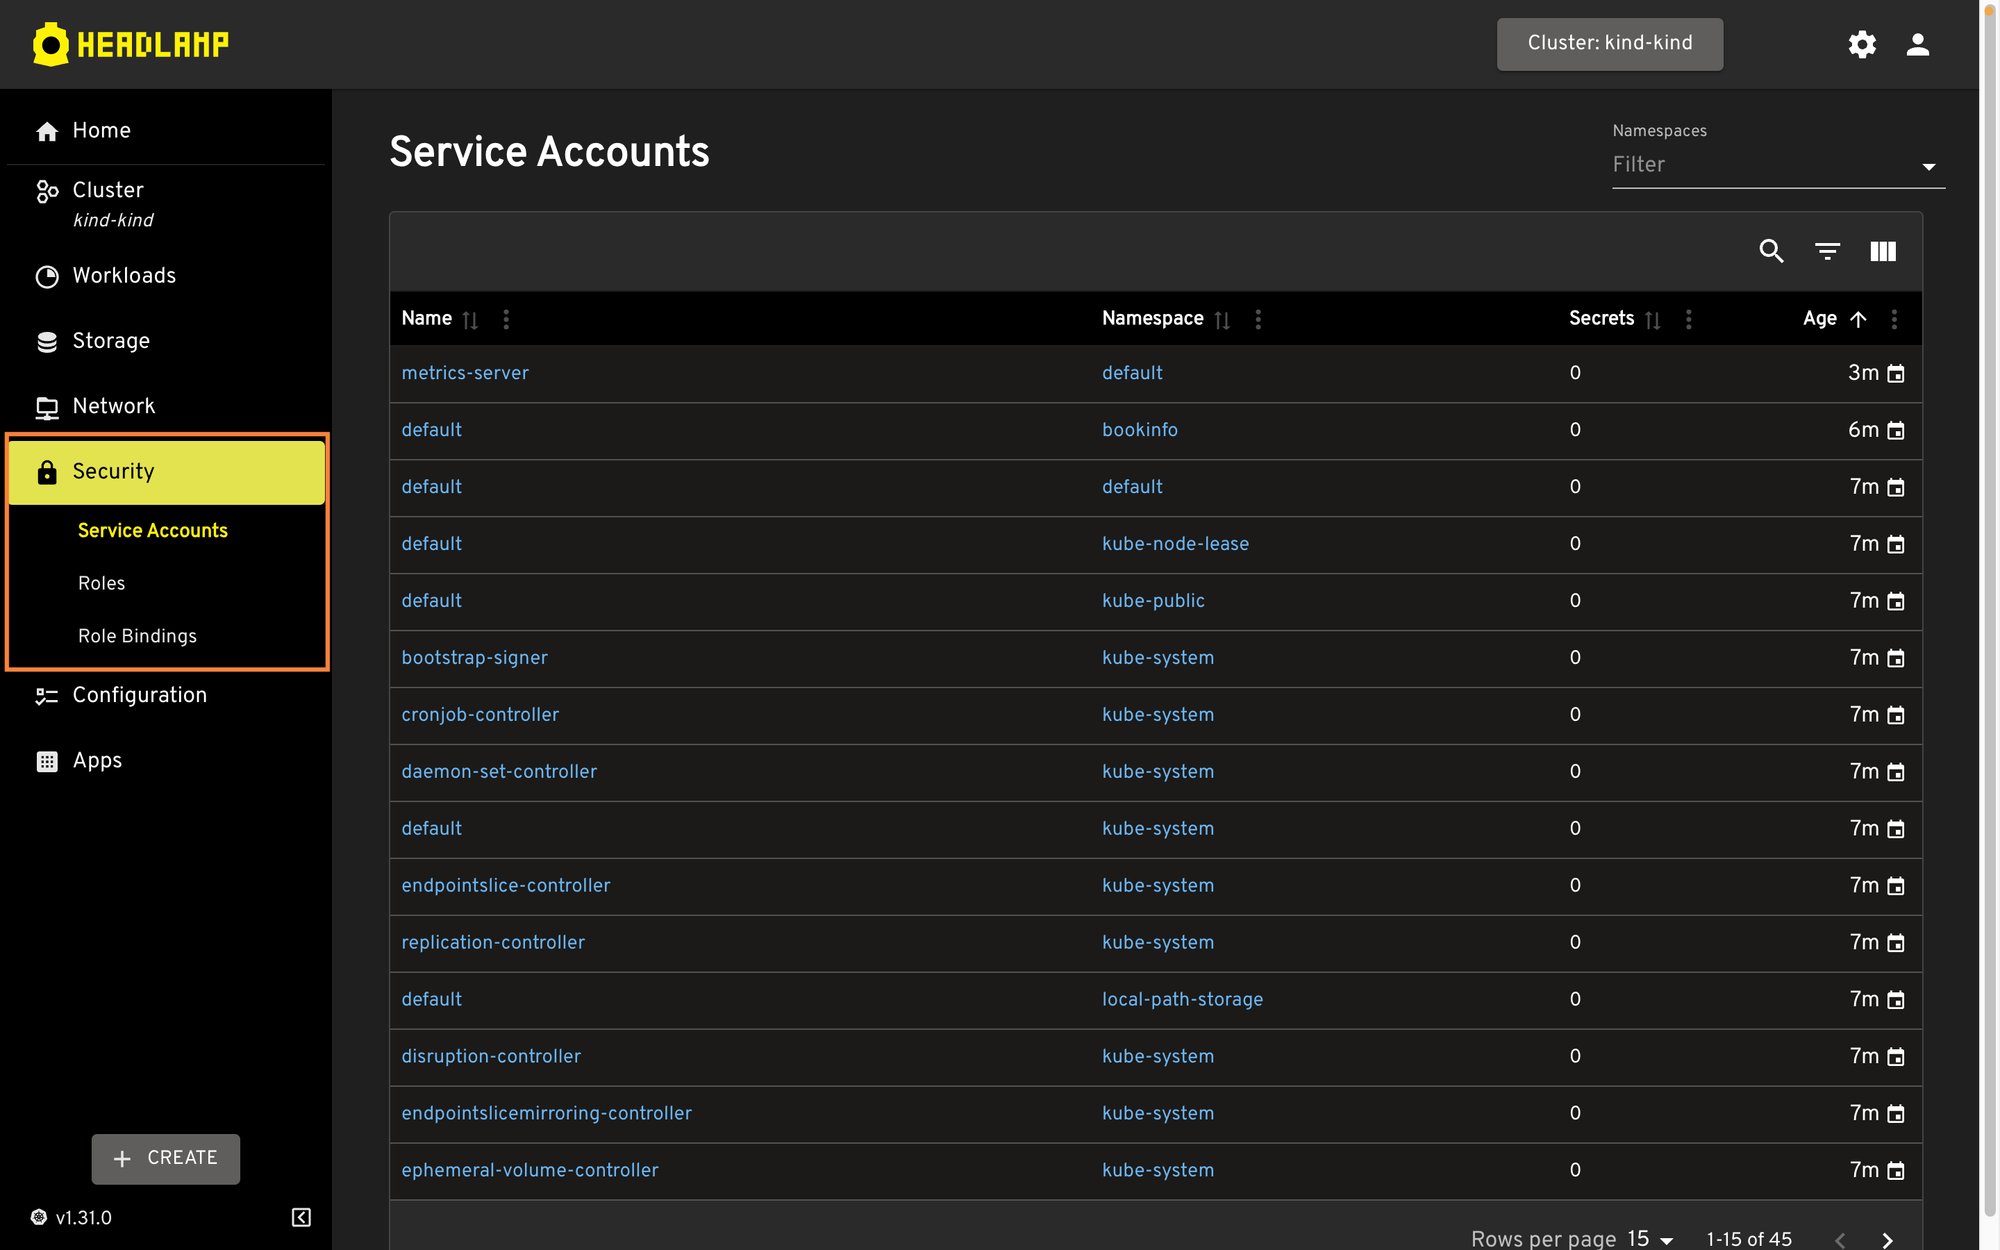
Under the security section, Headlamp shows you a list of ServiceAccounts, Role, and RoleBindings. However, there is no way to control the access management through Headlamp. If you wish to define RBAC permissions for a user or service account, you will have to use kubectl and manually create the roles/clusterroles and rolebindings/clusterrolebindings, which will then be visible in Headlamp’s UI.
Access Management in Devtron
Devtron has a dedicated tab under Global Configurations for Authorization where you can manage access to your Kubernetes infrastructure. You can Add Users by navigating to the User Permission tab of Devtron, where you will be able to configure a robust Resource Base Access Control (RBAC) for each user. For each new user, you can configure access down to the smallest unit of your Kubernetes cluster through an intuitive user interface.
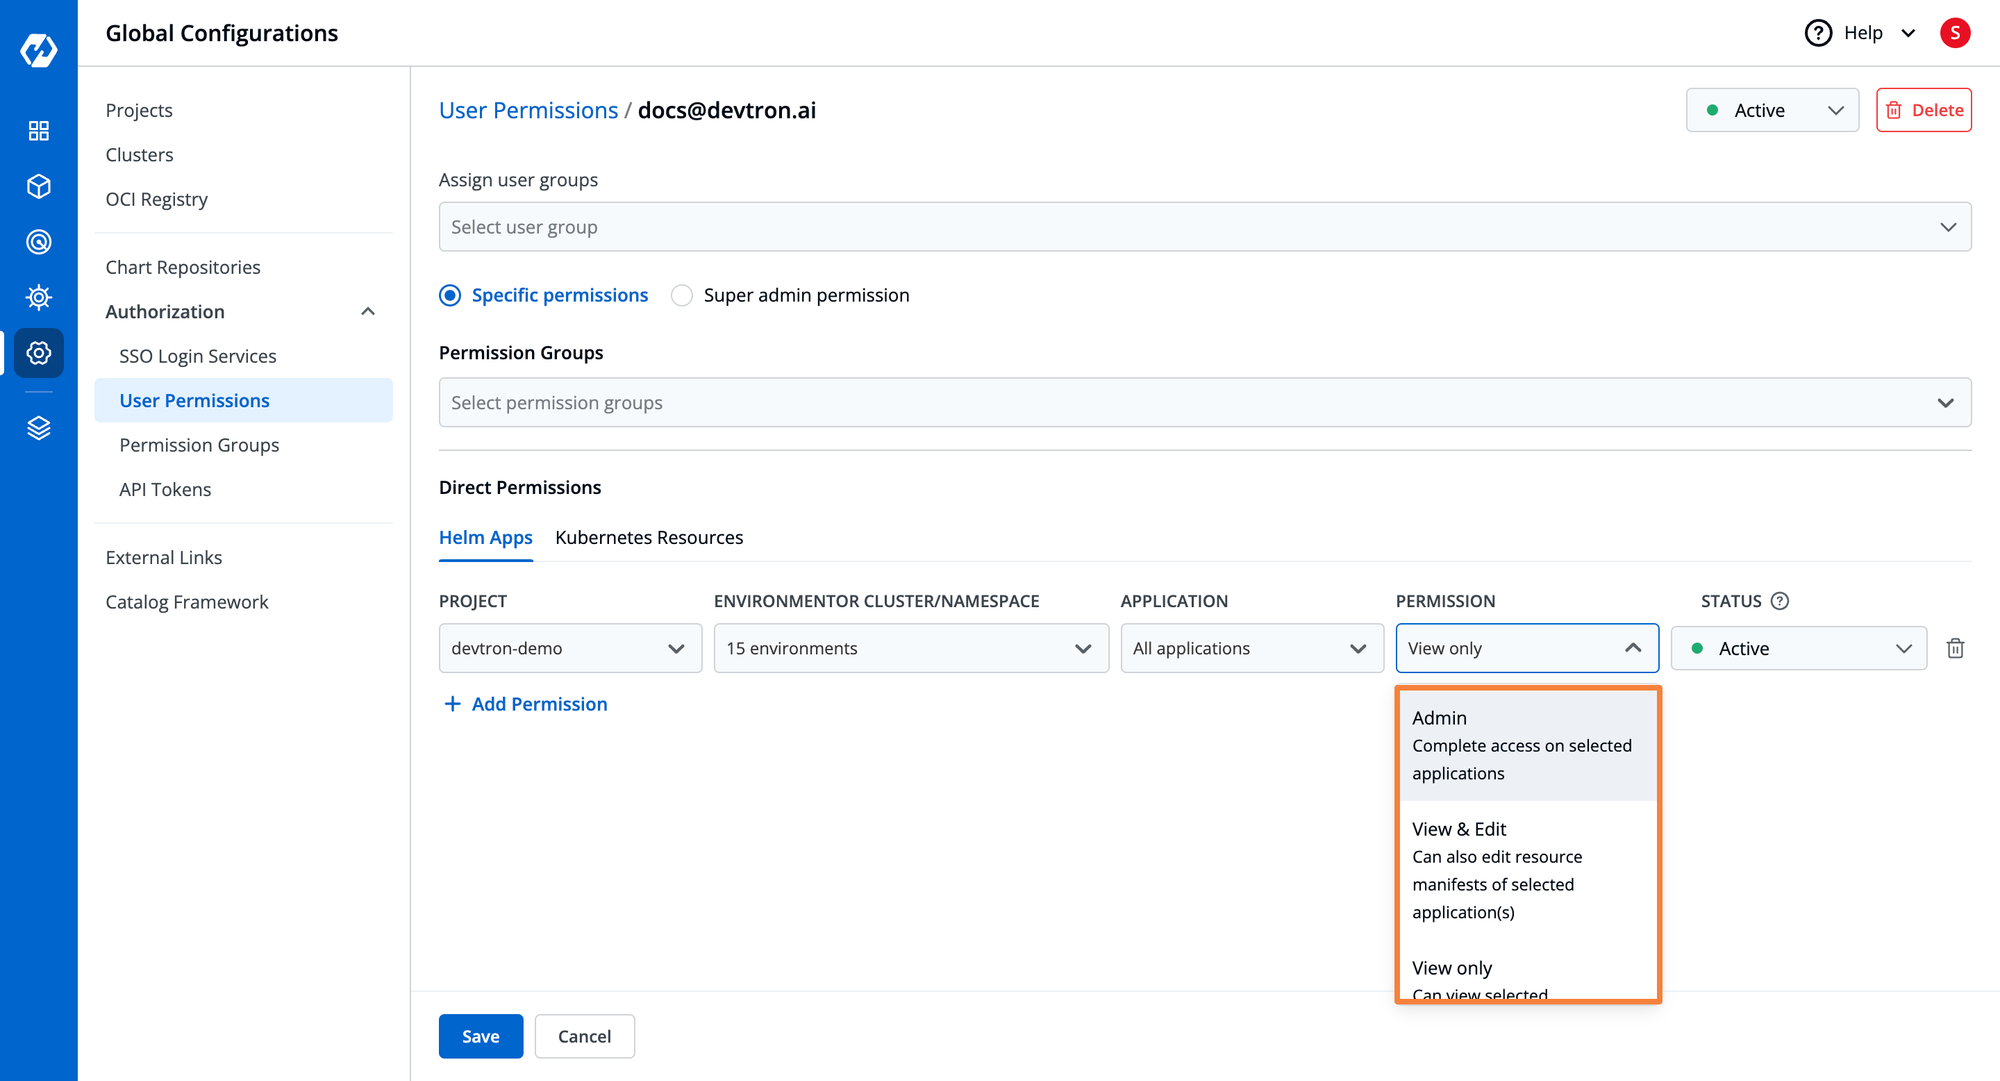
Devtron provides you support for defining Permissions Groups to which you can attach some specific permissions and the same permissions will be applied to users added to the group. For example, for every new joiner in the team, you can give `view access` to some application that you want them to see and these permission groups can be directly assigned whenever you add a new user.
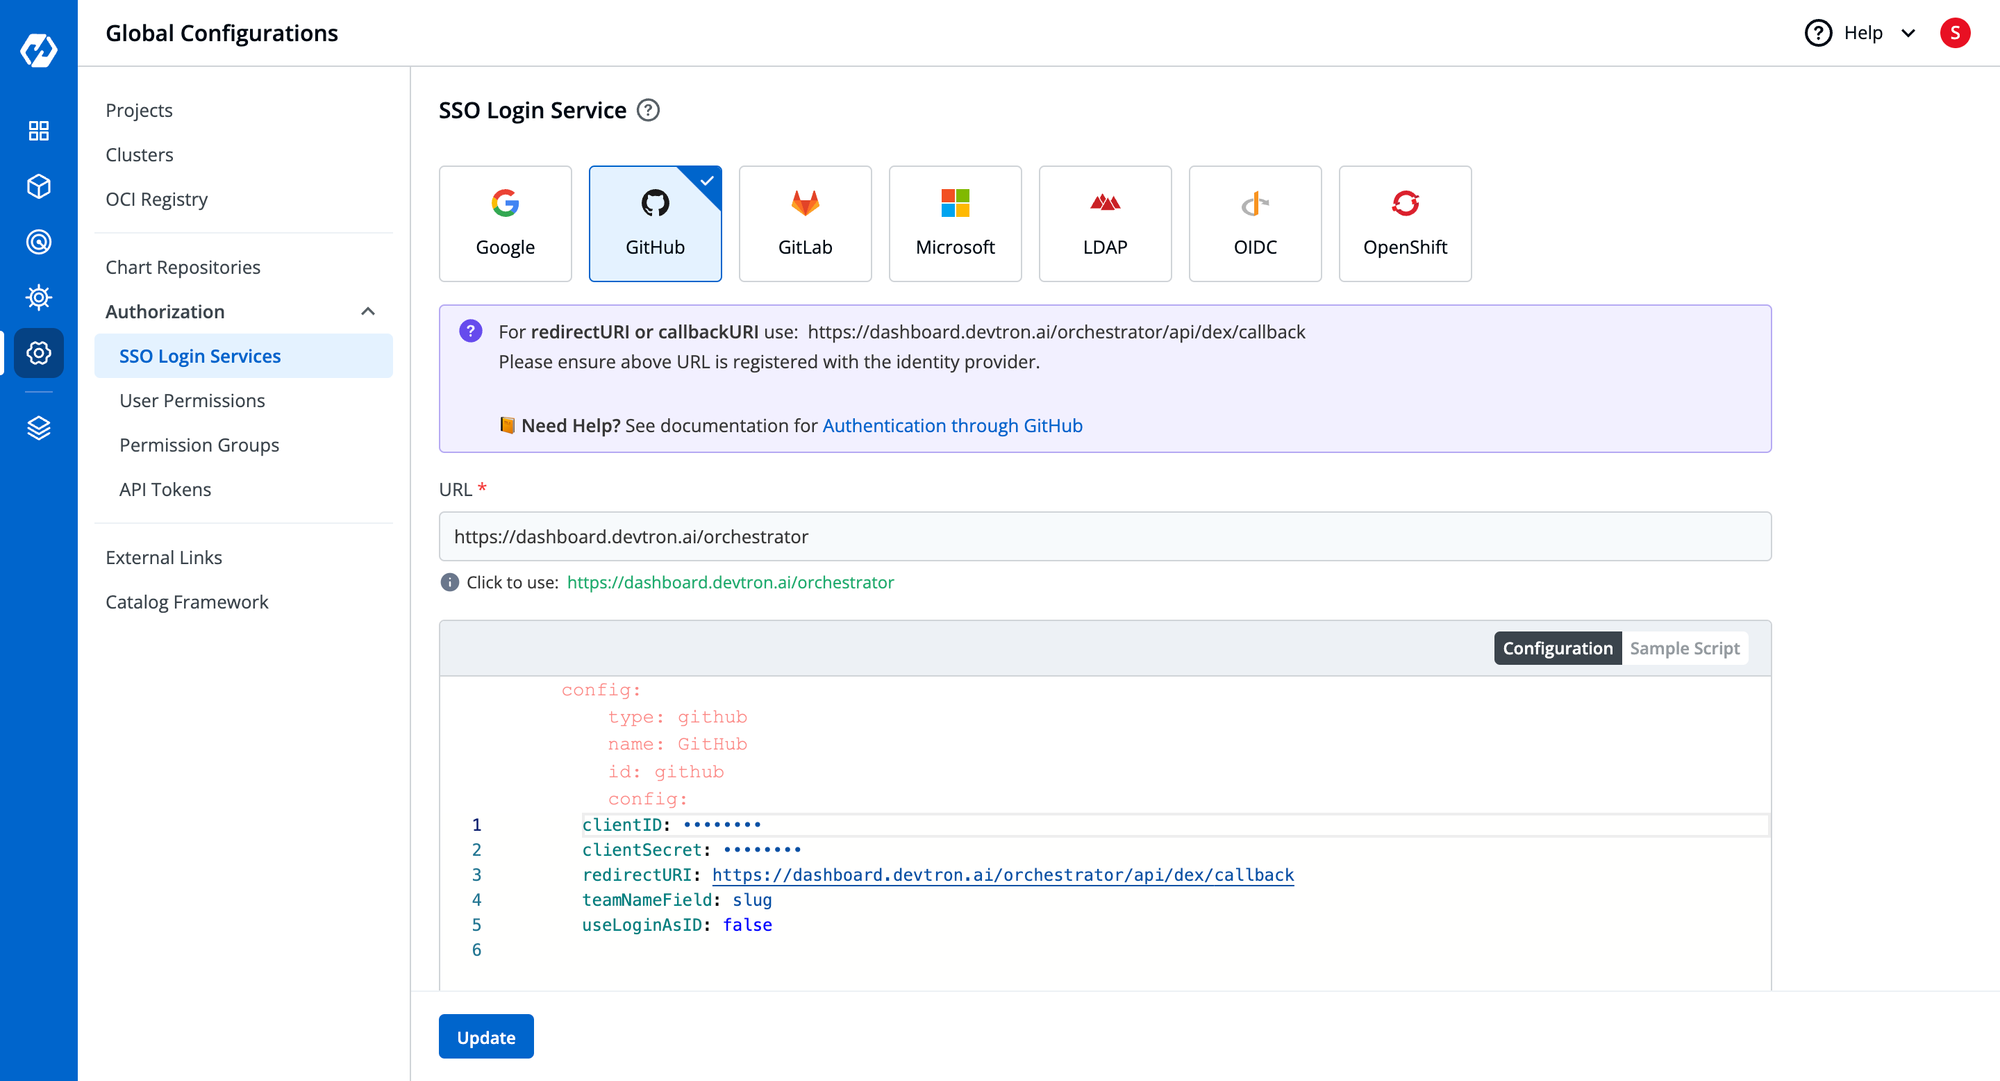
For the ease of accessing your Kubernetes infrastructure and to eliminate the headache of maintaining separate credentials for accessing Devtron’s dashboard, Devtron has support for Single Sign-On(SSO). Where you get seven SSO options to choose one whichever suits you and your teams.
| Capability | Devtron | Headlamp |
|---|---|---|
| SSO ( Github, Google, Gitlab, etc) | ✅ | ✅ |
| Kubernetes RBAC | ✅ | ✅ |
| RBAC for Dashboard Access | ✅ | ❌ |
| Time-based Access | ✅ | ❌ |
| Team Collaboration | ✅ | ✅ |
Integration with the Kubernetes Ecosystem
While Kubernetes is a very powerful tool for managing applications at scale, it doesn’t encompass all of the different scenarios and use cases that organizations require. At one point, it is crucial to integrate with some tools that exist within the Kubernetes ecosystem to enhance the Kubernetes cluster and add more capabilities. For example, you may want to use ArgoCD for enabling GitOps in the cluster, Prometheus for monitoring, KEDA for autoscaling the cluster, and many more.
A Kubernetes dashboard can leverage the broad Kubernetes Ecosystem and create integrations that enhance what the Dashboard can offer. With the right set of integrations, the Dashboard can evolve to fit the requirements of the different stages throughout the DevOps lifecycle.
Integrations in Headlamp
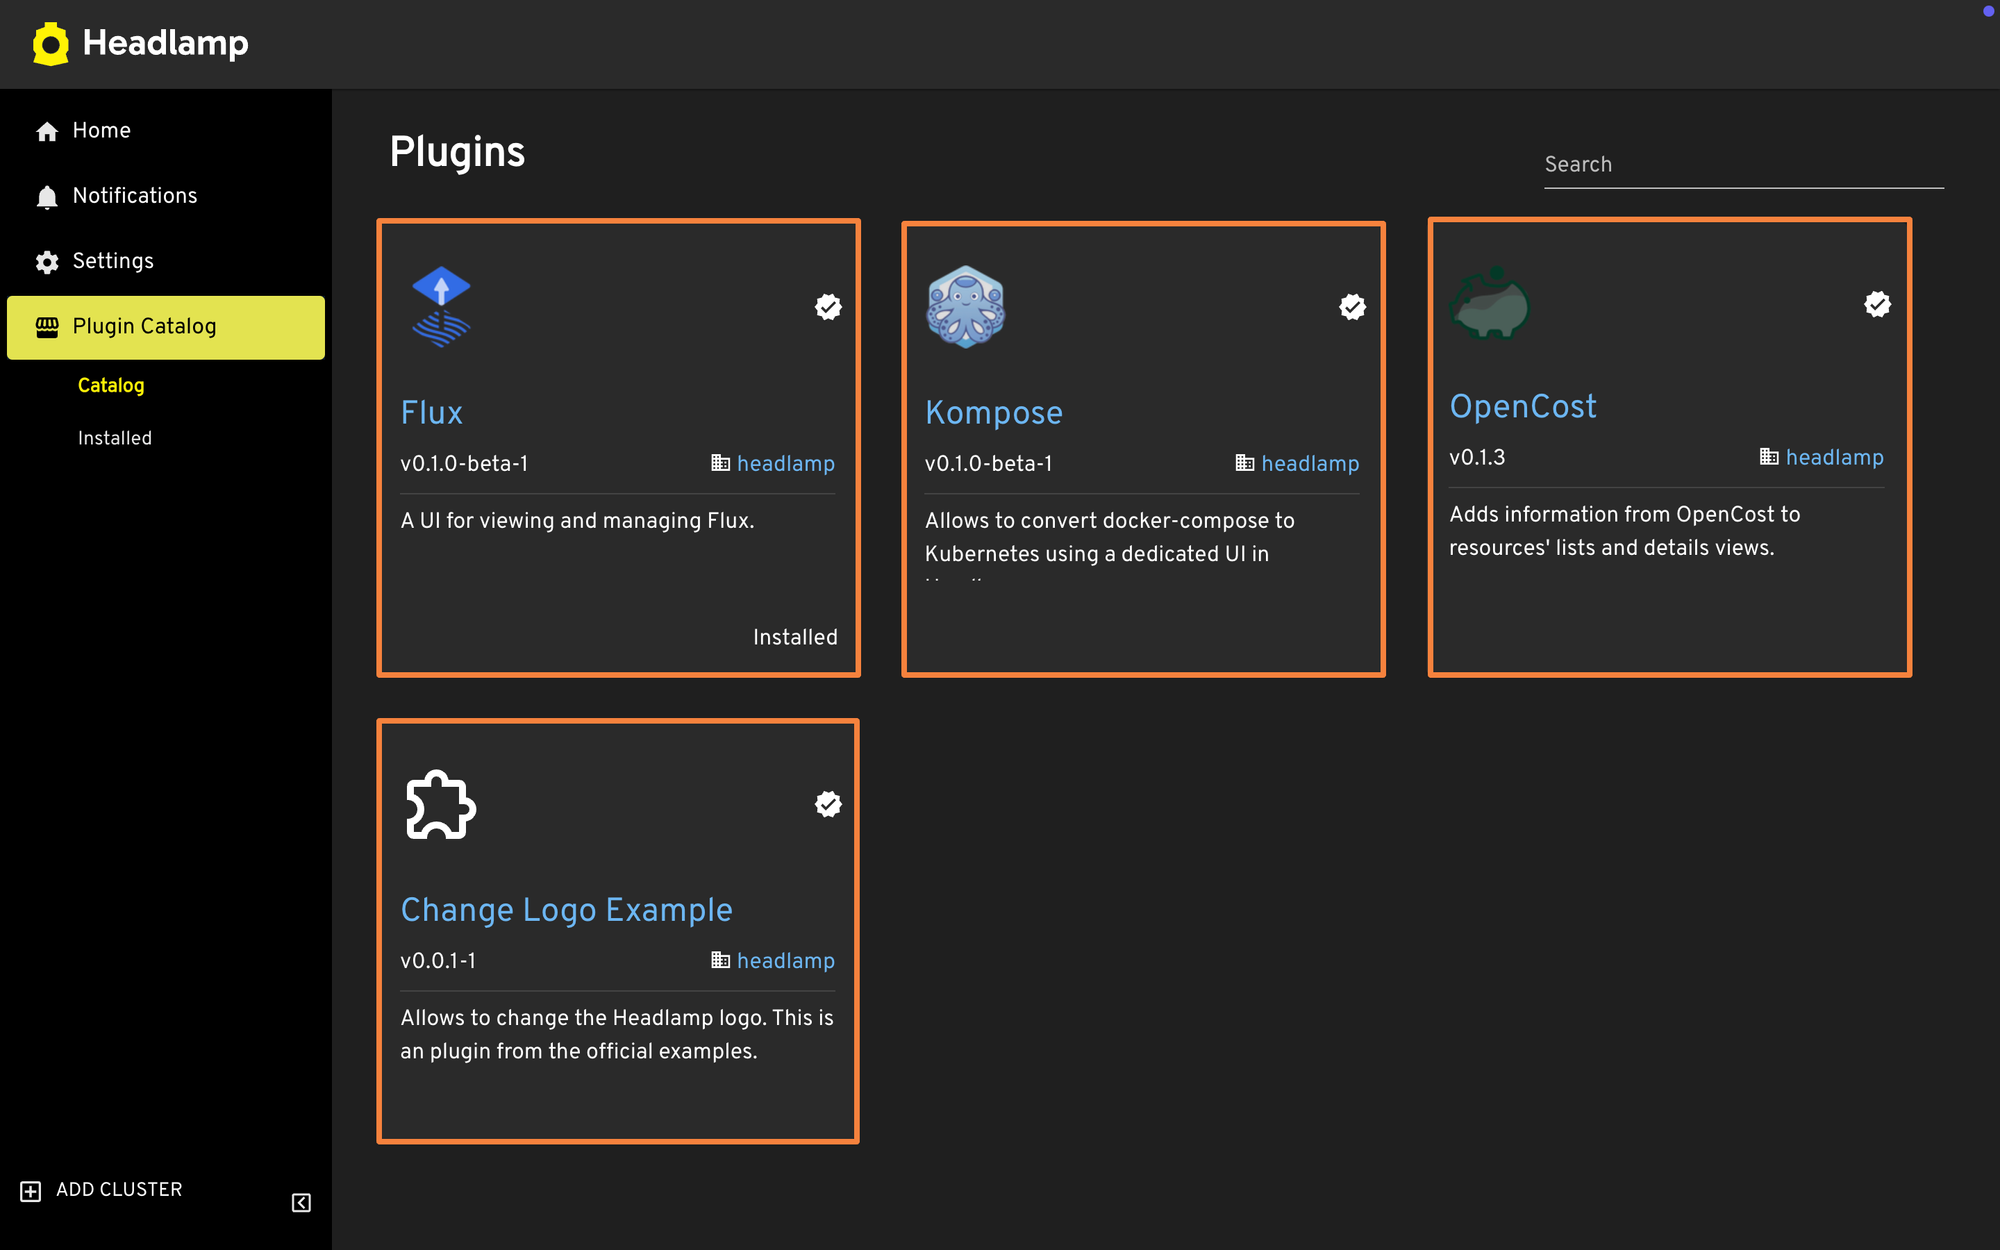
Headlamp has a very limited number of native integrations, namely Kompose, OpenCost, FluxCD, Prometheus, and an app catalog. If you want to integrate any other tool from the ecosystem, you can do so by using a Helm chart. Additionally, headlamp has a GitHub repository where you can see all the official plugins that are used or recommended for Headlamp.
Integrations in Devtron
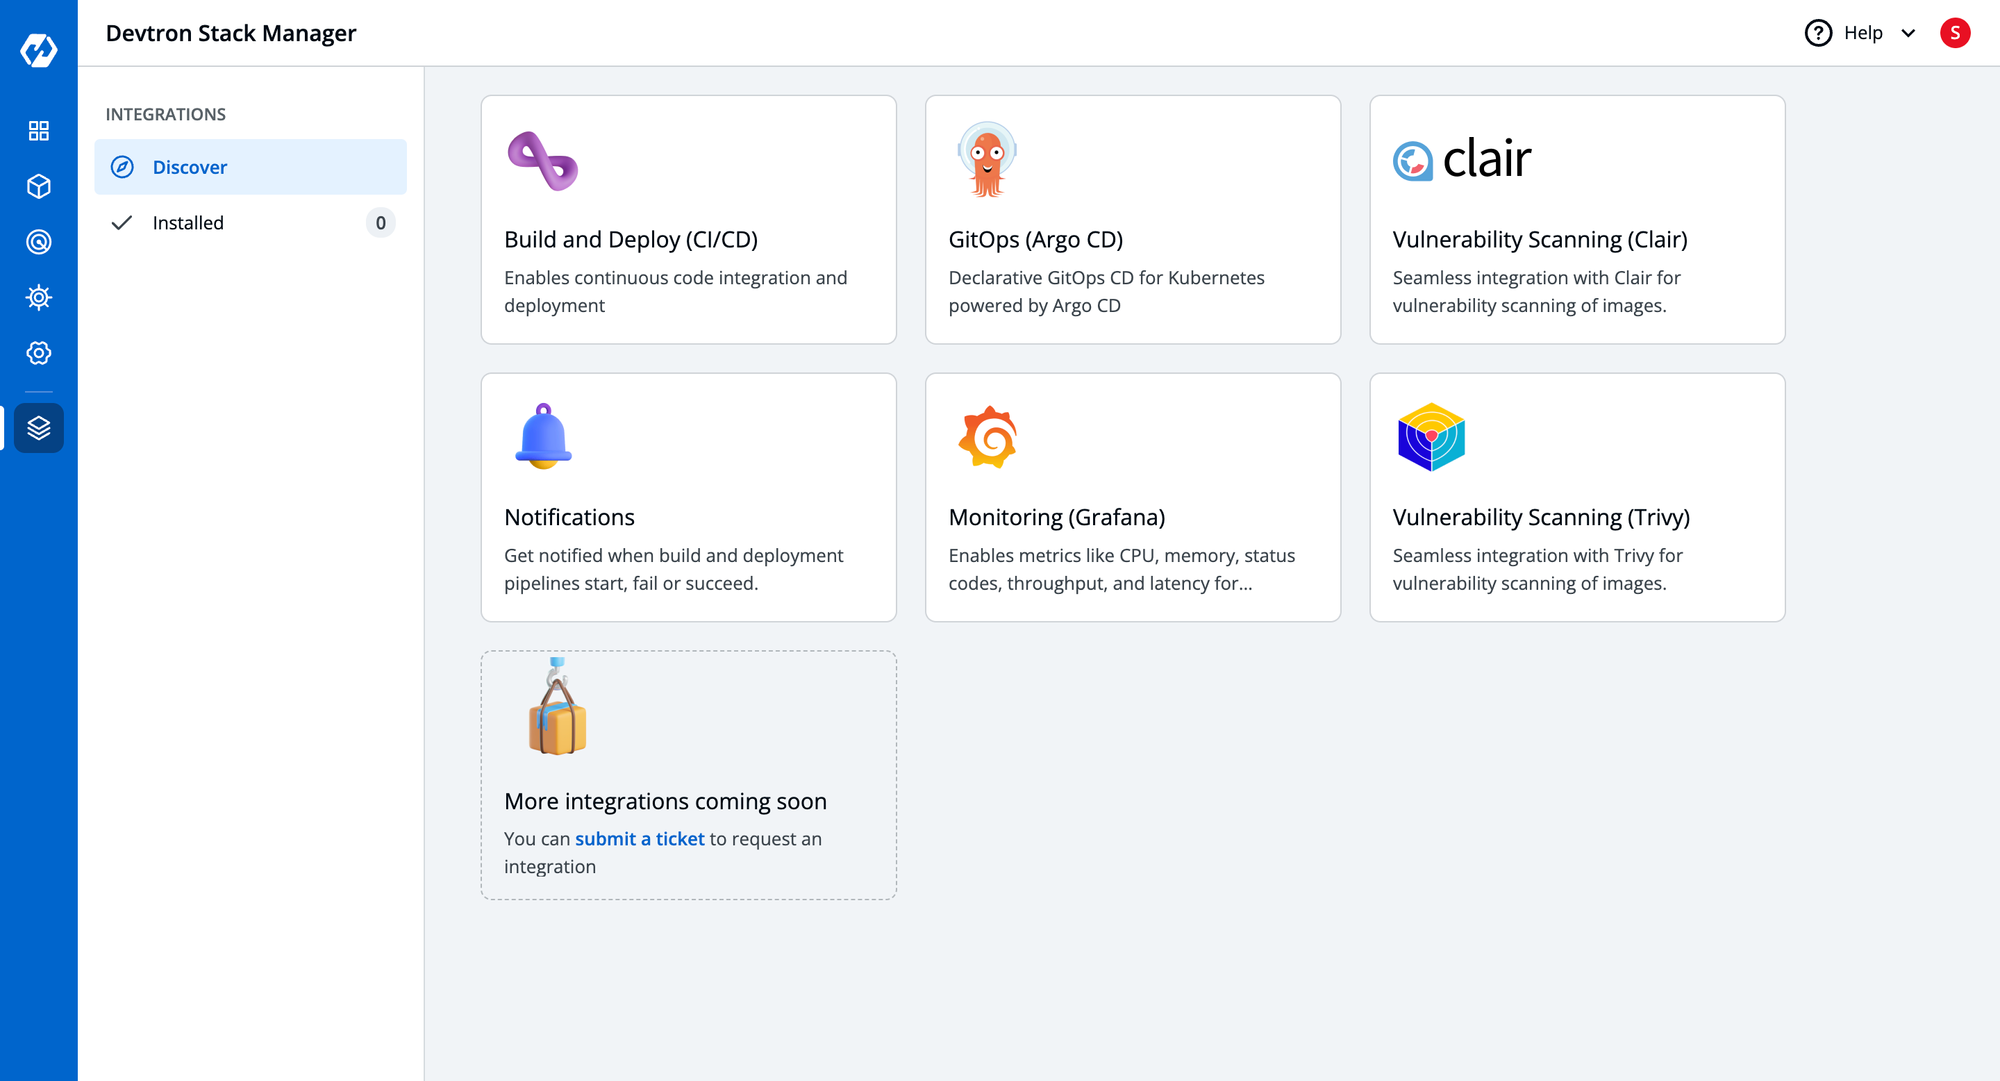
Devtron comes with a wide range of integrations, these integrations of Devtron take it from a Kubernetes dashboard to the single platform that you may require to manage your overall Kubernetes environments. The integrations of Devtron include Kubernetes native CI/CD for managing the application lifecycle, ArgoCD for facilitating GitOps-based deployments, support of Trivy and Clair for DevSecOps, Monitoring stack, and Notification. With enabling these integrations you can deploy your source code through CI/CD, manage the configuration through GitOps, ensure the security of applications with DevSecOps, and enable Monitoring and Notifications for your applications, moreover, you already have a Kubernetes dashboard to manage the Kubernetes infrastructure.
| Capability | Devtron | Headlamp |
|---|---|---|
| Integrations for CI/CD | ✅ | ❌ |
| Integrations for Security Scanning | ✅ | ❌ |
| Integrations for custom event notifications | ✅ | ❌ |
| Integrations with Helm Charts | ✅ | ✅ |
| Integrations for Cost Visualization | ✅ | ✅ |
| Integrations for Docker Compose | ❌ | ✅ |
GitOps Management
Both Devtron Dashboard and Headlamp were not designed to create and deploy applications with an entire CI/CD pipeline. However, both tools provide support to view applications that have been deployed with GitOps principles. Both tools have support for viewing workloads that have been deployed on the cluster but are limited when it comes to management capabilities. Let’s take a look at how both Kubernetes dashboards manage GitOps applications.
GitOps Management in Headlamp
Headlamp out of the box does not have any support for viewing or managing GitOps-based workloads. However, with the help of the Headlamp integrations, it can be configured to get visibility for the different FluxCD applications.
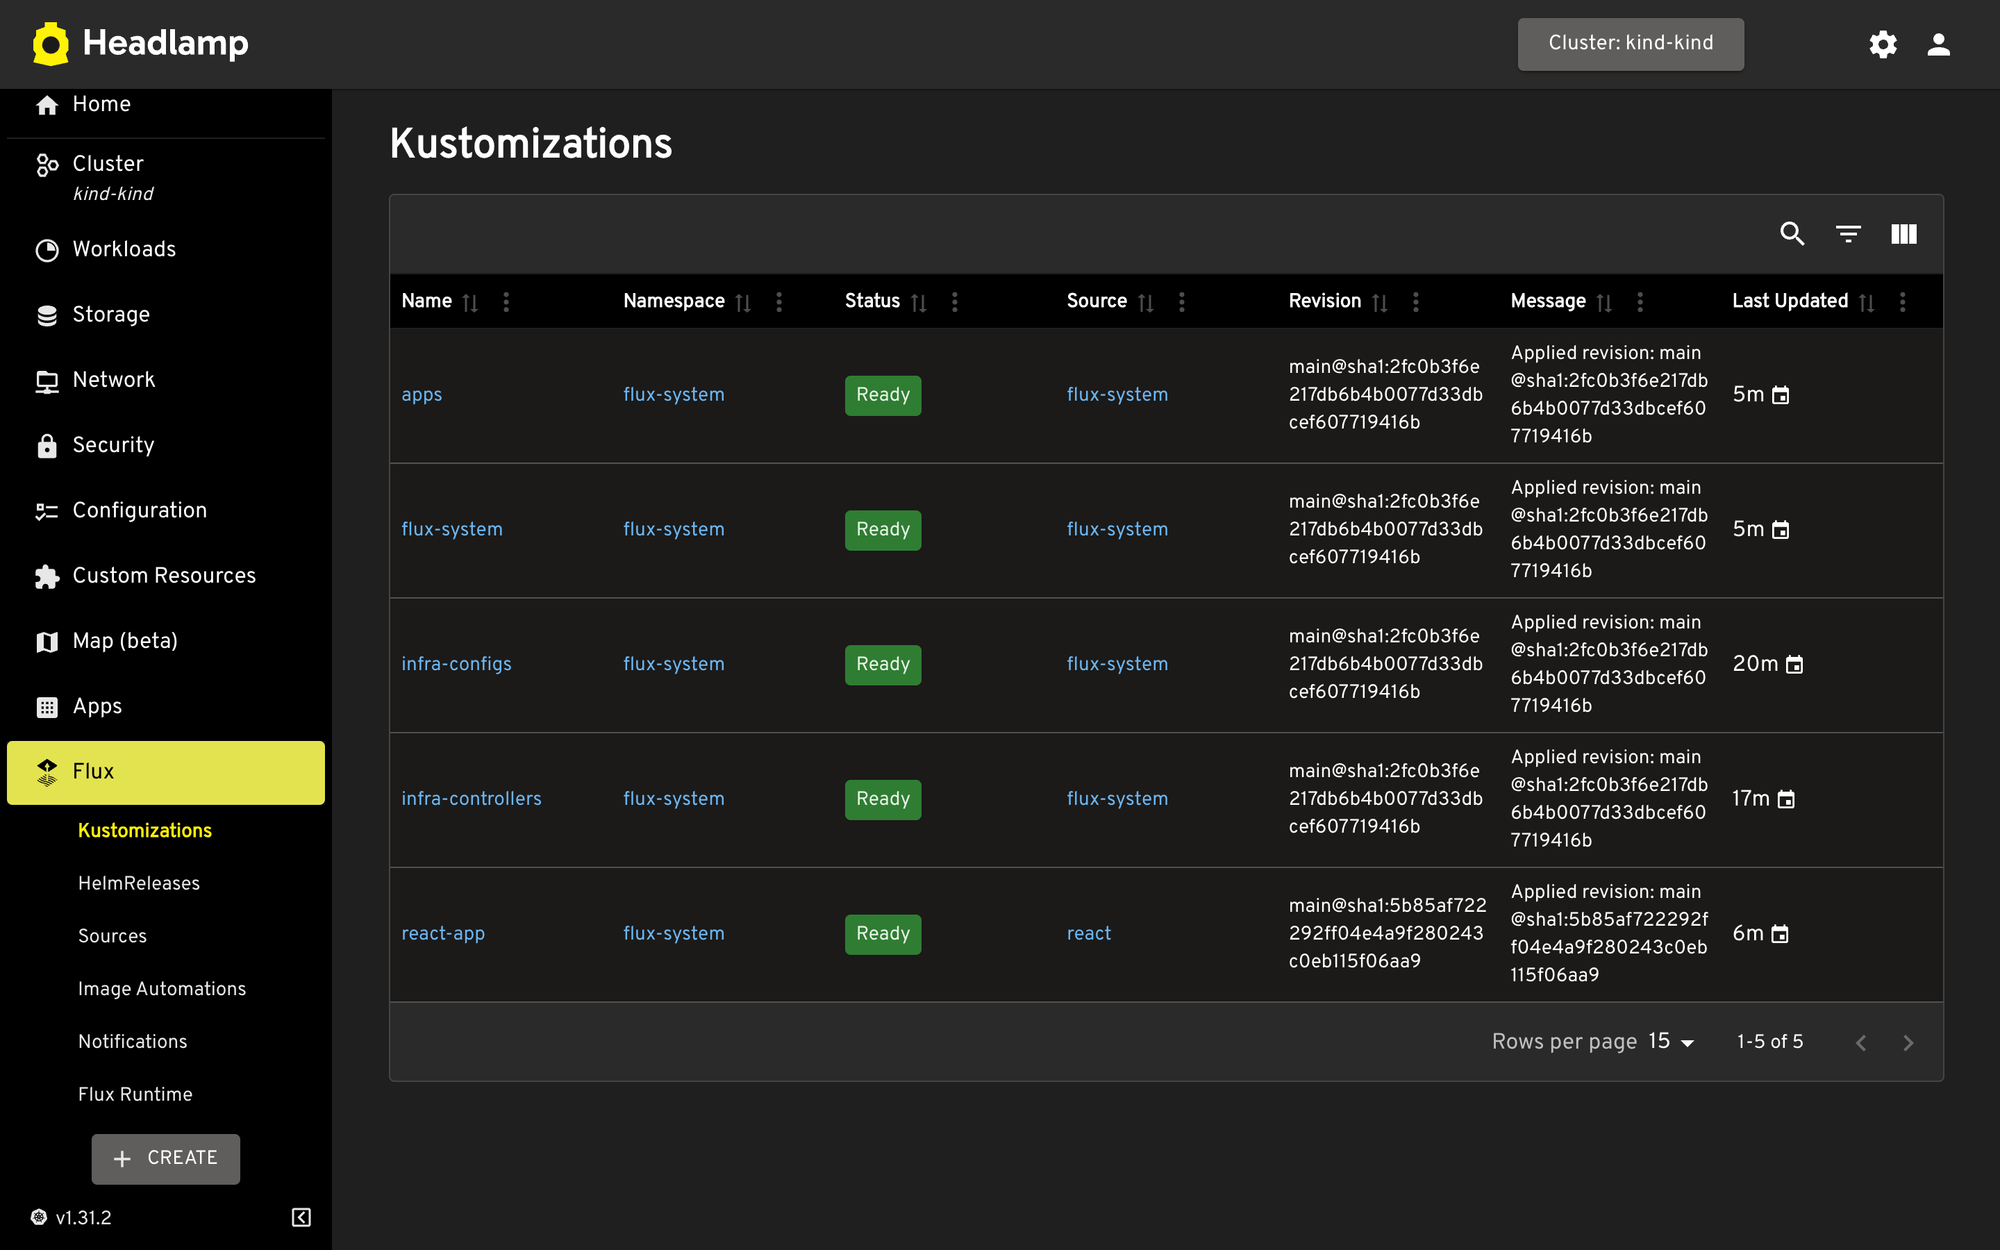
After installing the FluxCD Integration, you can see a new Flux tab within the cluster view. You can see the different FluxCD resources such as Kustomizations, HelmReleases, Sources, Image Automation, Notifications, and the Flux Runtime resources. This is providing visibility into all the different FluxCD resources.
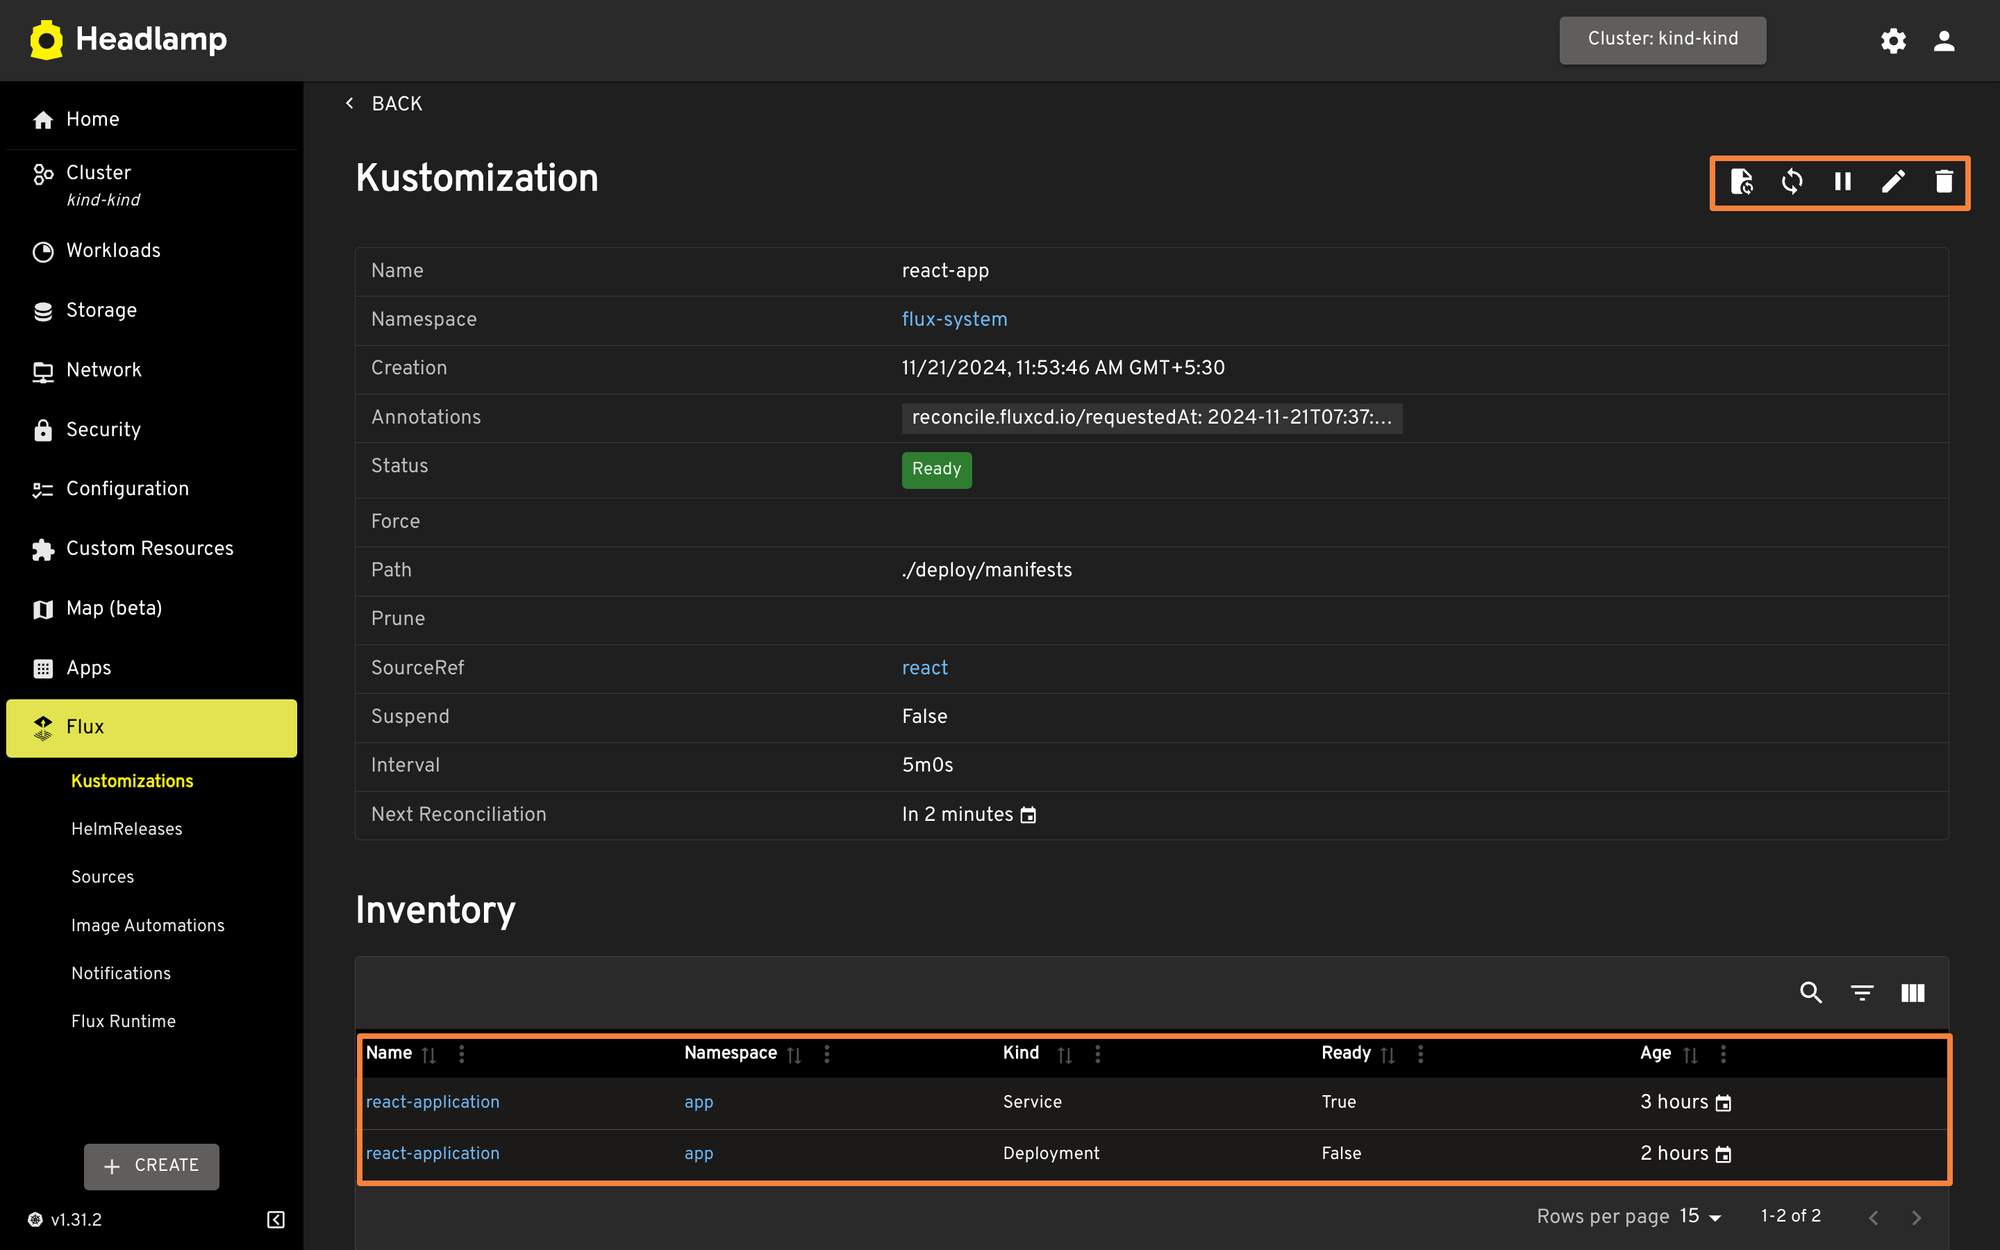
You can click on any of the Kustomization resources to get more information about the different resources deployed in the cluster. For example, within the react-app you can view the different configurations for the Kustomize as well as the resources that are deployed with this Kustomization resource such as the service and deployment. You can also manually trigger a sync which will sync the state of the deployments in the cluster with the state of the configuration files present in either the Git repository or with the Kustomize resource. Headlamp also lets you edit the Kustomization and HelmRelease resources from the dashboard itself.
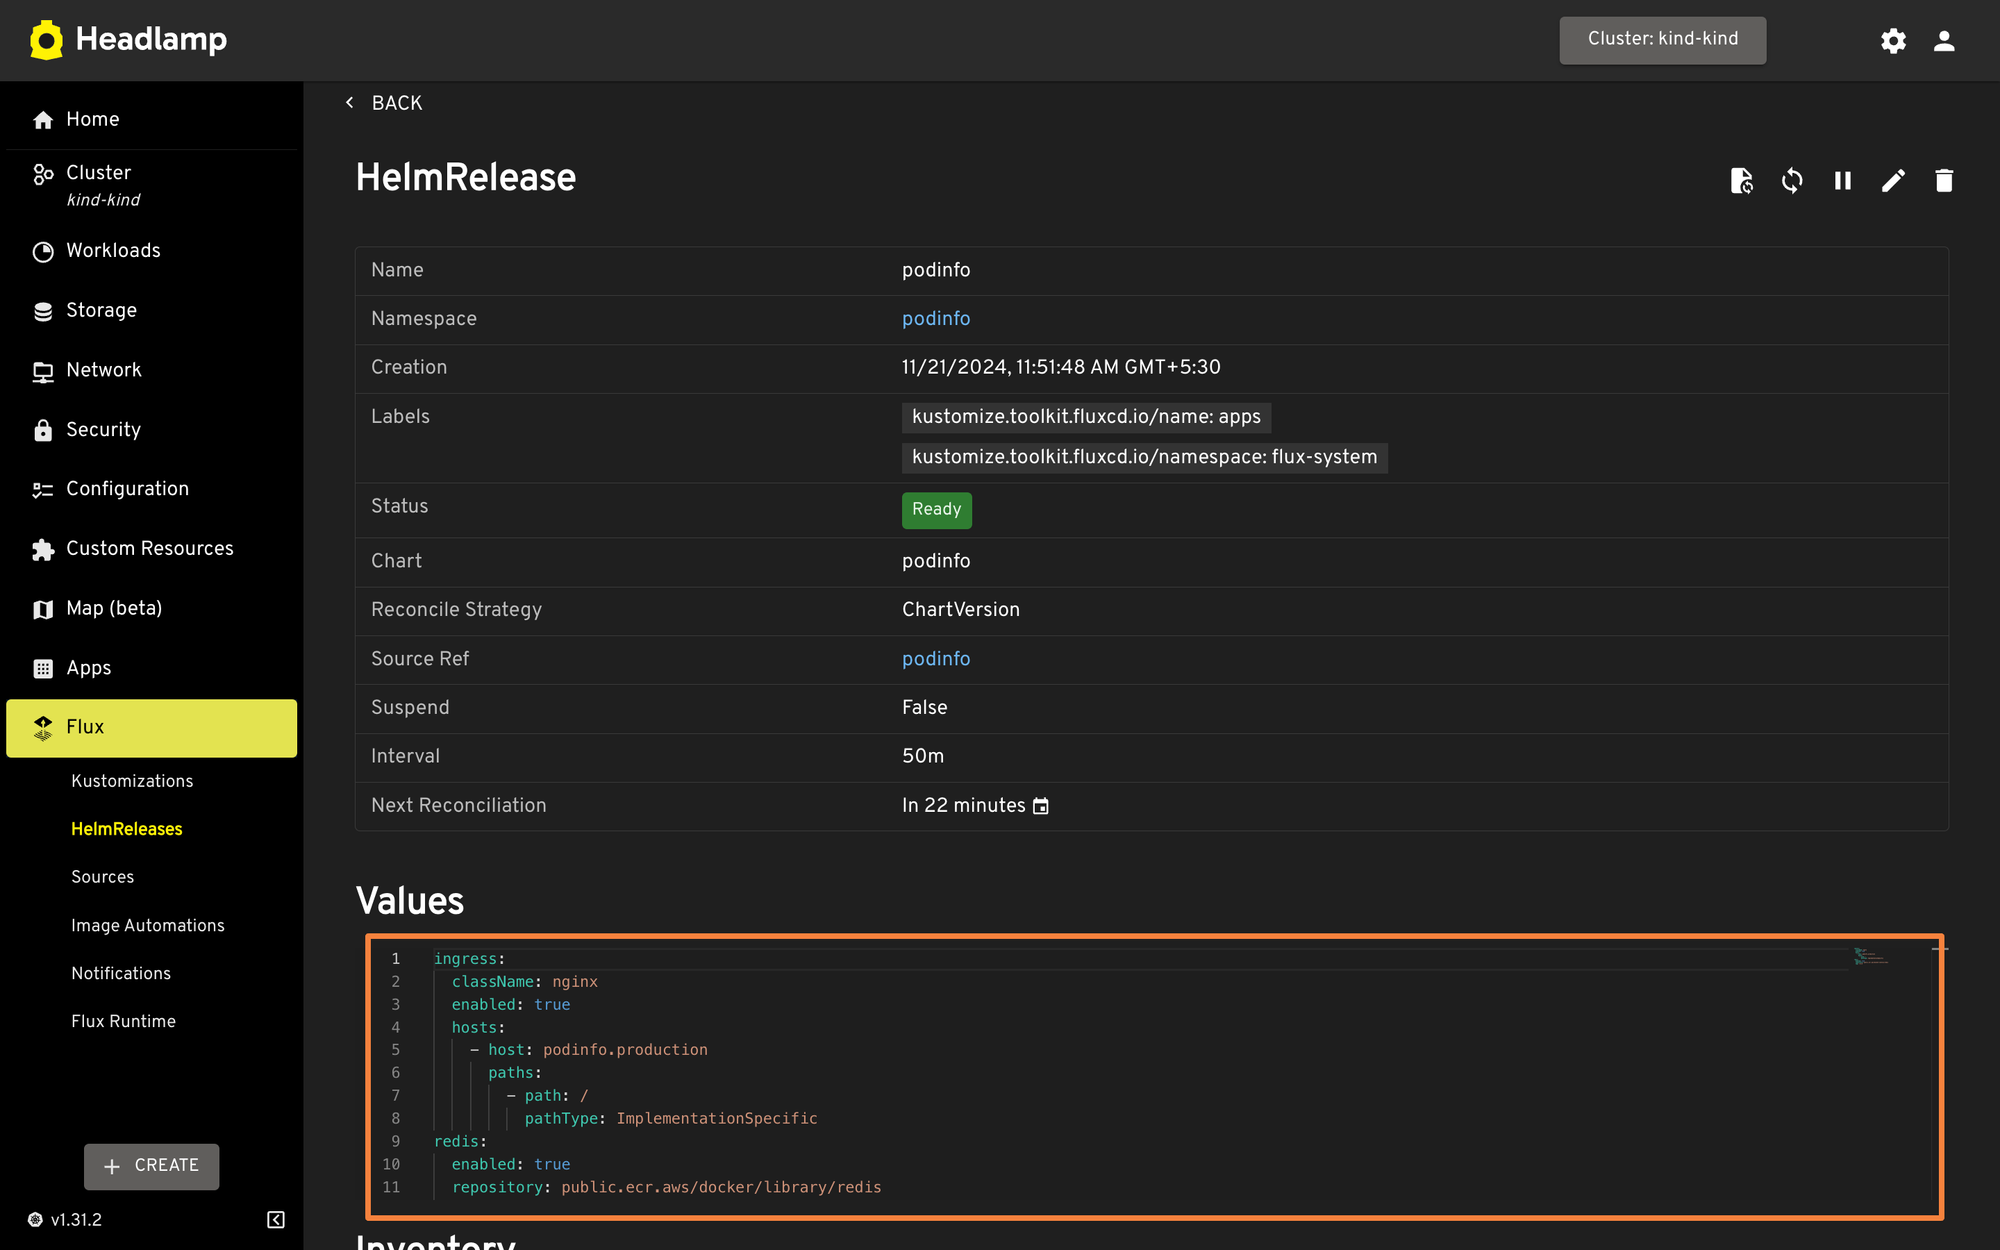
Similar to the Kustomization resources, Headlamp shows all the different HelmReleases resources deployed in the cluster. Expanding the HelmRelease resources shows useful information about the deployed chart including the values configured for the HelmChart. You can configure the values file for the Helm resource from this dashboard page.
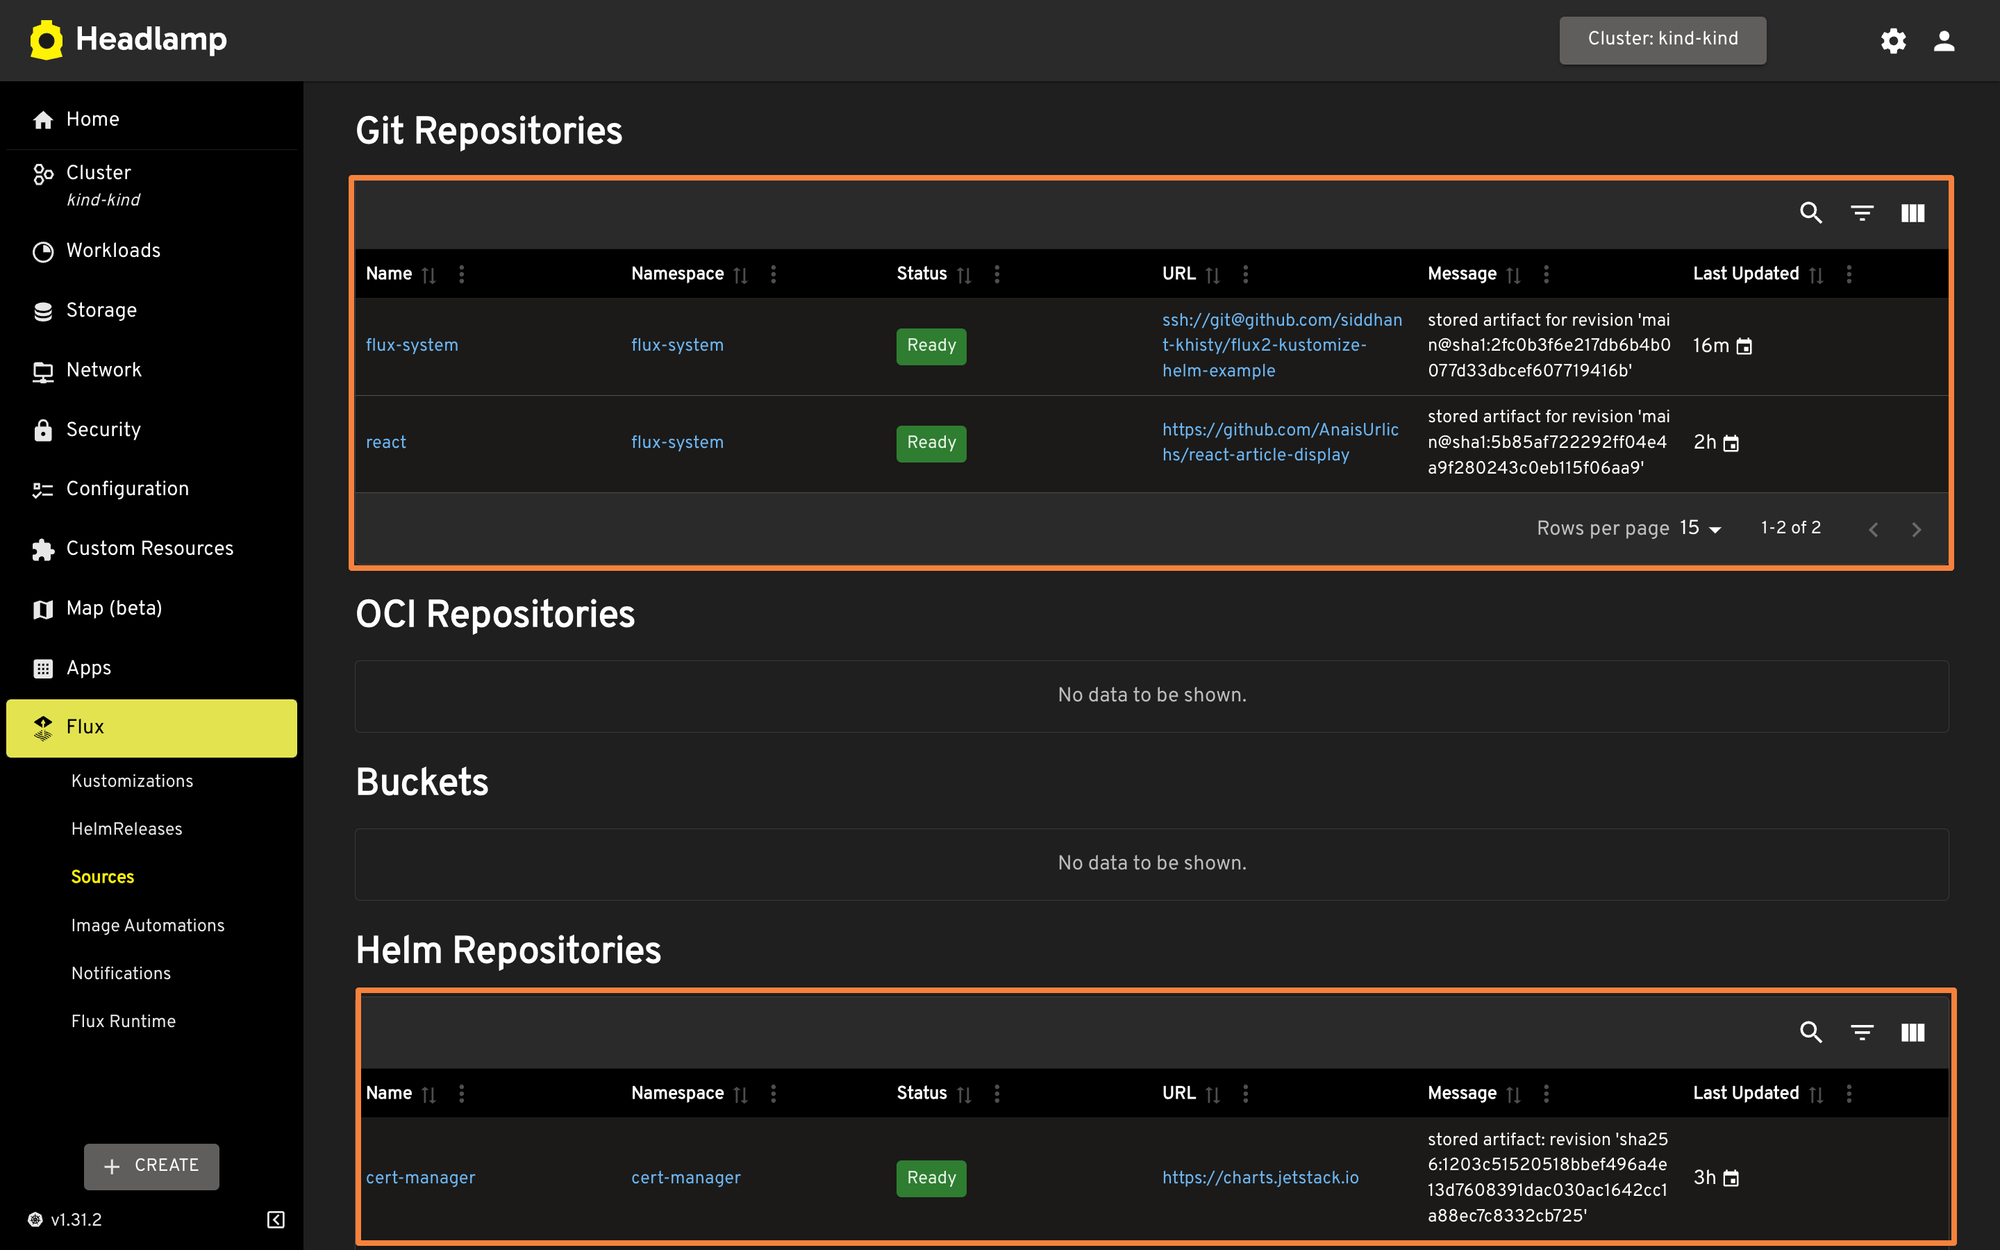
The sources tab shows you all the different sources that FluxCD is using to sync the resources to the cluster. It displays the different sources such as Git Repositories, OCI Repositories, Buckets, Helm Repositories as well as Helm Charts. Similar to the previous resources, you can click the different sources to view additional information about them, as well as trigger a manual sync.
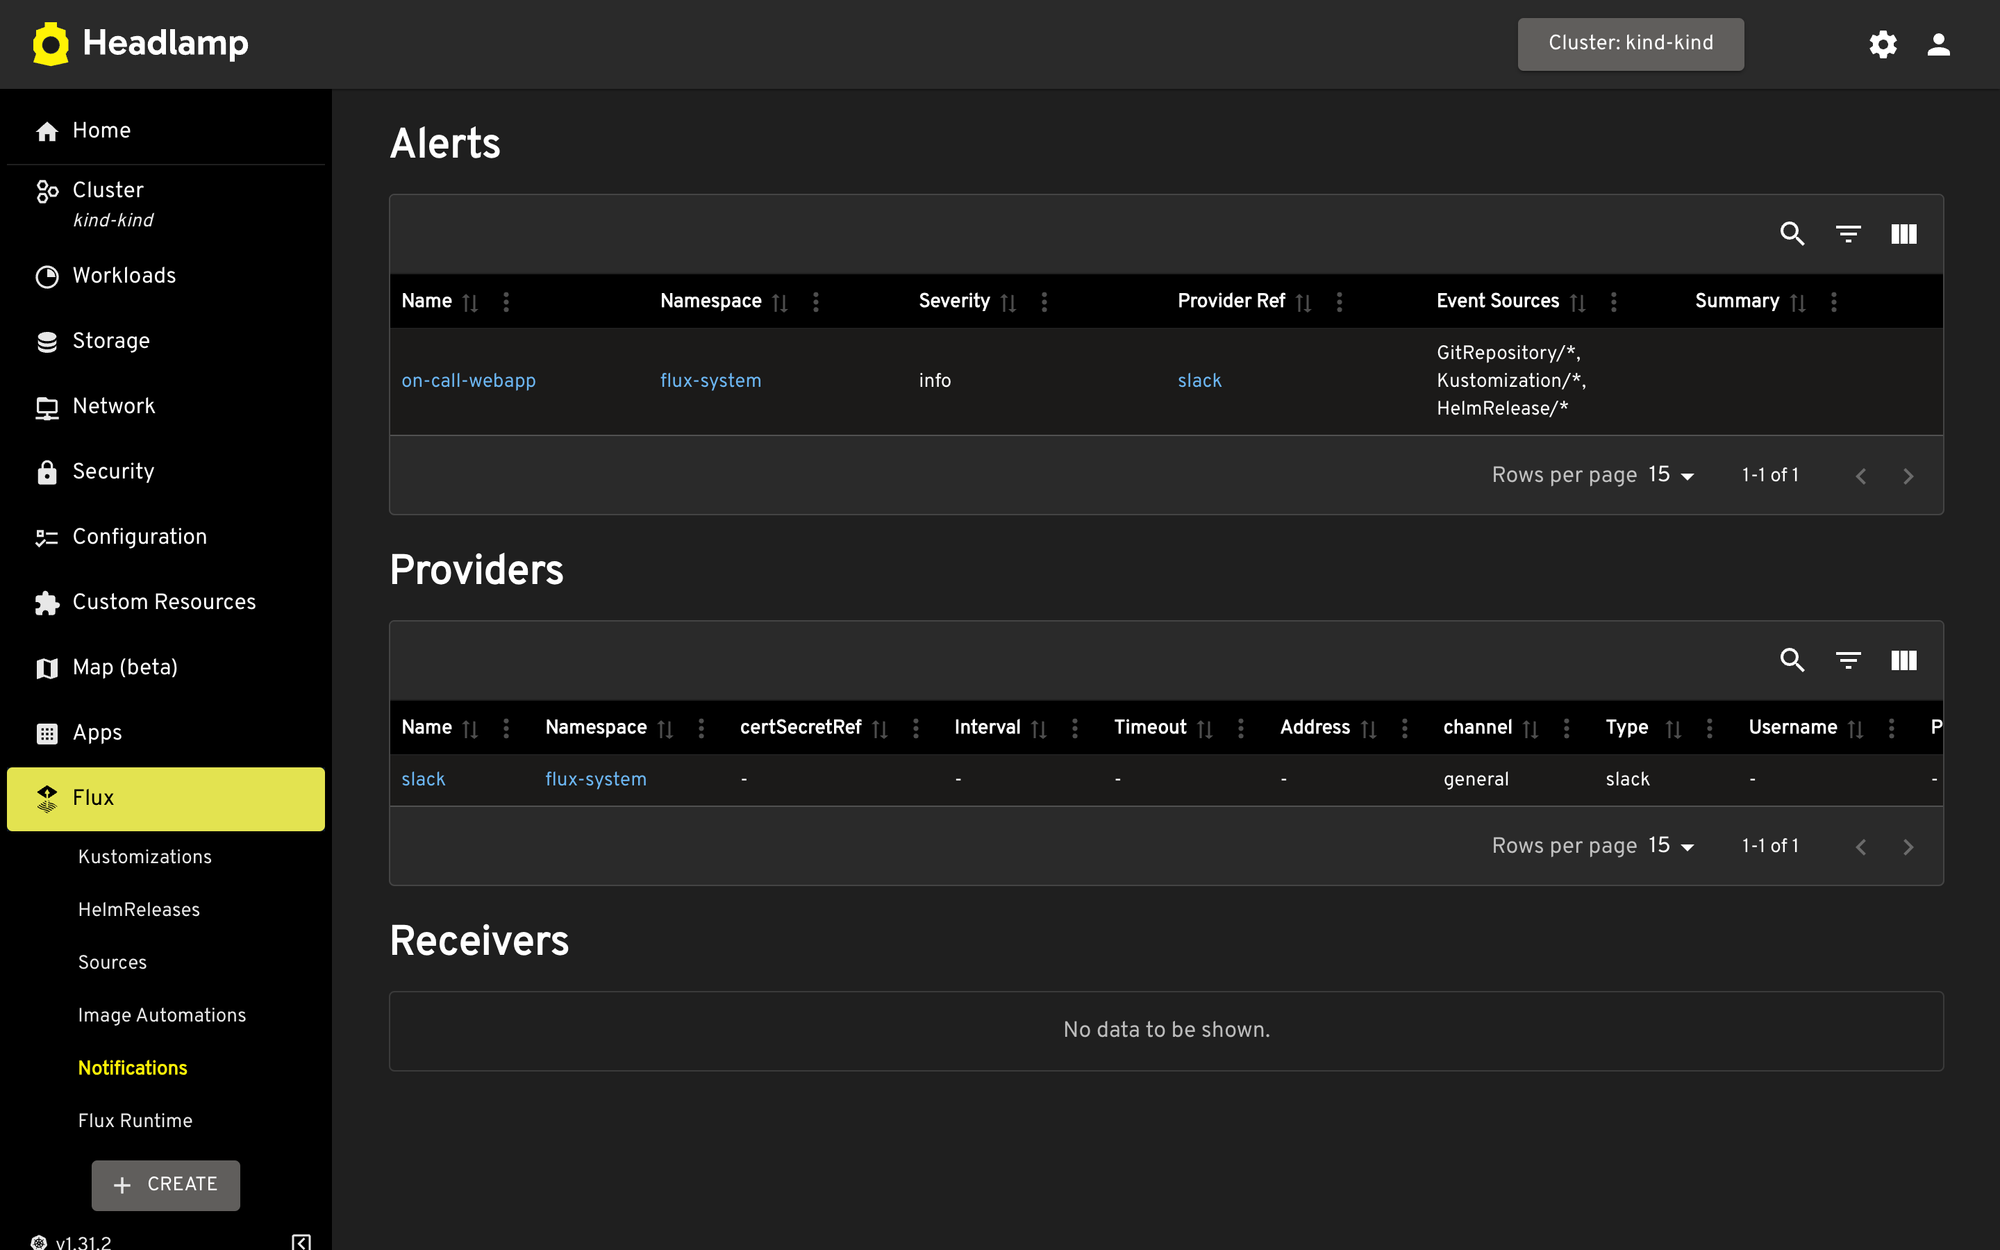
Additionally, Headlamp also shows a list of all FluxCD alerts that have been created and configured in the Notifications tab. You can get insights into the different alerts, providers, and receivers that have been configured within the cluster. Headlamp also provides visibility into the different image automation configured and the resources of the Flux runtime.
While FluxCD shows all of the FluxCD resources that are being used to manage the Flux applications, it is very difficult to co-relate all the applications that are deployed by the resources. For example, if you wanted to view all the Kubernetes resources deployed either by the Kustomize or HelmReleases, you will need to navigate to the workloads tab and find the individual resources which leads to context switching.
GitOps Management in Devtron
Devtron Dashboard provides support for ArgoCD as well as FluxCD resources out of the box. You can monitor all the different applications that have been deployed with both ArgoCD and FluxCD across multiple clusters in a single centralized dashboard.
When ArgoCD is deployed in multiple different clusters, there are a few different ways to manage the ArgoCD instances. You can learn about the different architectural patterns for ArgoCD in this blog. When you deploy the ArgoCD instances on multiple clusters, it gets difficult to view the applications deployed on multiple clusters. You would have to switch between multiple dashboards to view the ArgoCD resources. With Devtron, you can connect all the clusters to a single central Devtron dashboard, and get visibility into all of the different ArgoCD applications deployed across all the clusters, as well as filter the applications based on the clusters and namespaces.
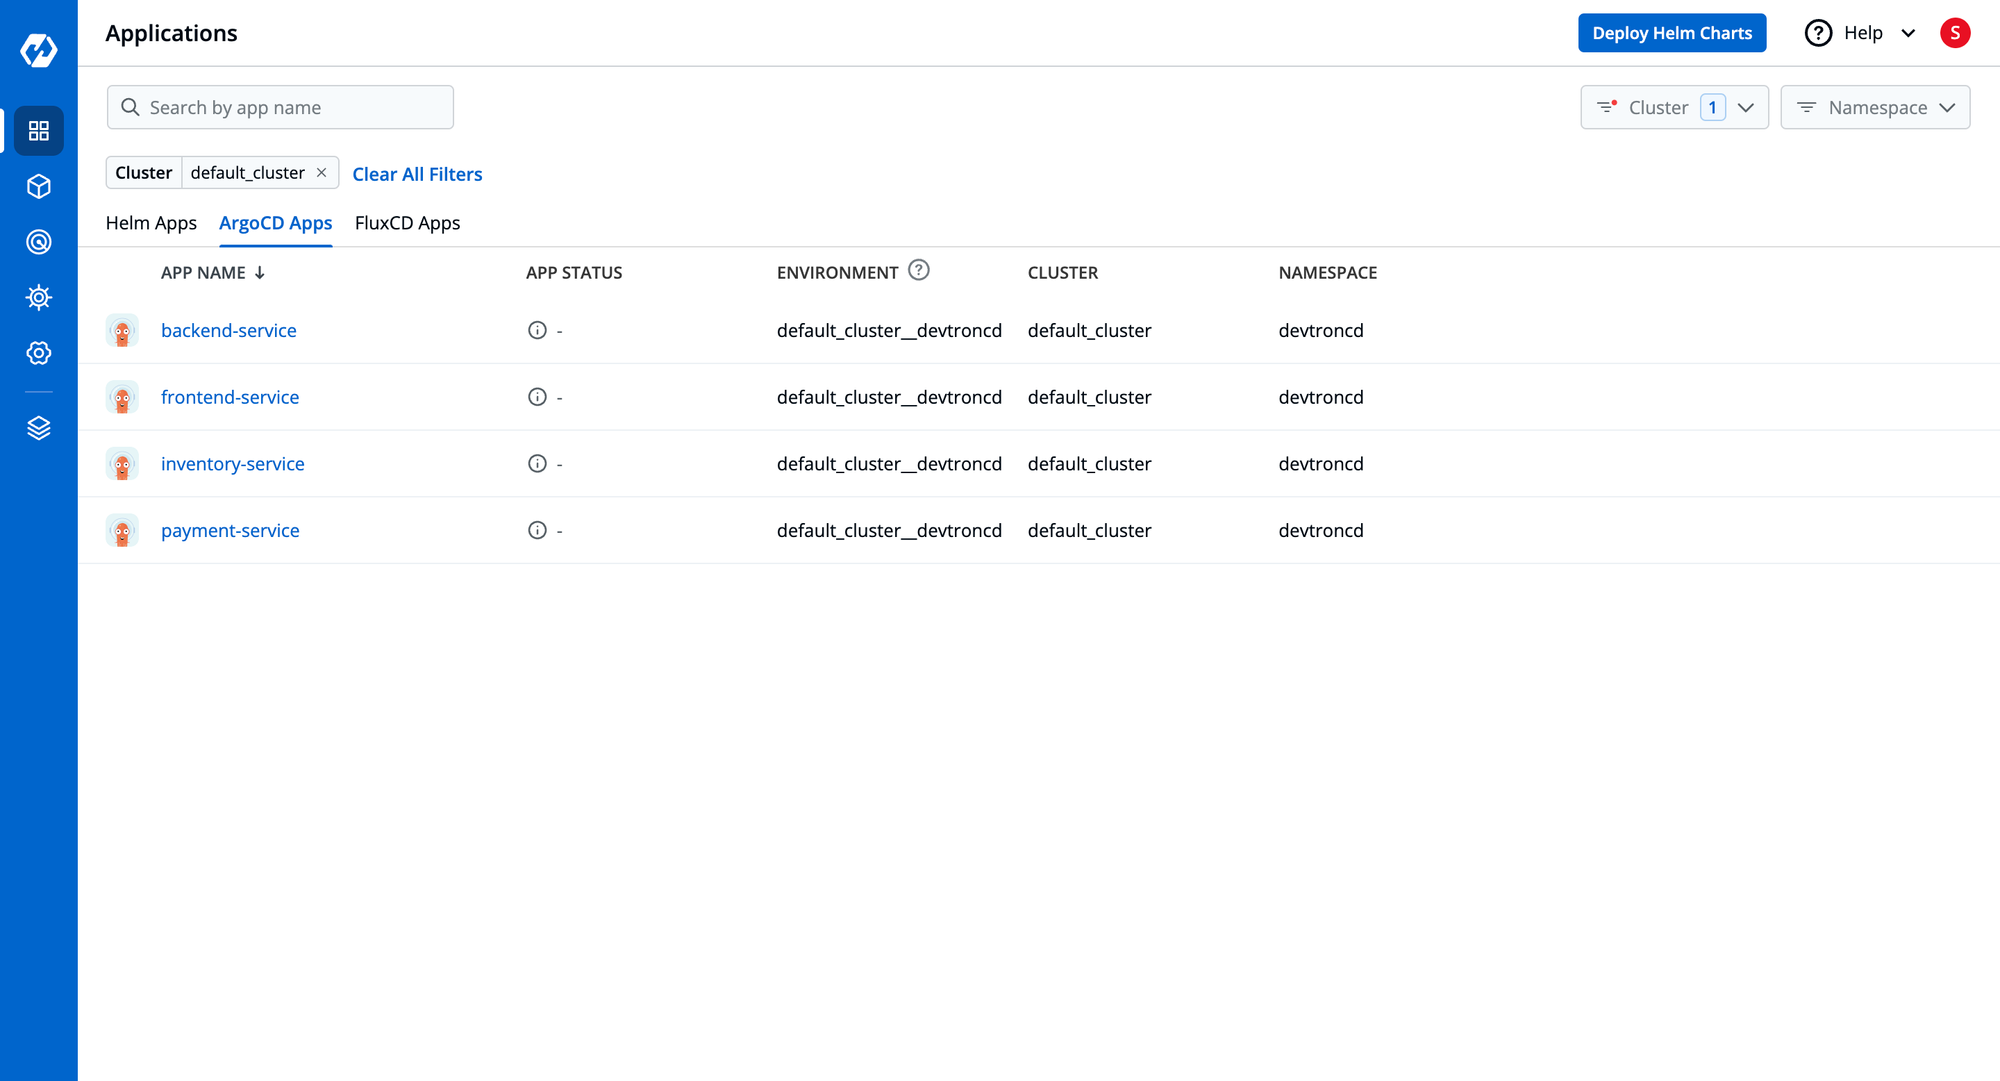
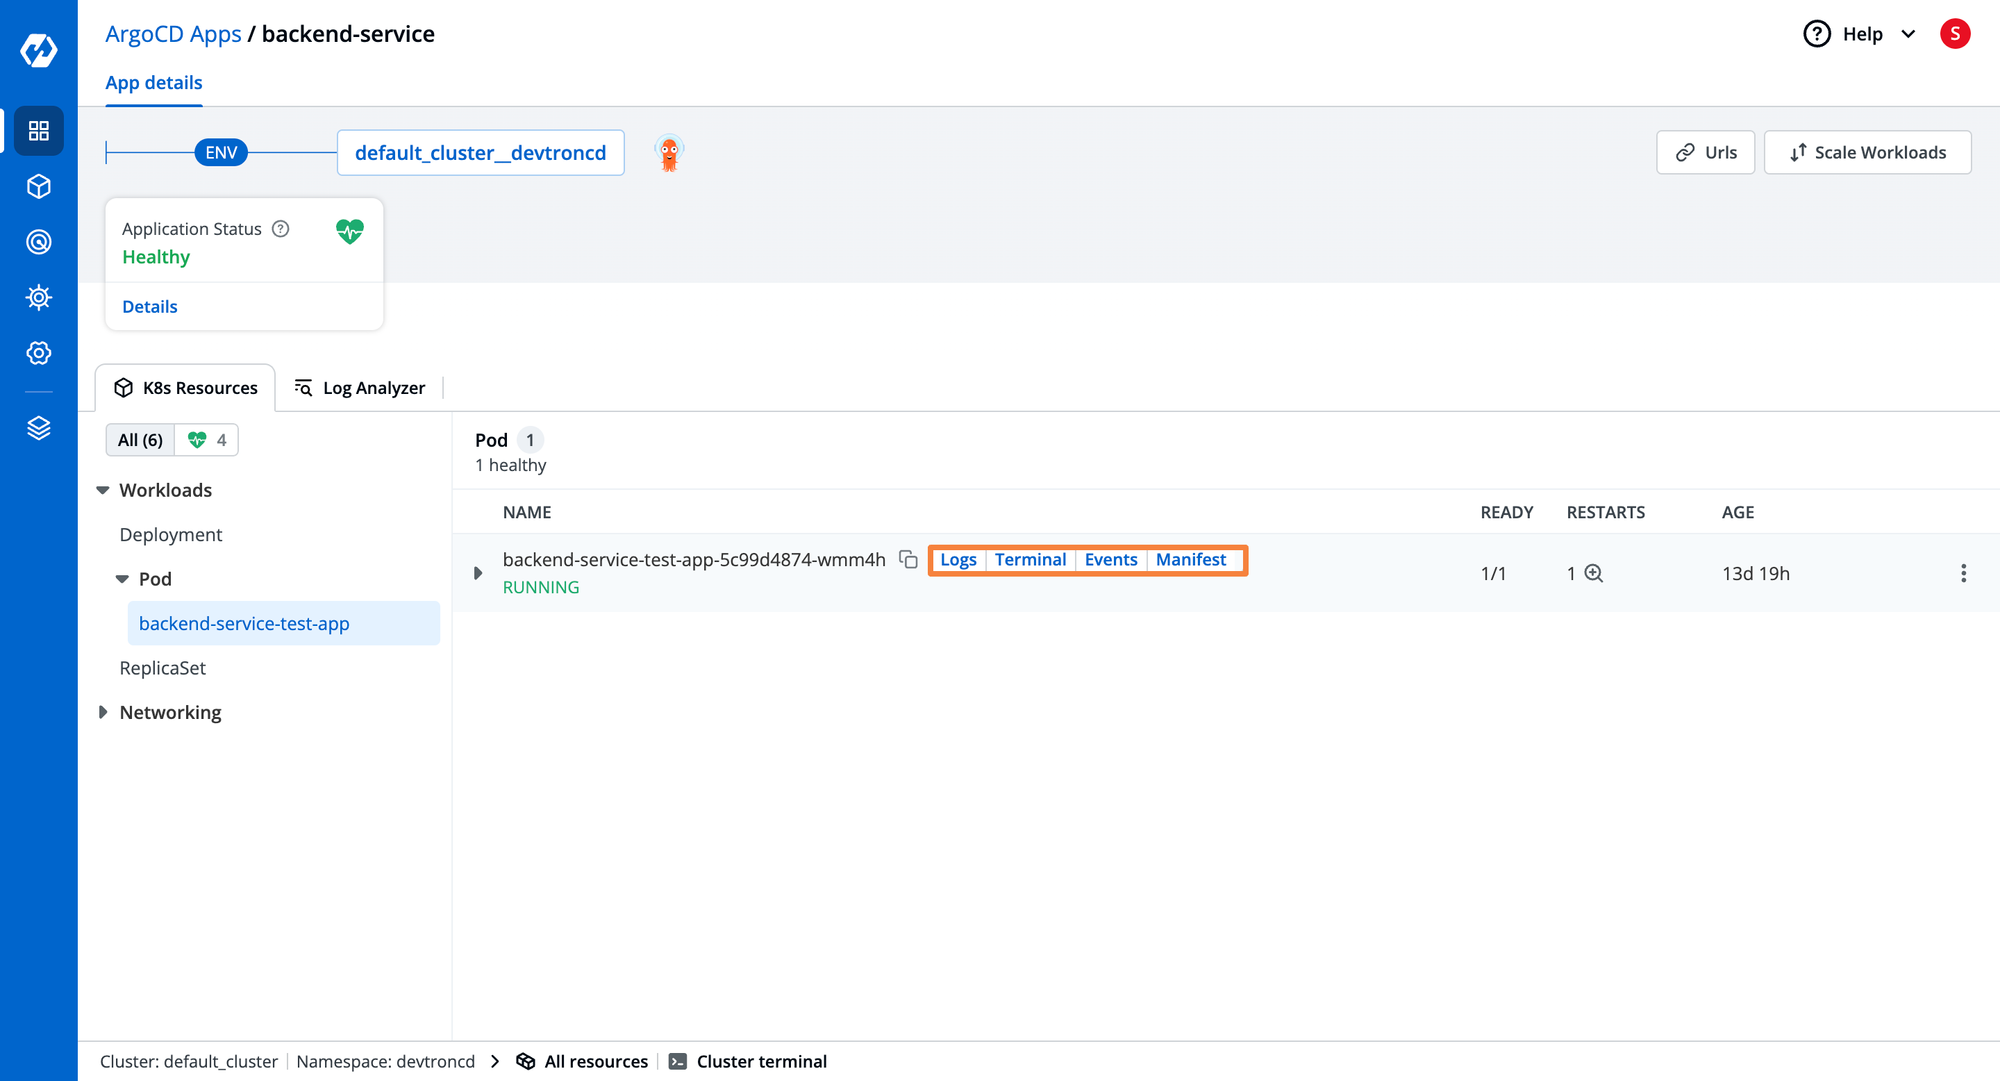
Within the ArgoCD application, you can see all the different resources that are deployed such as the different deployments, pods, services, etc, and all these resources are grouped into their specific logical sections. You can also view the pod’s manifest, logs, and events from the Devtron dashboard. If you wish to run any actions within the pod, Devtron also provides functionality to open a terminal within the pod and run commands.
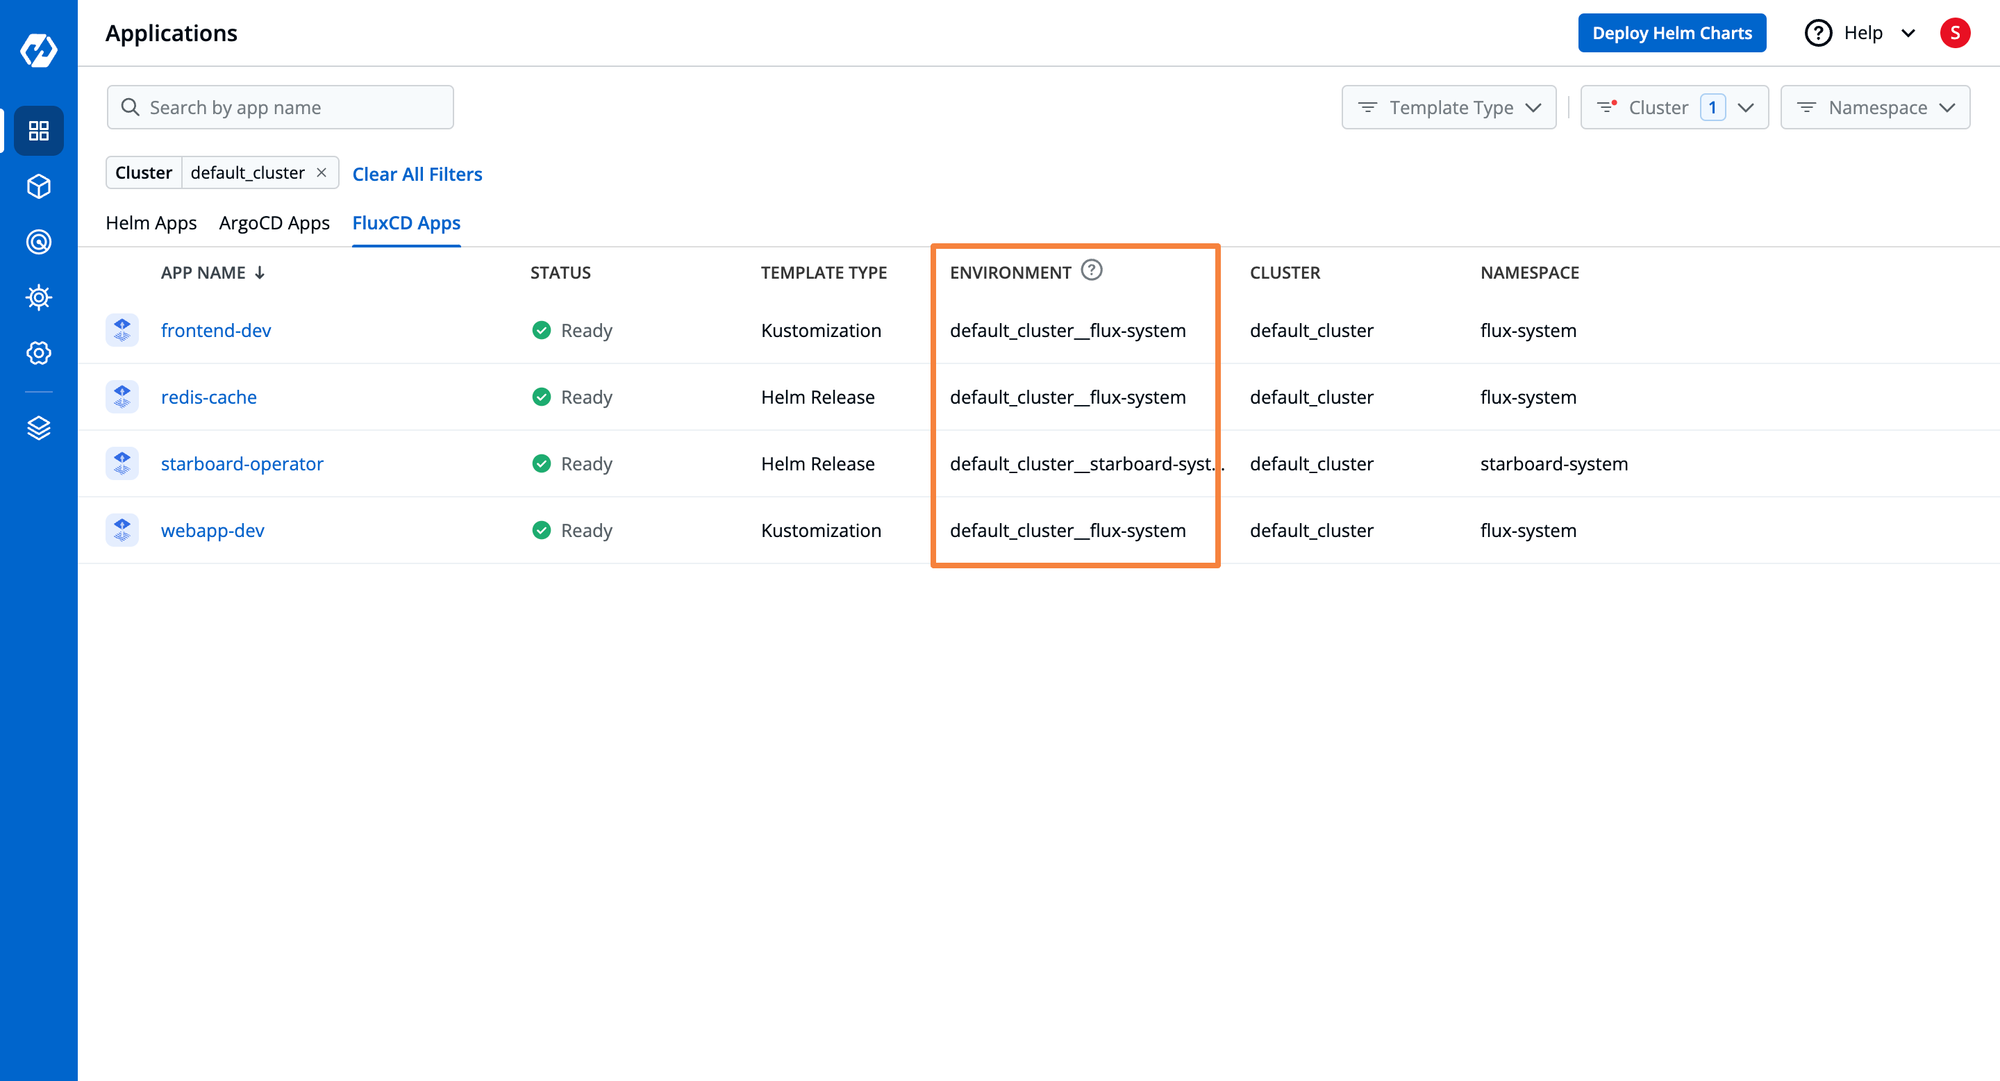
Similarly, Devtron can help you visualize all the different applications deployed on various clusters using FluxCD. You can also get insights into how the resource was deployed, whether using a Kustomization Resource or a HelmRelease.
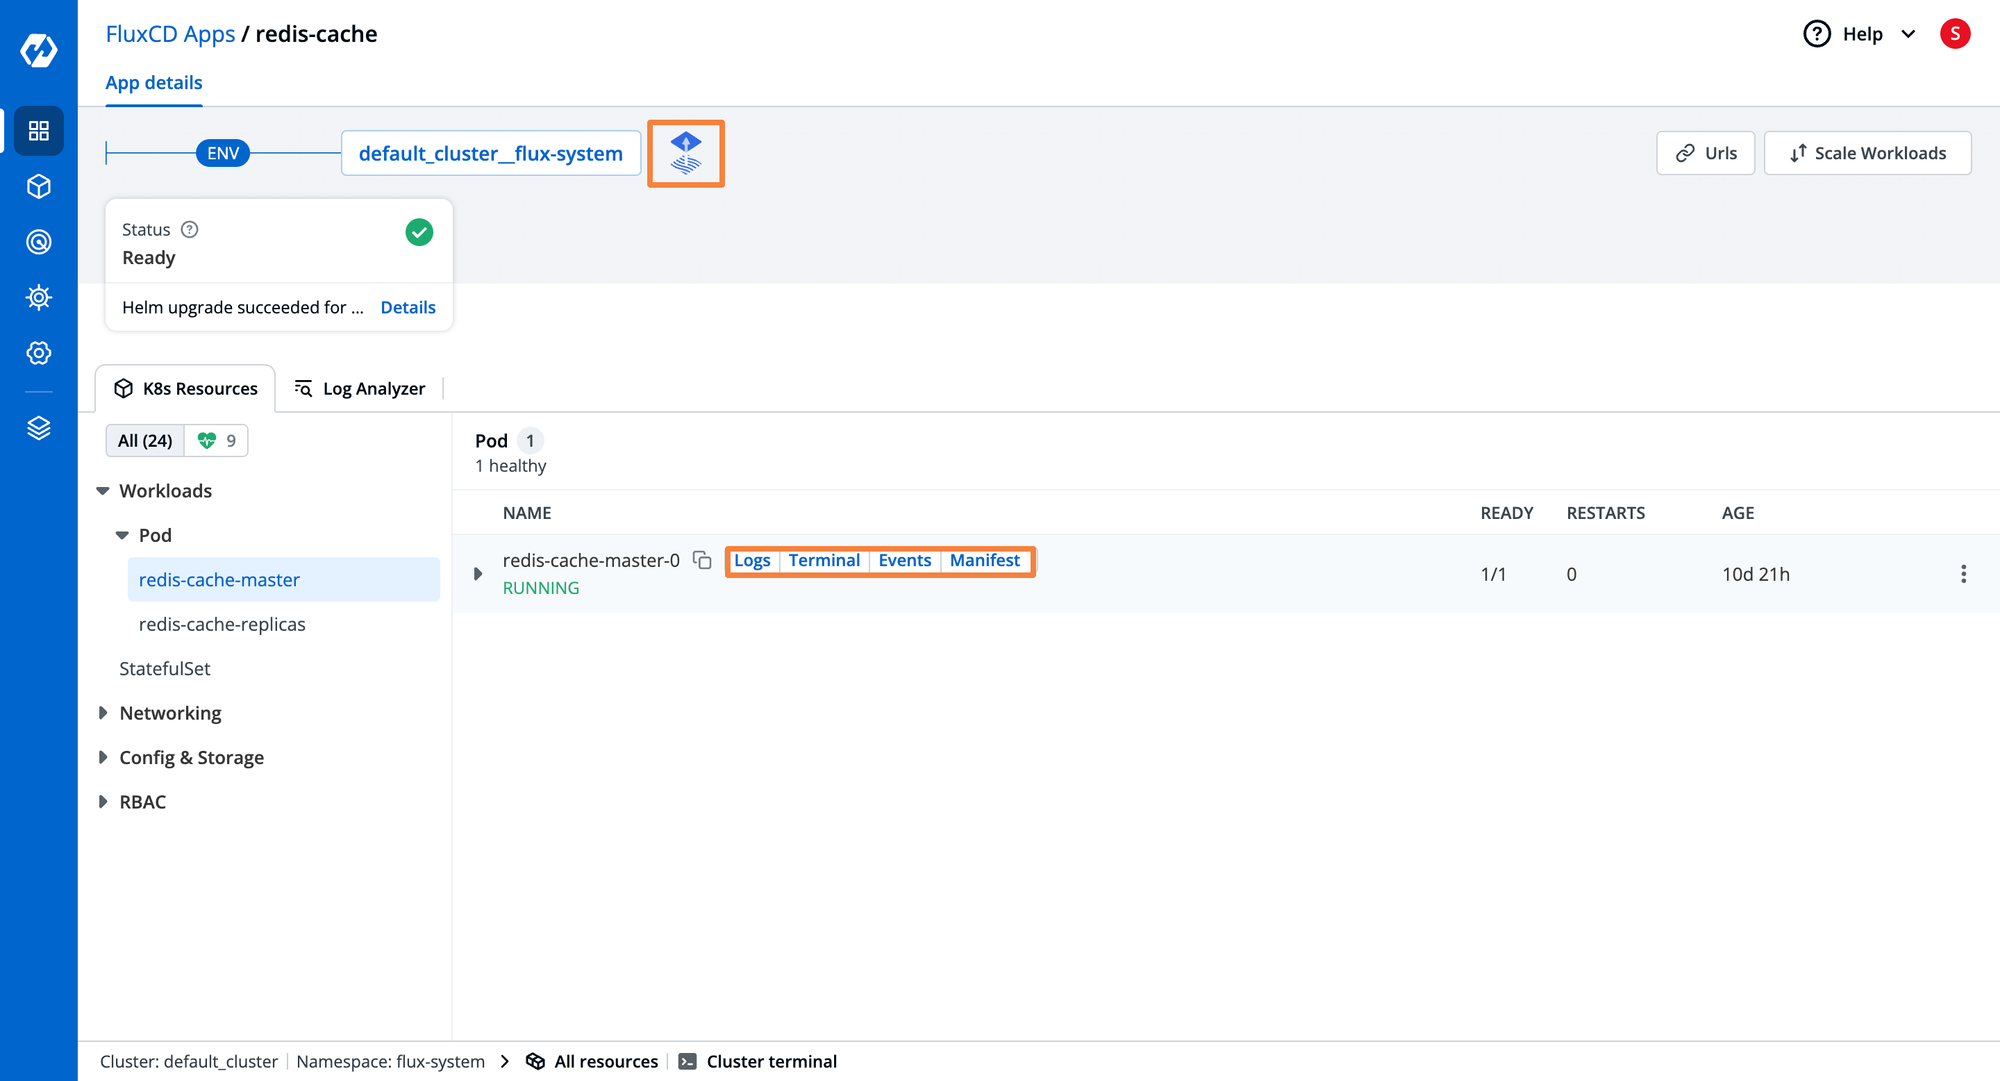
You can also open the FluxCD applications and view all the different resources that are deployed for managing the application. You can also view the pod’s manifest, logs, and events from the Devtron dashboard. If you wish to run any actions within the pod, Devtron also provides functionality to open a terminal within the pod and run commands.
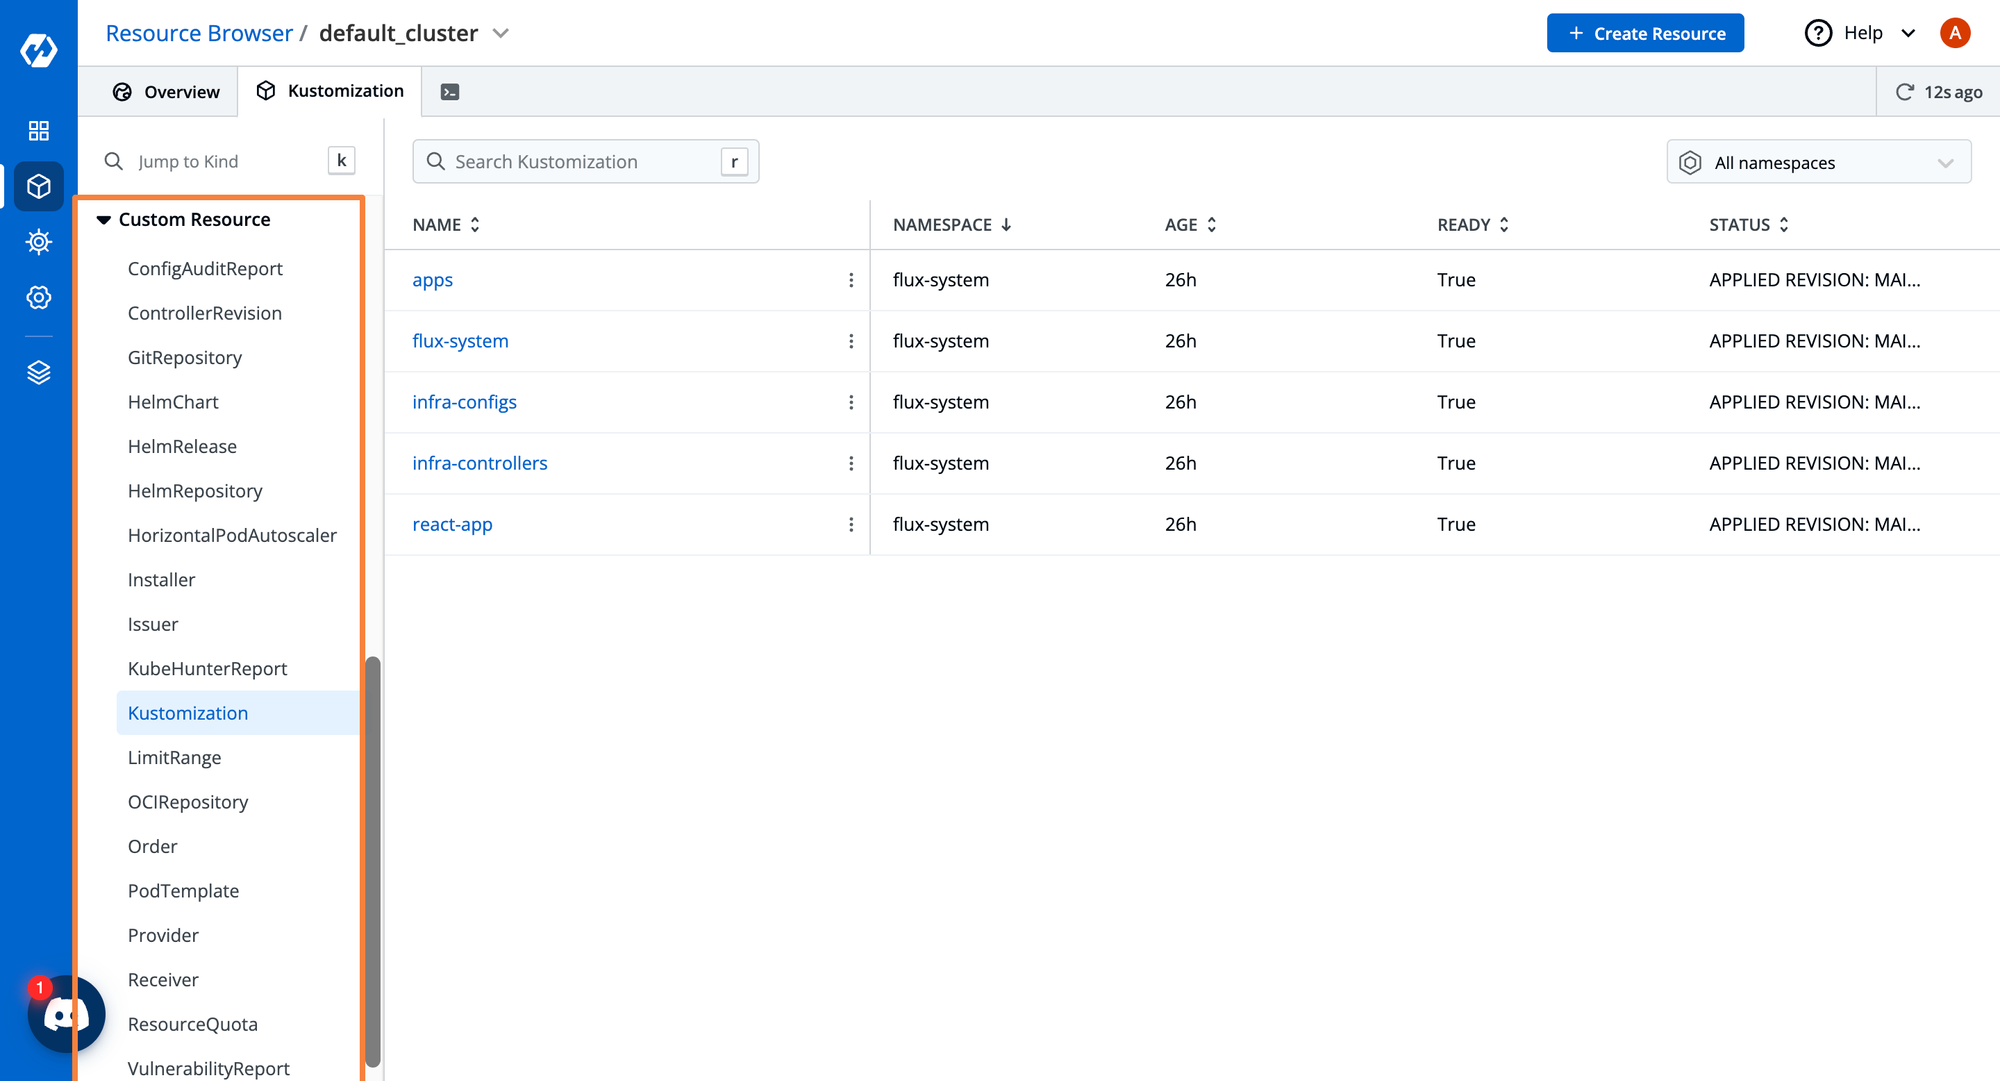
Kustomization manifests, HelmReleases, FluxCD’s Notification resources, and ApplicationSets for ArgoCD are all custom resources that are deployed on the cluster. All these custom resources can be viewed and configured from Devtron’s resource browser with the Custom Resource section. Apart from just these Custom Resources, Devtron shows all the different Custom resources that are deployed on the cluster. You can view their manifests, and configure them from the resource browser.
| Capability | Devtron | Headlamp |
|---|---|---|
| Integrations for CI/CD | ✅ | ❌ |
| Integrations for ArgoCD GitOps | ✅ | ❌ |
| Integrations for FluxCD GitOps | ✅ | ✅ |
| Integrations for Security Scanning | ✅ | ❌ |
| Integrations for custom event notifications | ✅ | ❌ |
| Configuration drift detection | ✅ | ❌ |
| Advanced deployment stratergies | ✅ | ❌ |
Conclusion
As we have seen above, Devtron and Headlamp are both Kubernetes Dashboards that provide a good number of features for managing Kubernetes clusters. Both have support for gaining insights into multiple Kubernetes clusters and managing them. While Headlamp has a limited number of features when it comes to managing applications, Devtron has robust application management features and provides visibility within the deployed workloads.
Devtron offers a robust RBAC mechanism where you can fine-tune user access. Headlamp on the other hand only gives visibility into the role and rolebinding resources. You will have to manually create the resources and assign them to the appropriate users. Headlamp offers a few basic integrations whereas Devtron integrates with a lot of the core CNCF tools and can be extended into a complete DevOps lifecycle management tool.
If you are looking for a solution for managing your application workloads, gaining insights into the cluster resources, and collaborating within a team, Devtron offers superior capabilities in comparison to Headlamp. On the other hand, if you only want to gain visibility into your cluster at an individual level, you can use Headlamp. The only downside is that to interact with your cluster, you will have to context switch to a terminal. You cannot directly run kubectl commands from the headlamp dashboard.

