Helm is a package manager for Kubernetes that simplifies the deployment and management of applications within a cluster. It provides a standardized way to define, install, and upgrade applications using reusable, configurable templates called Helm charts. These charts bundle together Kubernetes manifests, making it easier to deploy complex applications consistently. Helm reduces the operational overhead by handling tasks like dependency management, versioning, and rollbacks. Instead of manually creating and updating Kubernetes resources, teams can leverage Helm to automate these processes, enabling faster and more reliable application delivery.
What if you could enhance team collaboration and security in your Kubernetes environment? Explore how Devtron's advanced features like role-based access control (RBAC) and Komodor's user-friendly interface address these needs.
Moreover, Helm facilitates sharing and reusing best practices. Popular applications often have pre-defined charts available in public repositories, allowing teams to adopt proven configurations. Helm also supports parameterized deployments, enabling teams to customize applications for different environments (e.g., staging, production) without duplicating configuration files. This flexibility and scalability make Helm a cornerstone in the Kubernetes ecosystem, especially for Day 2 operations like upgrades and rollbacks.
Despite its advantages, Helm has its share of challenges. Managing Helm releases across multiple environments or clusters can become complex, especially for large-scale deployments. Keeping track of what charts are deployed, their versions and their configuration states requires meticulous effort. Troubleshooting failed deployments can also be difficult since errors are sometimes buried within the templated YAML files. Another common challenge is onboarding; Helm’s CLI-centric approach and templating syntax can pose a steep learning curve for Kubernetes newcomers.
Helm dashboards bring a user-friendly, visual interface to Helm's functionality, addressing several operational and usability pain points. Dashboards provide centralized visibility into all Helm releases, their statuses, and associated configurations across clusters. This makes it easier to manage large-scale deployments and track updates or rollbacks. Many dashboards offer detailed logs and error breakdowns for failed deployments, streamlining troubleshooting.
Additionally, Helm dashboards often abstract the complexity of Helm commands and templating, enabling less experienced users to manage deployments through intuitive forms and wizards. Some dashboards also integrate with CI/CD pipelines and role-based access control (RBAC) systems, making them a seamless addition to modern DevOps workflows. By reducing the technical barrier and improving manageability, Helm dashboards amplify Helm's utility for Kubernetes operations.
What is Komodor Helm Dashboard?
Komodor's Helm Dashboard is a visual management tool designed to simplify working with Helm in Kubernetes clusters. It offers centralized visibility into Helm releases, enabling teams to efficiently manage deployments, track changes, and maintain consistency across environments. Built to reduce operational complexity, the dashboard provides an accessible way for developers and operators to navigate Helm’s powerful capabilities within Kubernetes workflows.
To learn more about the project, please check out the GitHub repository.
What is Devtron Dashboard?
Devtron is an open-source Kubernetes dashboard that is designed to give the user comprehensive visibility into their cluster, while also reducing context switching and managing Helm applications that are deployed in the Kubernetes cluster. Devtron can connect to multiple different Kubernetes clusters and enable you to observe and manage the clusters with ease. To use Devtron, you will have to install it on your target Kubernetes cluster.
Devtron lets you use public helm charts to integrate tools from the Cloud Native ecosystem, such as Nginx or Prometheus. You can also package your custom application and upload it to a chart repository. Then, you can deploy the chart on Devtron and manage your application workload. Devtron has a couple of robust features for managing applications and gaining comprehensive visibility into Kubernetes resources, which will be discussed below.
To read more about Devtron, please refer to their documentation and the GitHub repository.
Helm Application Management
Helm serves as Kubernetes' package manager, streamlining the deployment and management of applications. It leverages charts to bundle all necessary resources, such as Deployments, Services, and ConfigMaps, into a single package. With Helm, deploying an entire application stack becomes as simple as running one command, while updates and rollbacks are handled with ease. By consolidating multiple YAML manifests into a single, reusable package, Helm simplifies operations and reduces complexity.
As a critical tool in Kubernetes, Helm saves time, minimizes errors, and ensures consistency across different environments. Its features like version control, dependency management, and configuration overrides, make it an ideal solution for teams managing applications across development, staging, and production workflows.
Komdor Helm Dashboard
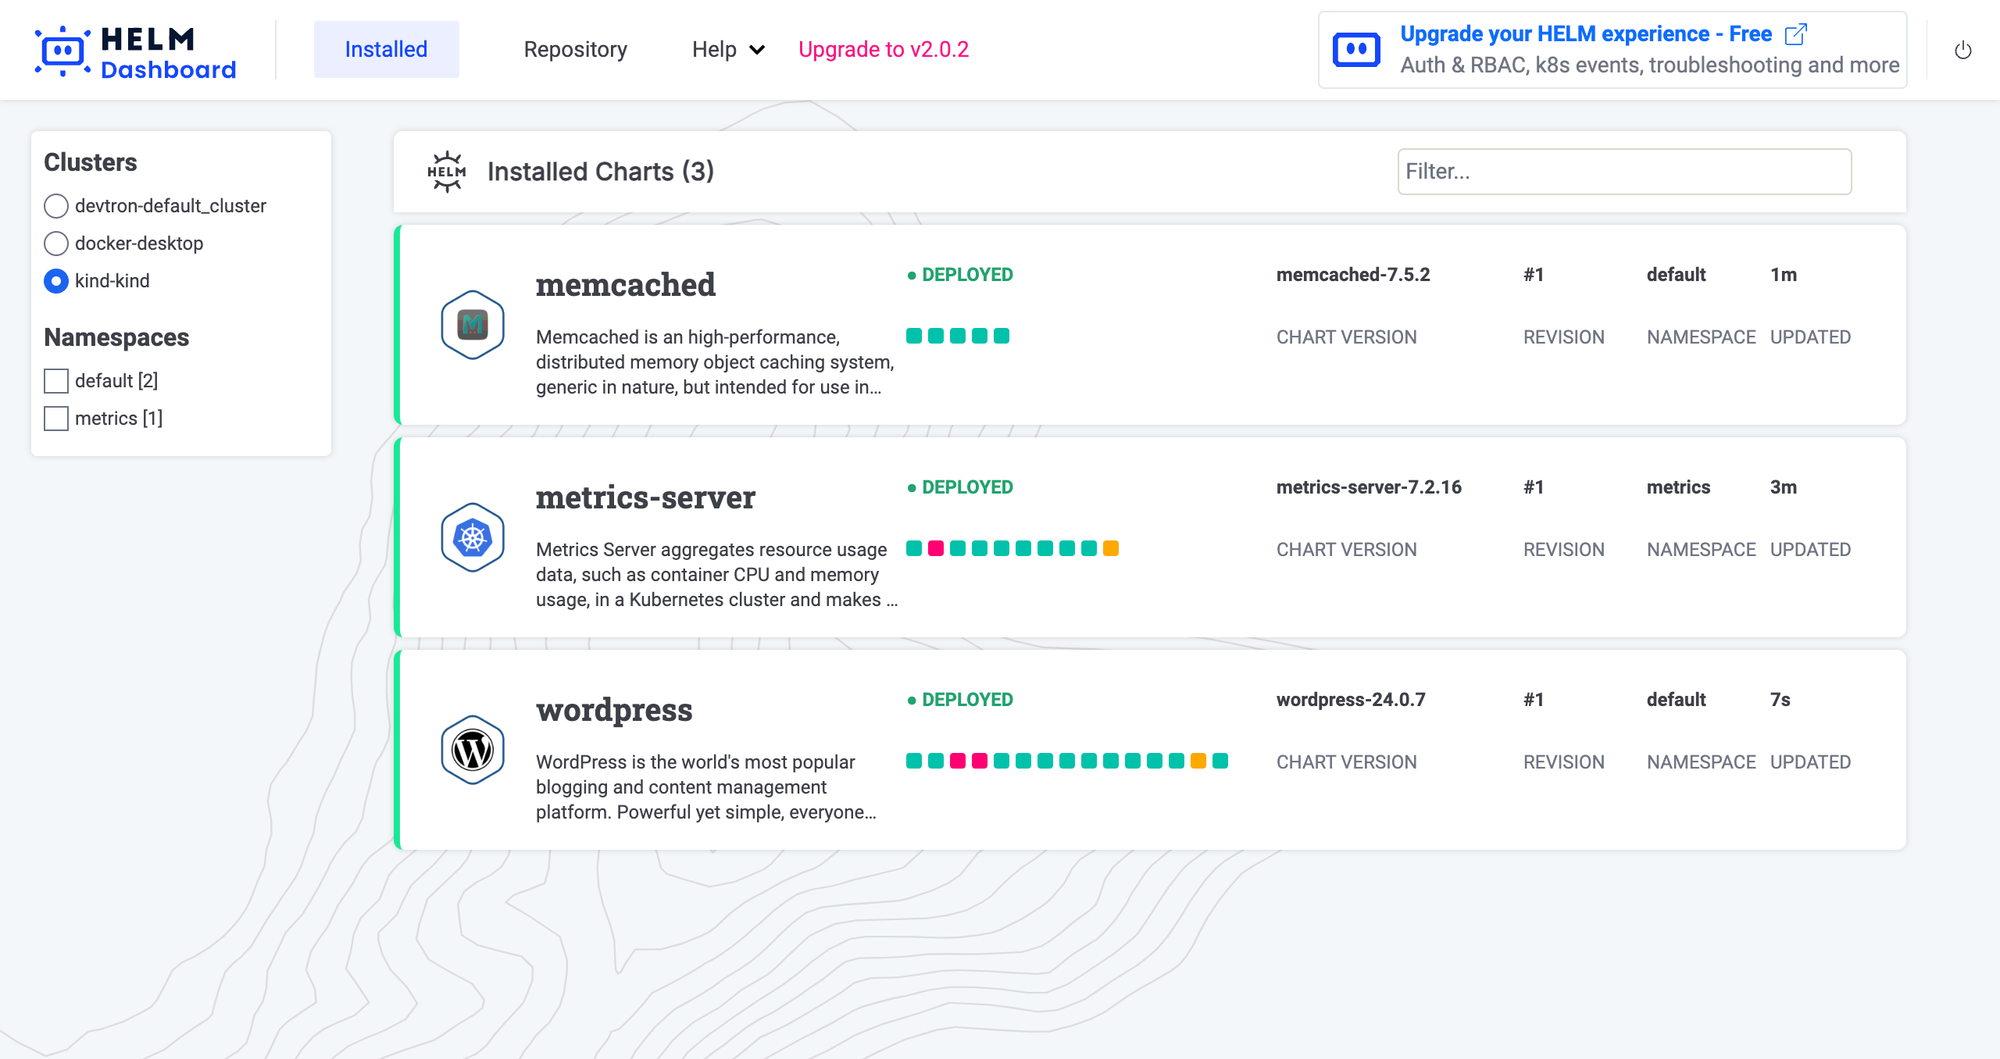
Komodor’s Helm Dashboard can be installed as a local binary, or deployed directly on the Kubernetes cluster. On opening the dashboard, you will be able to see all the Helm charts that are deployed on the target Kubernetes cluster. If you are running Komodor’s Helm Dashboard locally, it will read your KubeConfig file and show all the different clusters connected to it. Through this, you can filter charts by clusters, and namespaces.
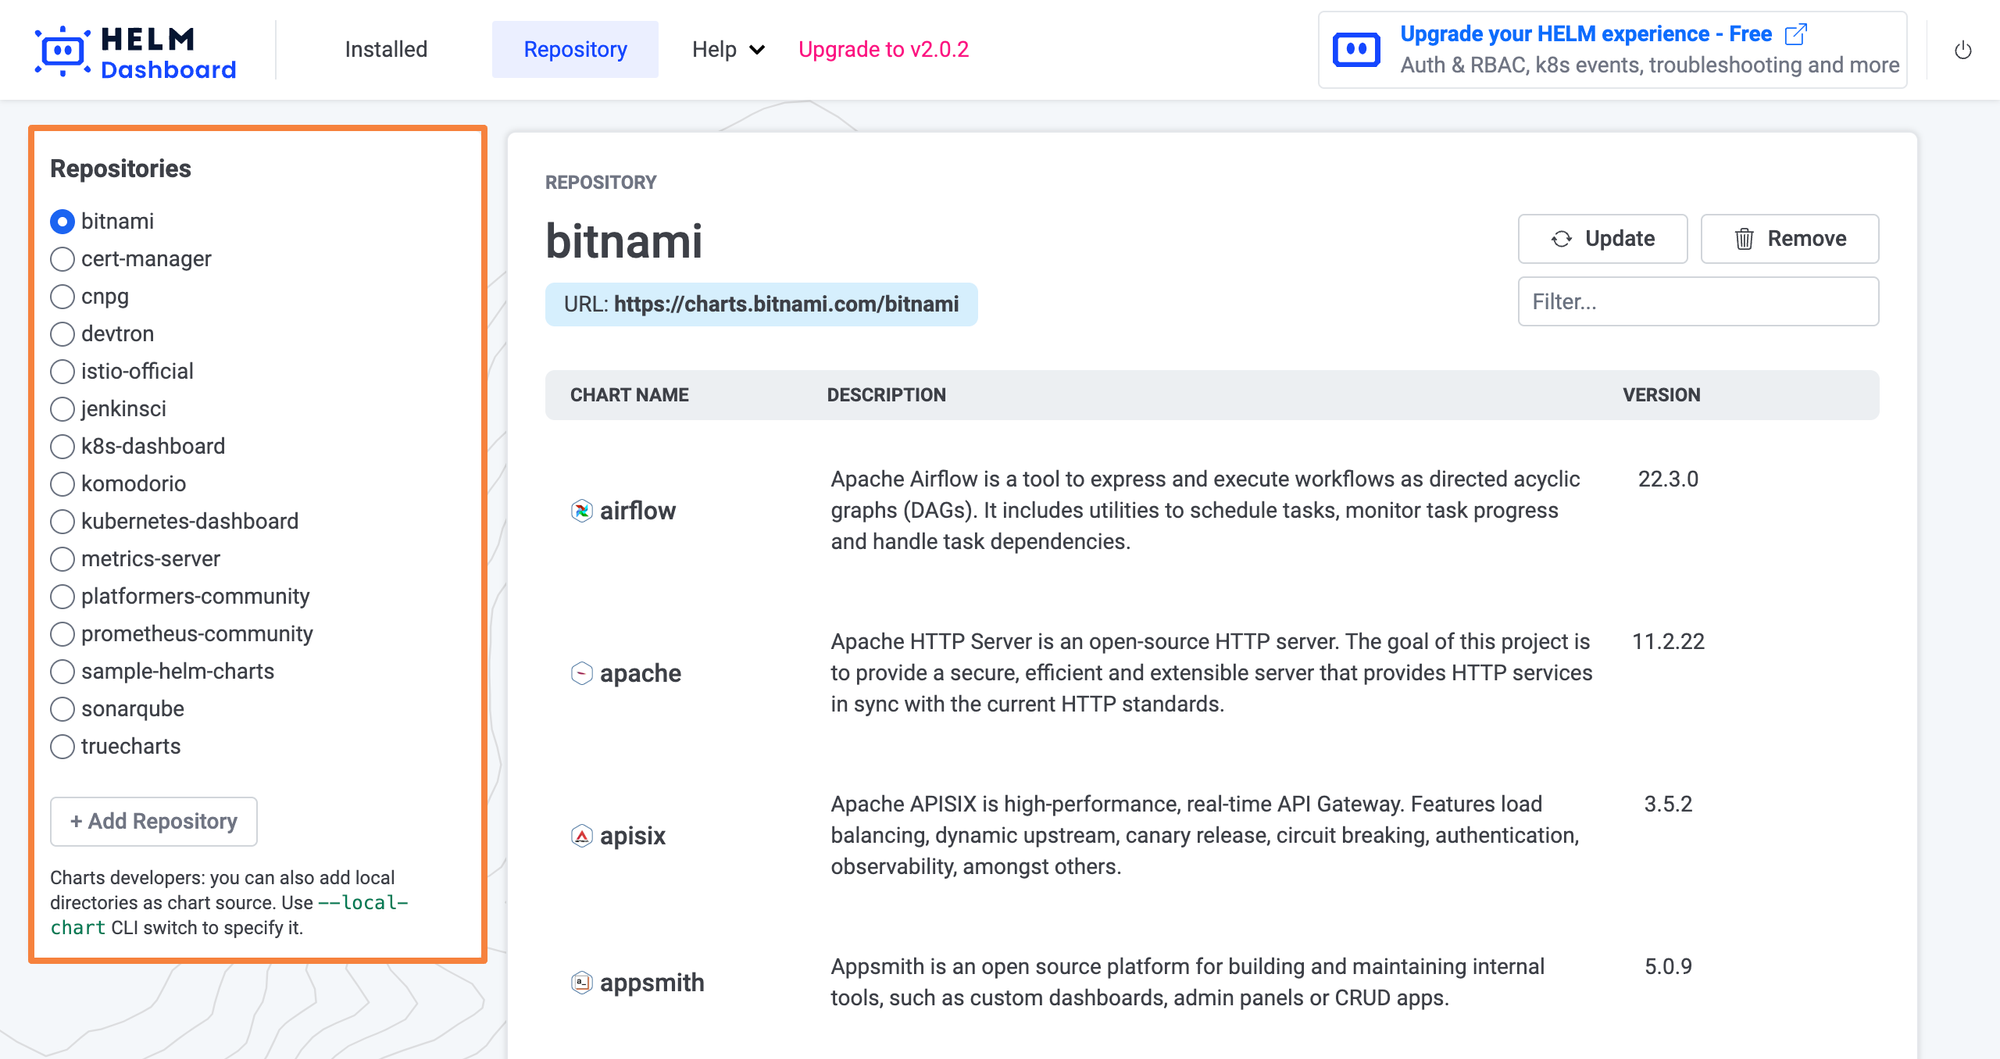
The Komodor Helm Dashboard allows you to view Helm charts from multiple different repositories. If you have used the Helm CLI to add different repositories using the helm add command, all those different repositories will be visible in the Repository tab of the Helm Dashboard. You can also add additional public and private repositories from the Dashboard itself.
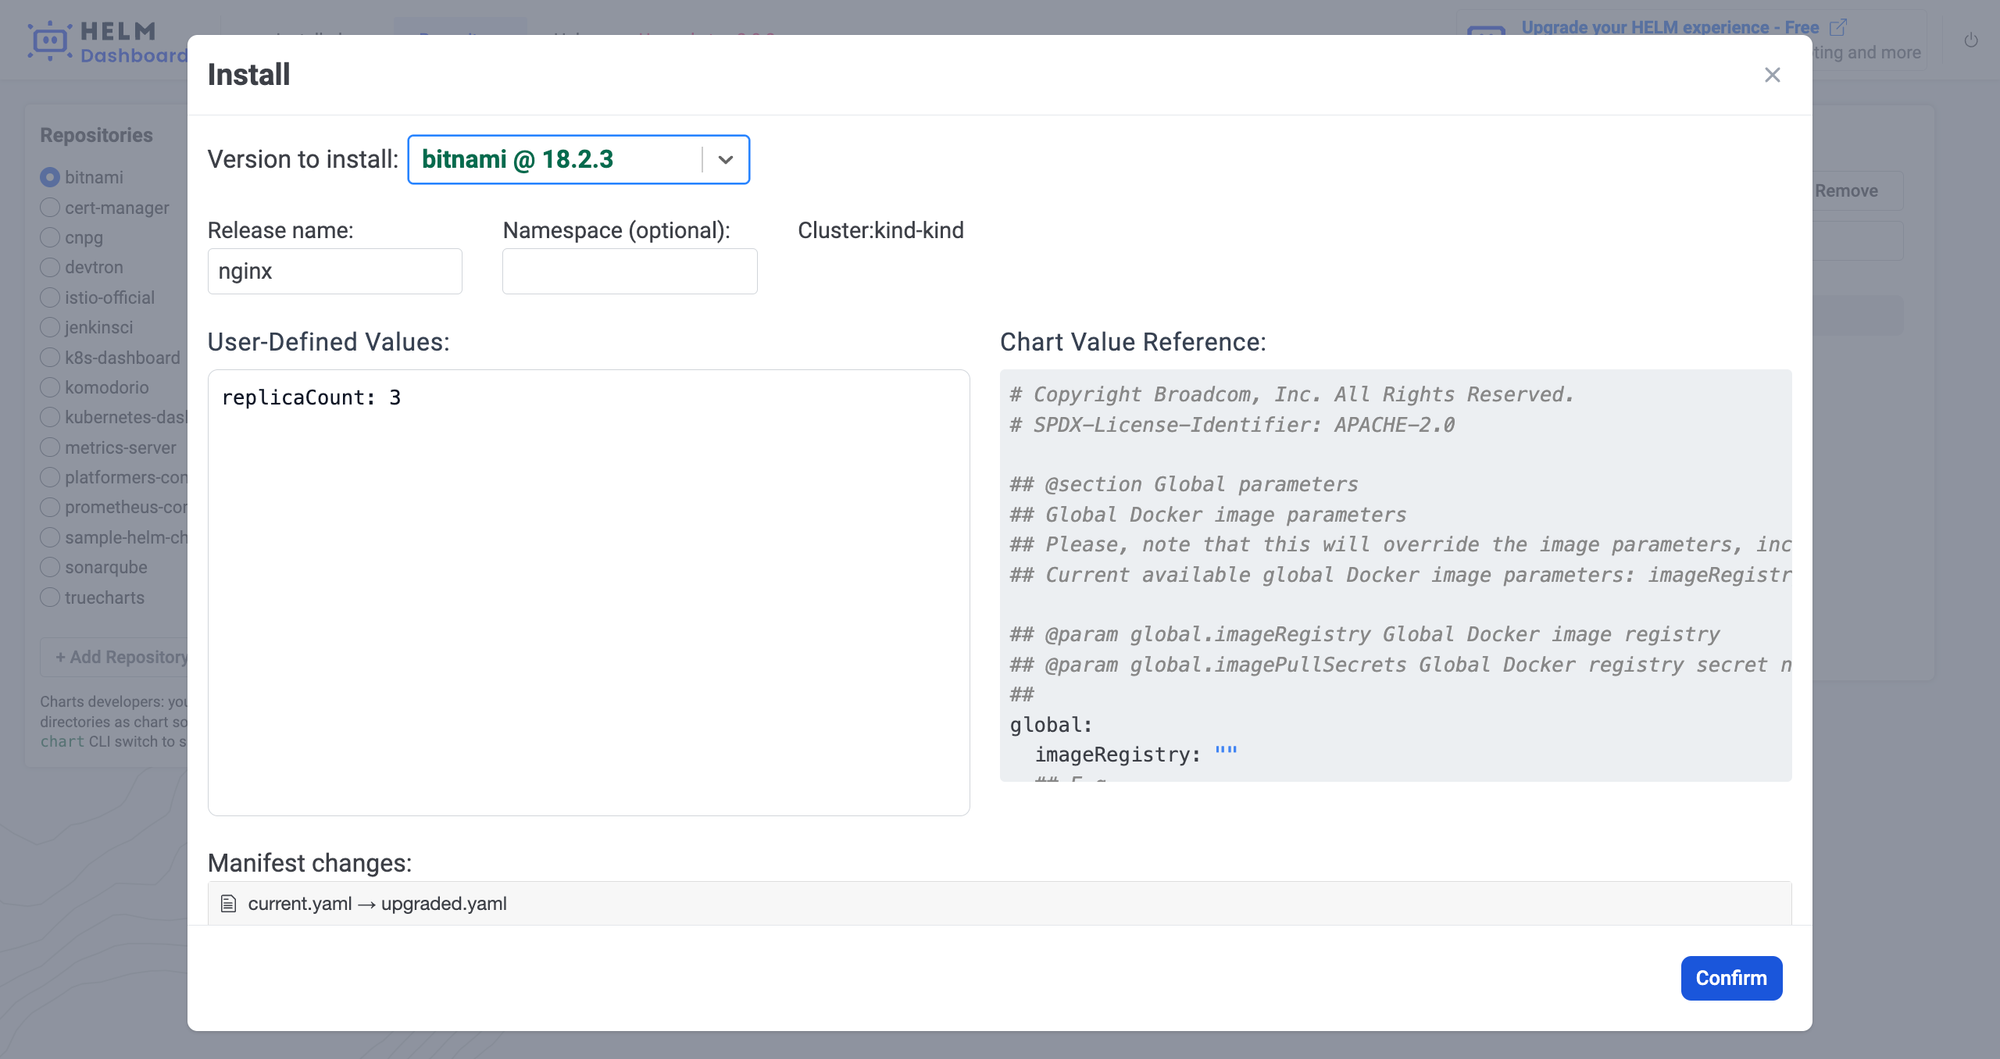
When deploying any chart, Komodor lets you customize the values.yaml file in the dashboard itself. It also shows a Chart Value Reference on the side which you can refer to while configuring the custom chart values. After properly configuring the values, the dashboard also shows all the manifest changes. As soon as you click on confirm, the chart will be deployed to the cluster.
On deploying the chart, you will be able to see all the different Kubernetes resources that have been created. You can also describe the resources to see information about the resource. The Describe button will show the equivalent output of kubectl describe, showing you the different information of the resource along with the events. You can also see the Manifest file of the chart, and compare it with specific versions of the chart. Similarly, you can see the Values file, and see the differences. Komodor's Helm Dashboard also lets you see only the user-defined values. The notes tab gives useful information about the chart such as how to use it.
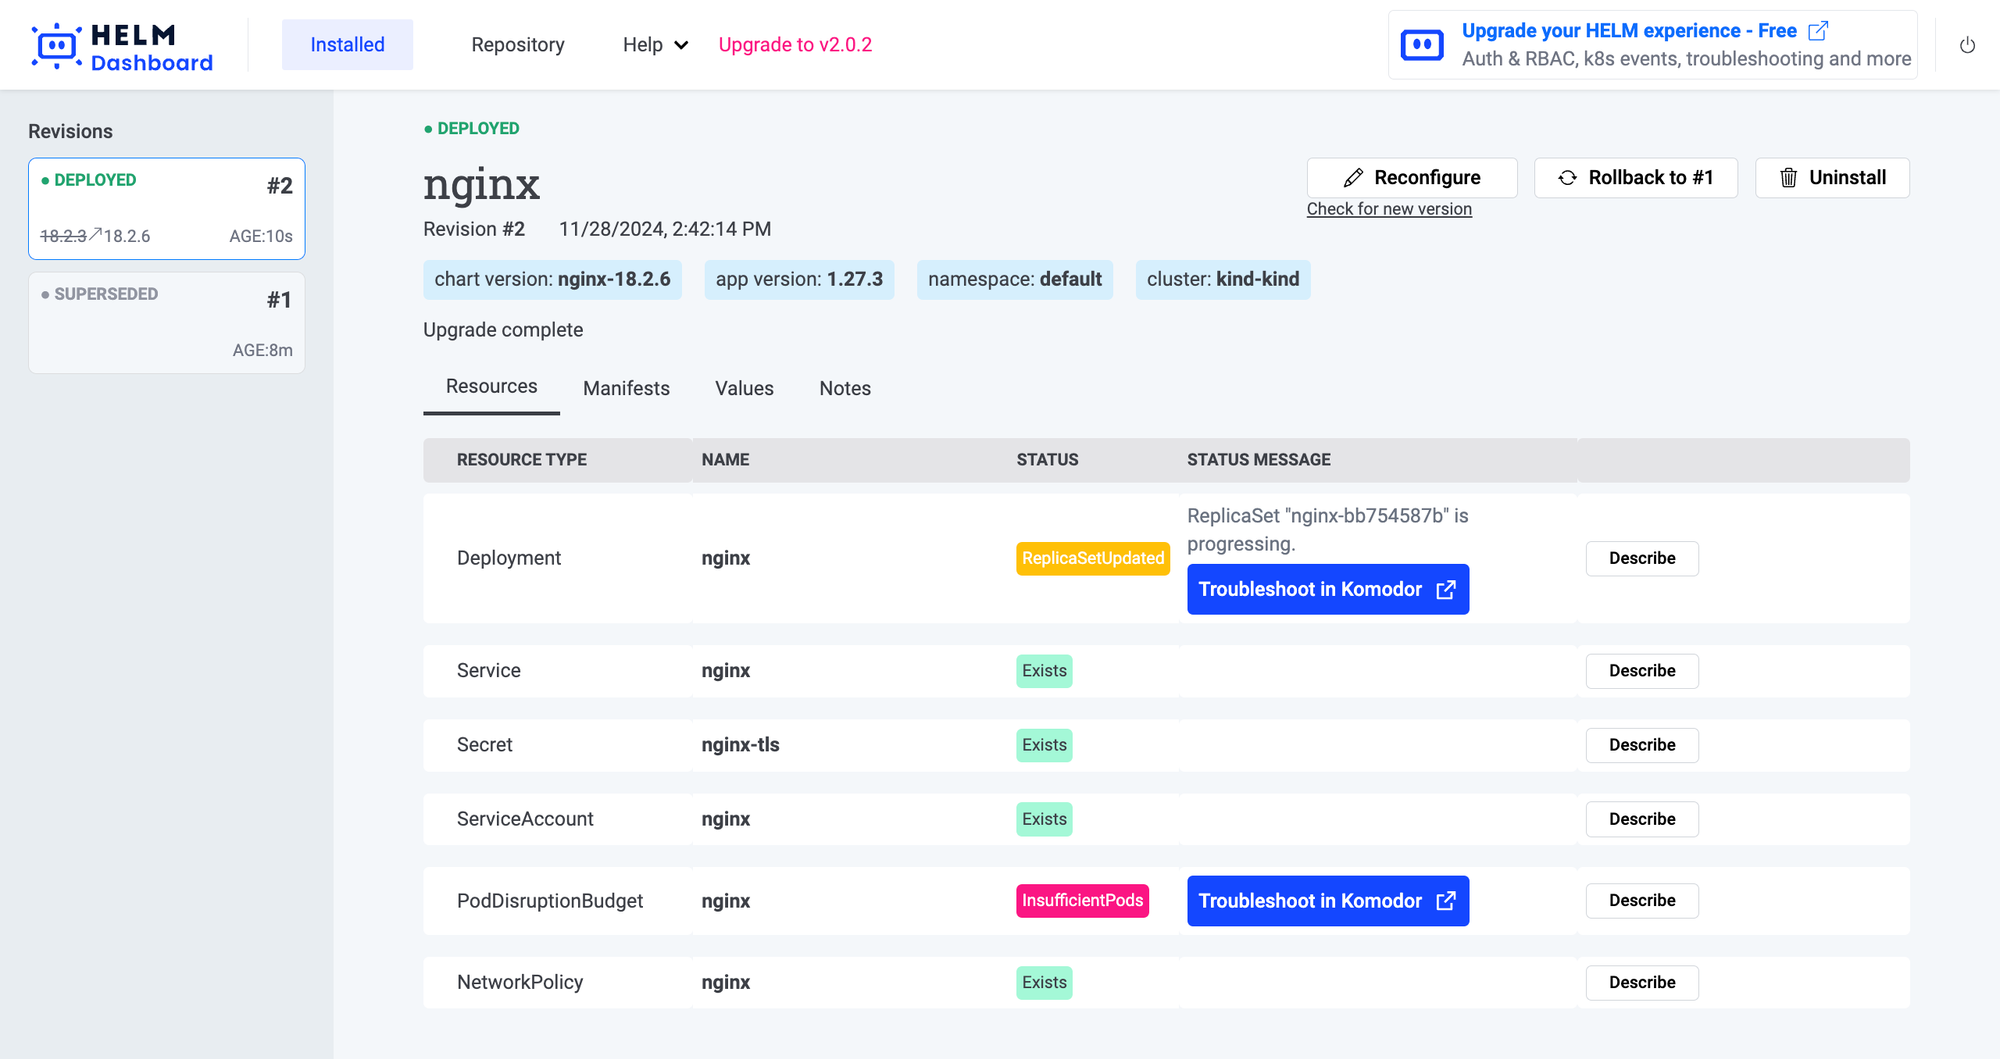
You can also upgrade the chart version, reconfigure the chart values, and trigger another deployment for the chart. The Komodor Helm Dashboard also provides the option to see the Revisions of the deployed chart and roll back to a previous revision.
Devtron Dashboard
Devtron’s Kubernetes Dashboard helps manage Kubernetes applications with its dedicated Helm Apps management dashboard. In this dashboard, Devtron lists all Helm applications deployed across multiple Kubernetes clusters providing a 360-degree view of all applications. You can also filter applications of choice using multiple filters such as Projects, Clusters, and Namespace. By providing a Helm dashboard similar to the Kubernetes dashboard of Devtron, you can now manage all your Helm applications in a single pane of glass. Having a single and intuitive application management dashboard helps you to easily navigate through multiple applications that are spread across multiple Kubernetes clusters without any context switching and tedious processes.
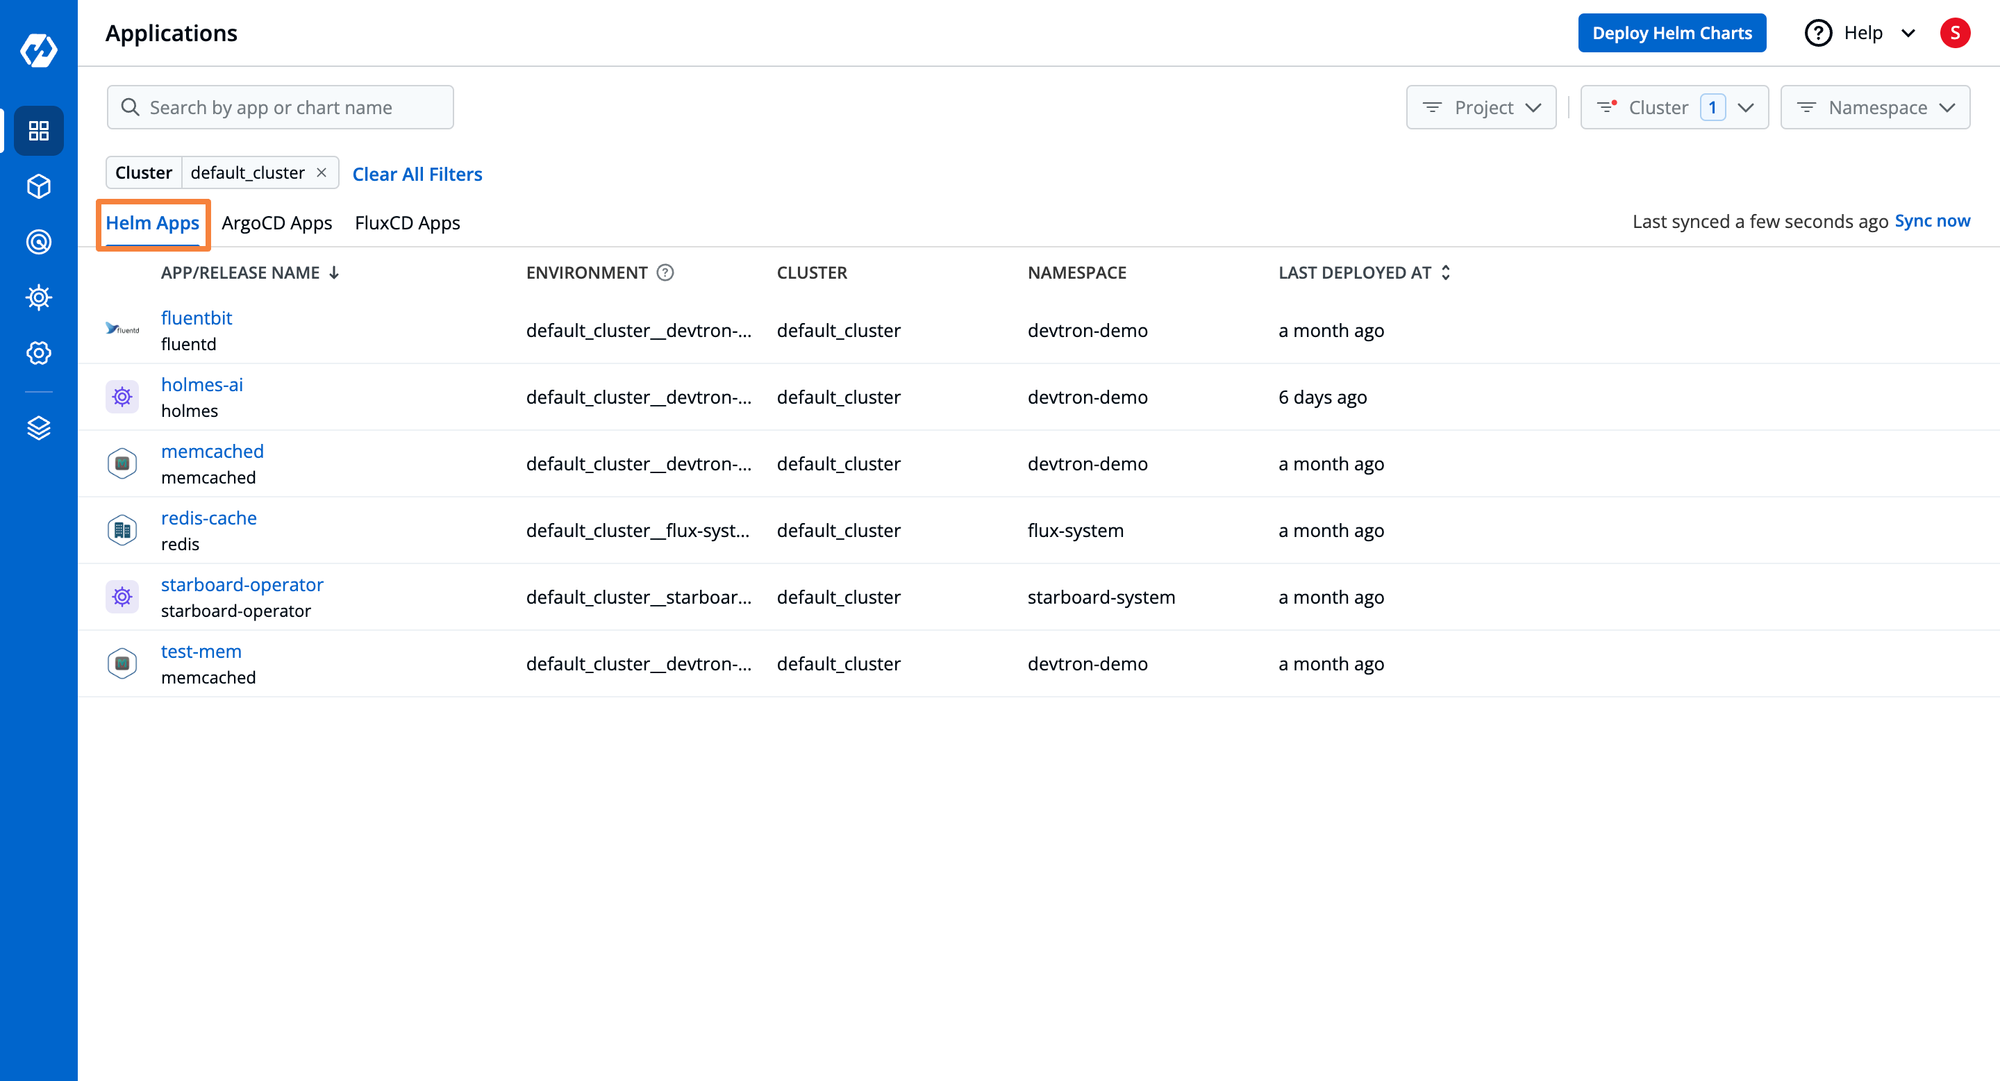
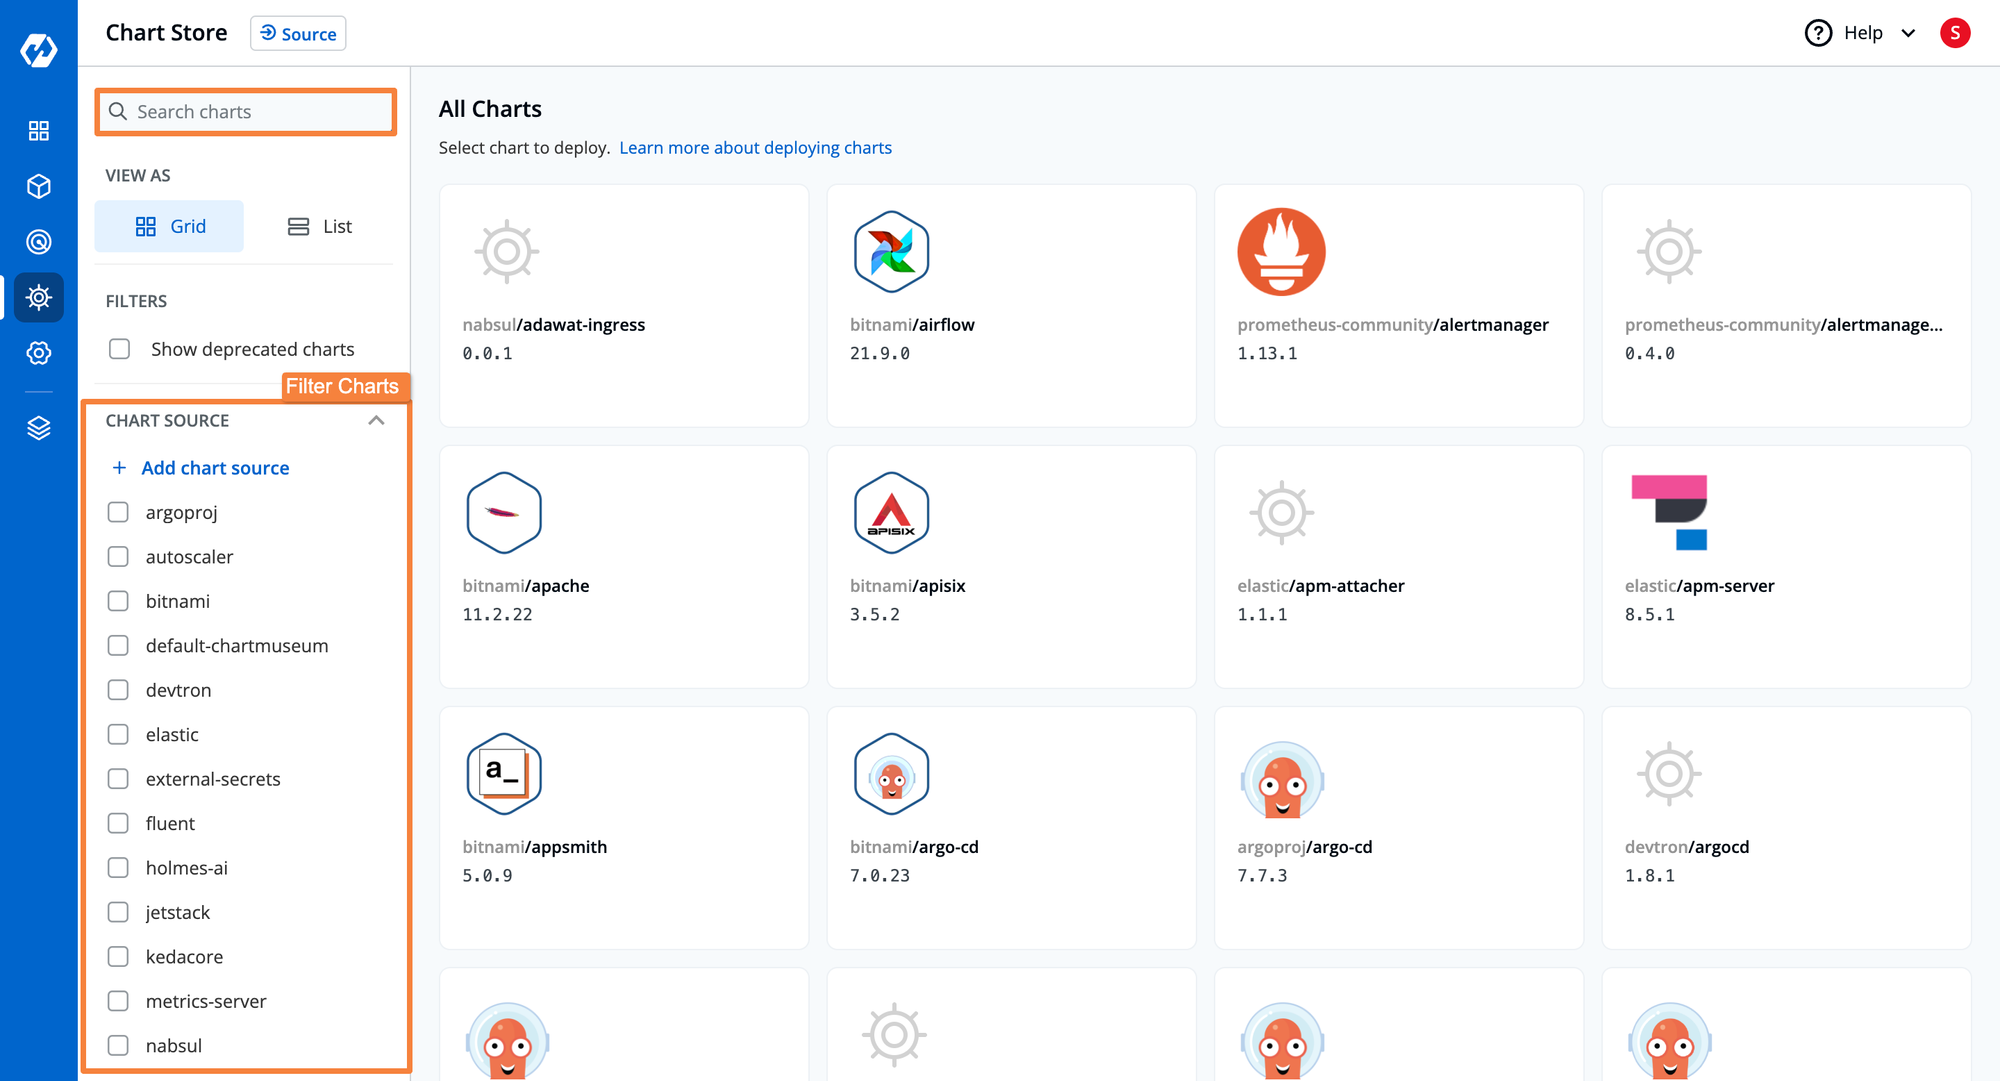
The Helm App dashboard of Devtron allows you to create and deploy new applications to target the Kubernetes cluster and environment. By navigating to the top right corner at Create > From Chart Store you are redirected to the Chart Store entity of Devtron. The Chart Store contains multiple Helm charts readily available for deployment. You can configure your own Helm registry to deploy custom applications too.
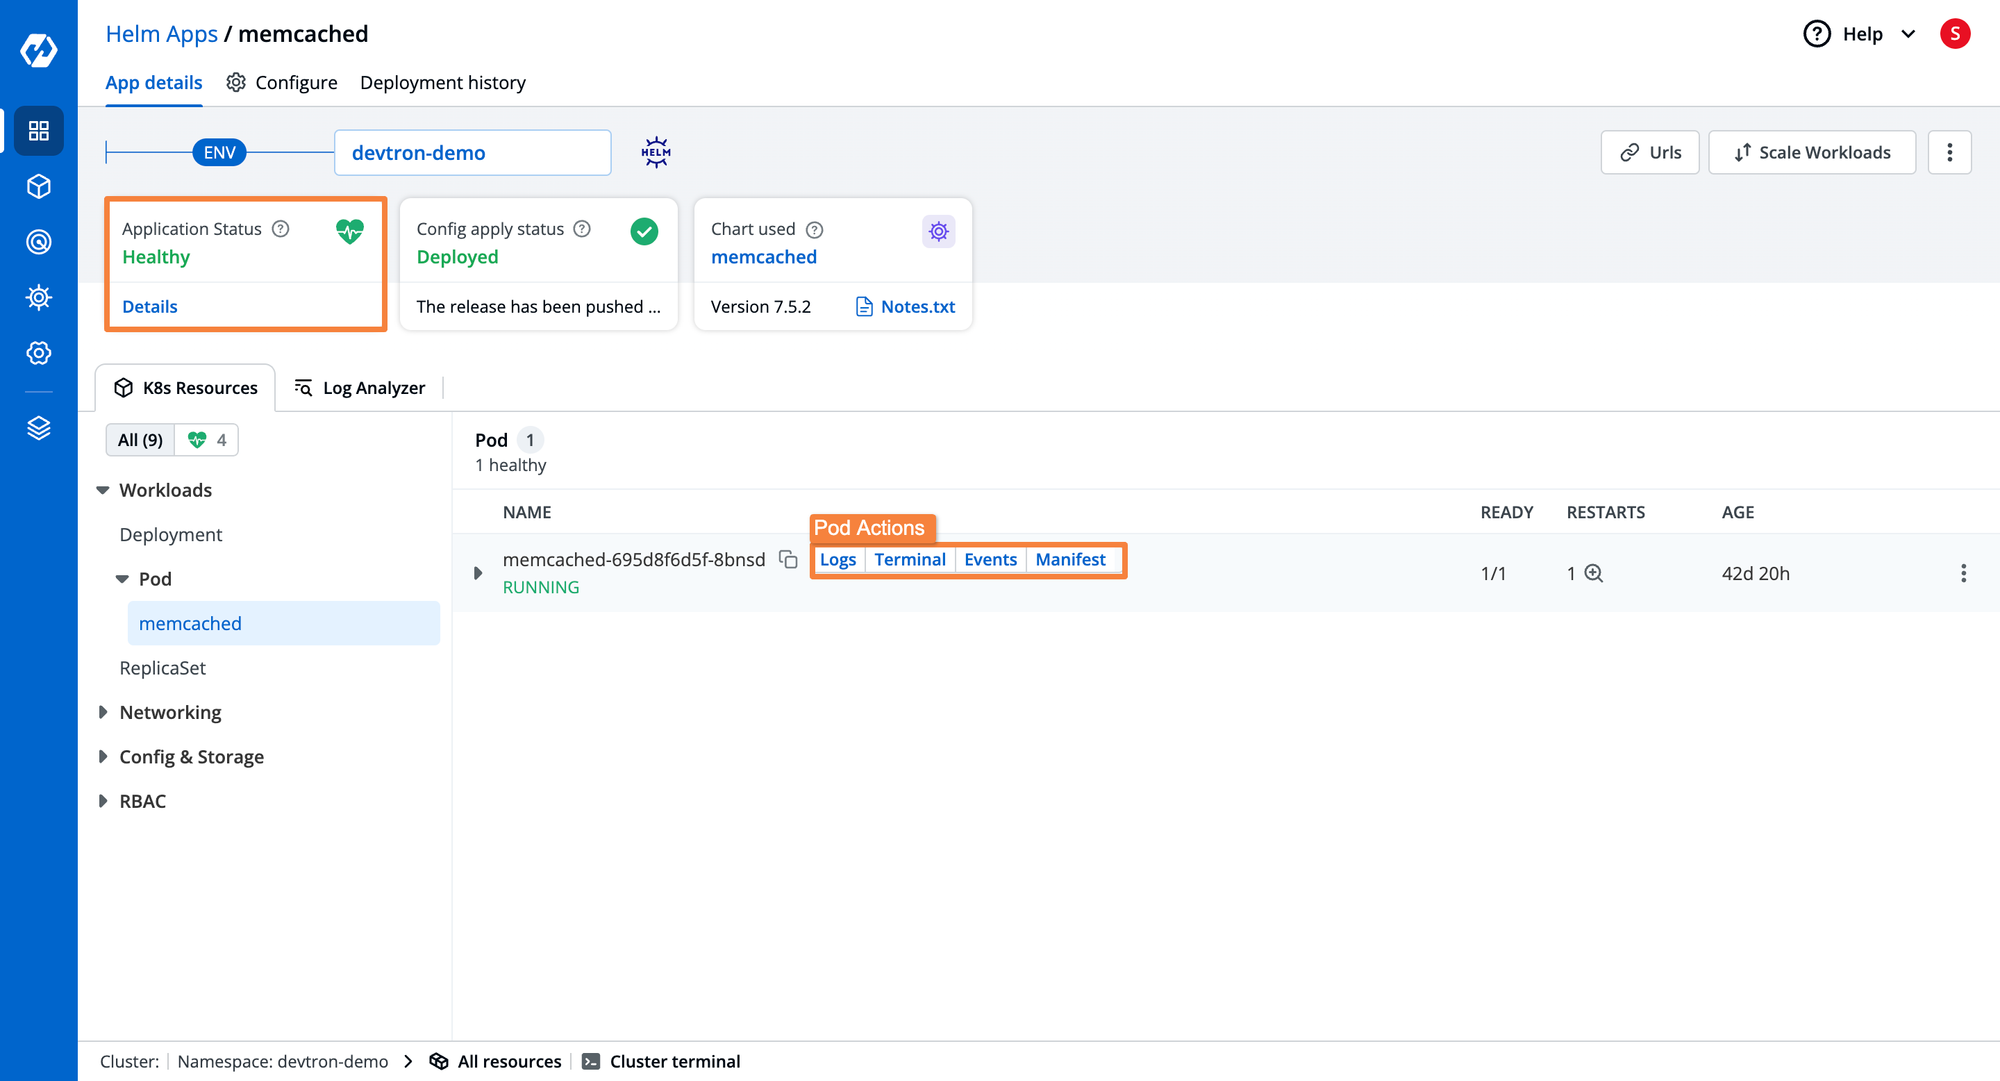
Devtron’s Helm dashboard comes with some advanced capabilities like troubleshooting the application, managing the configurations, and handling the configuration drifts. Some more features that devtron provides are resource grouping at the application level, real-time health status, and Deployment History.
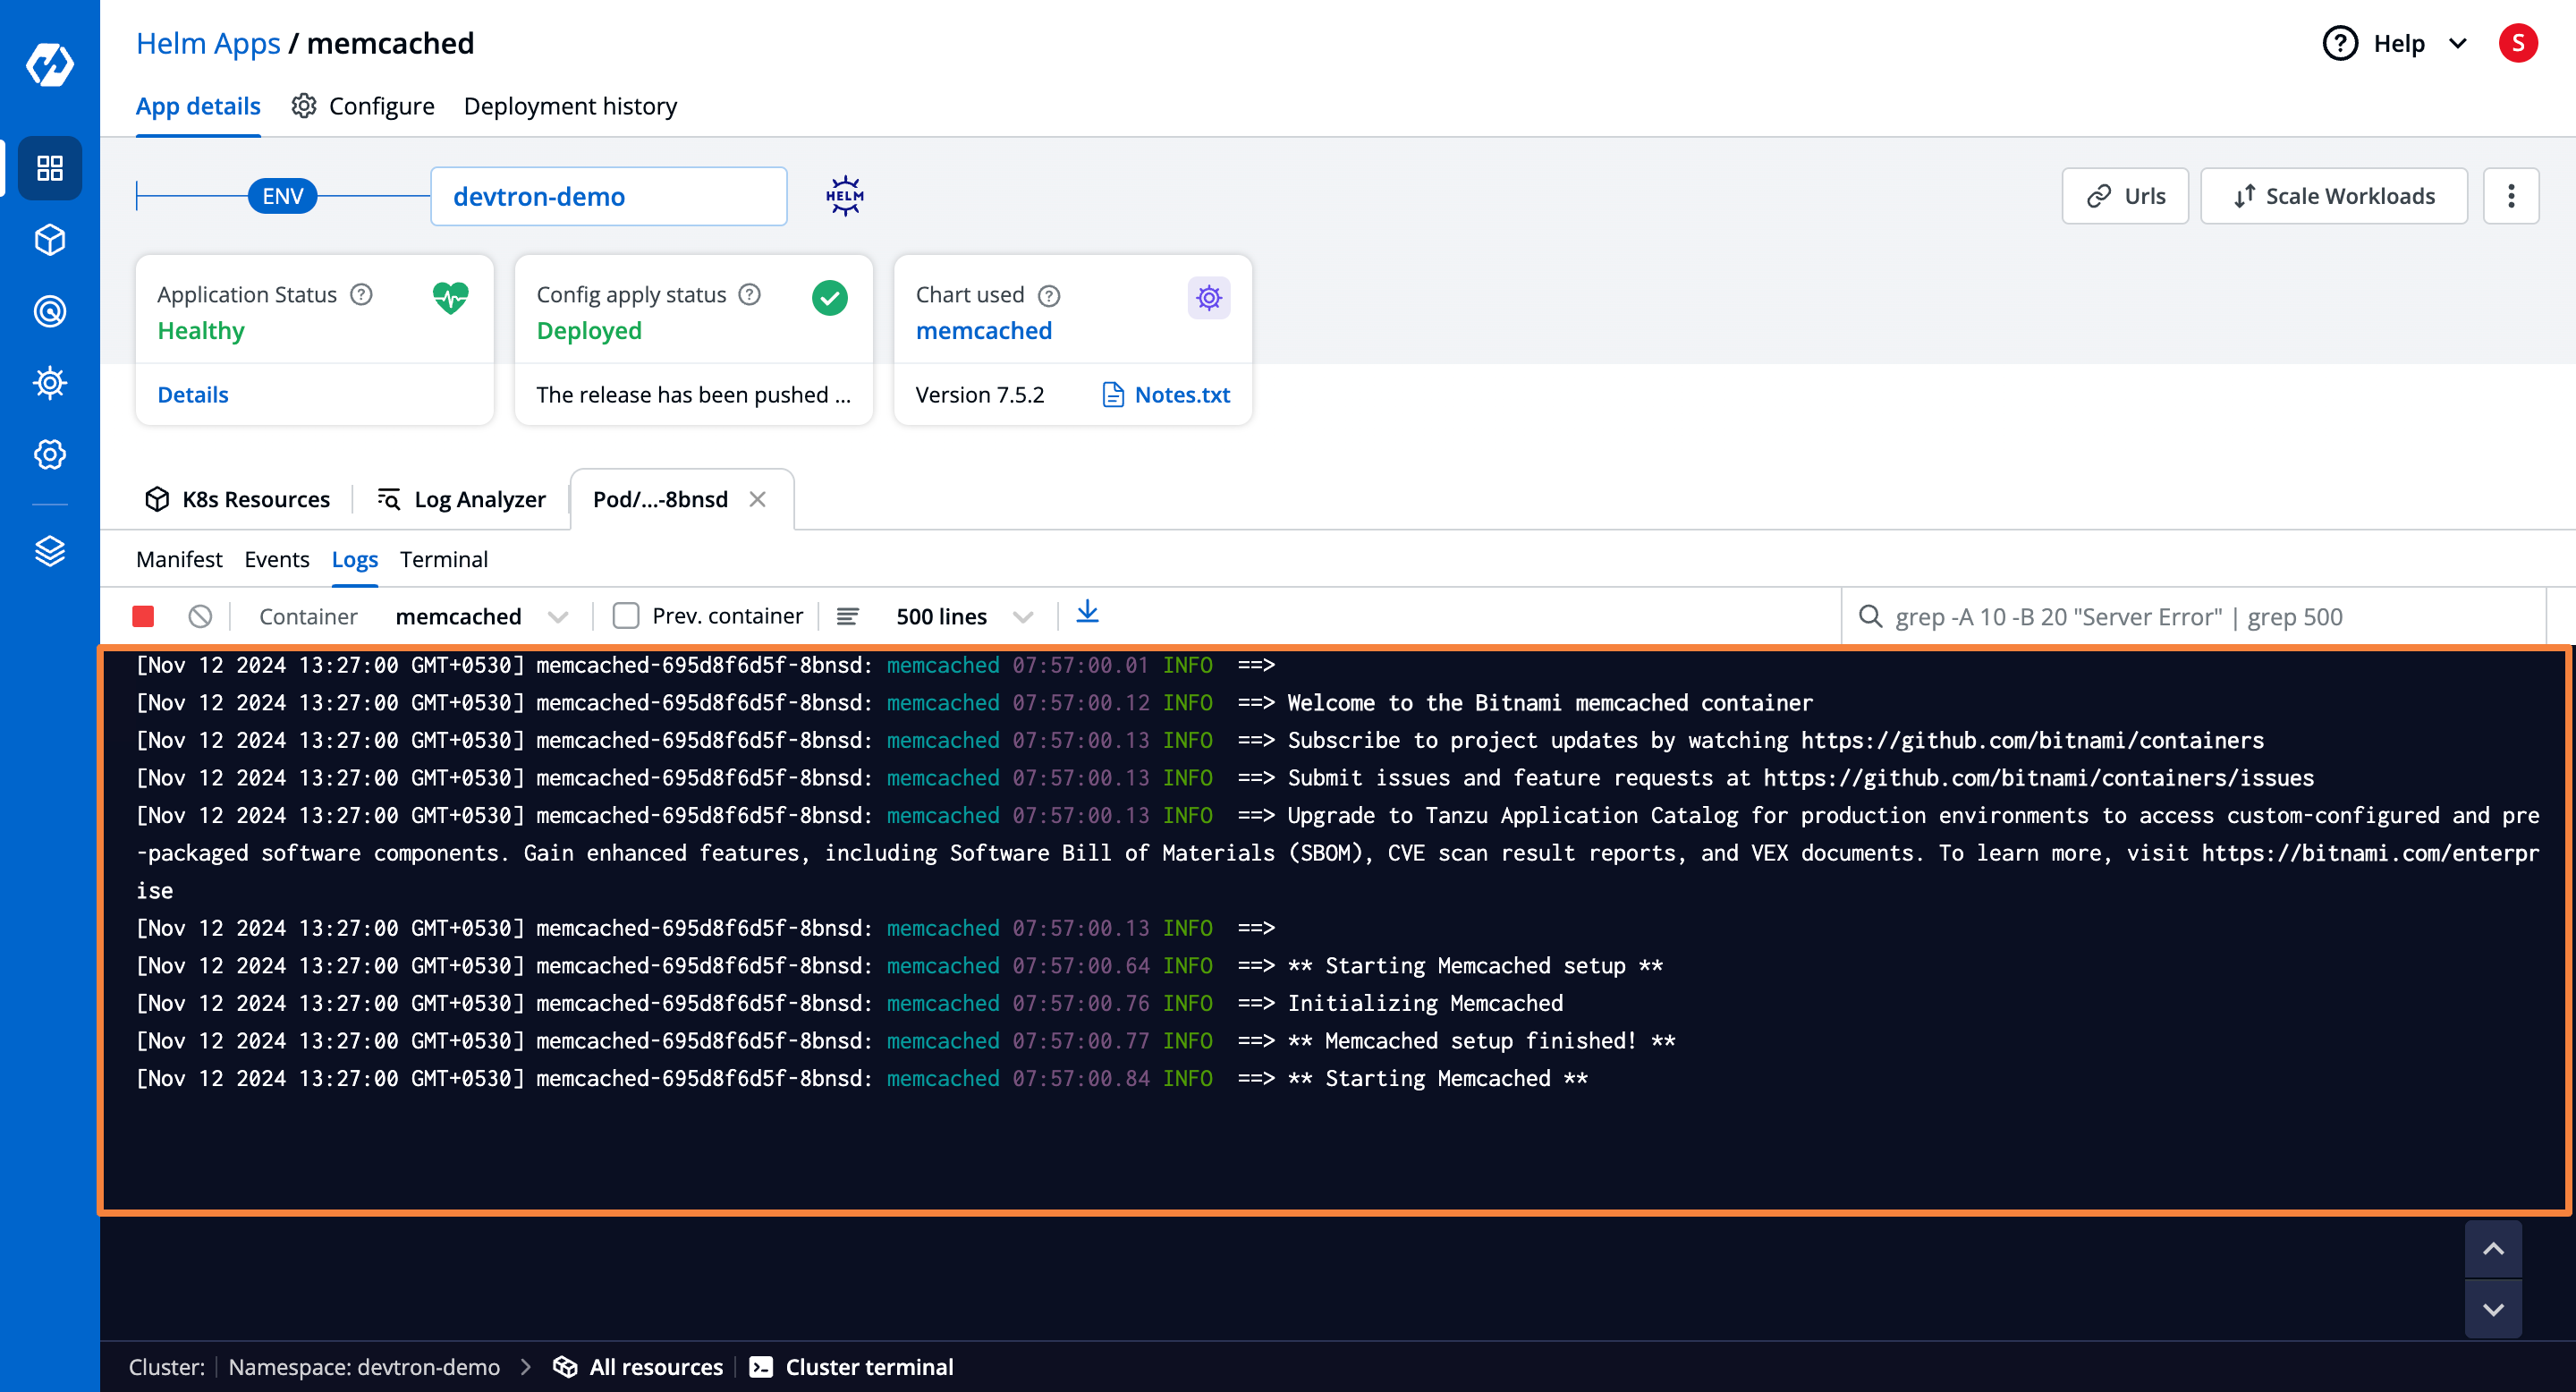
In case you need to visualize the logs of specific pods and perform some troubleshooting. Devtron provides you the capability to visualize the real-time logs on the same Helm dashboard. Some more additional features that the Helm dashboard provides to you are Manifest (view and edit live manifest), and Events.
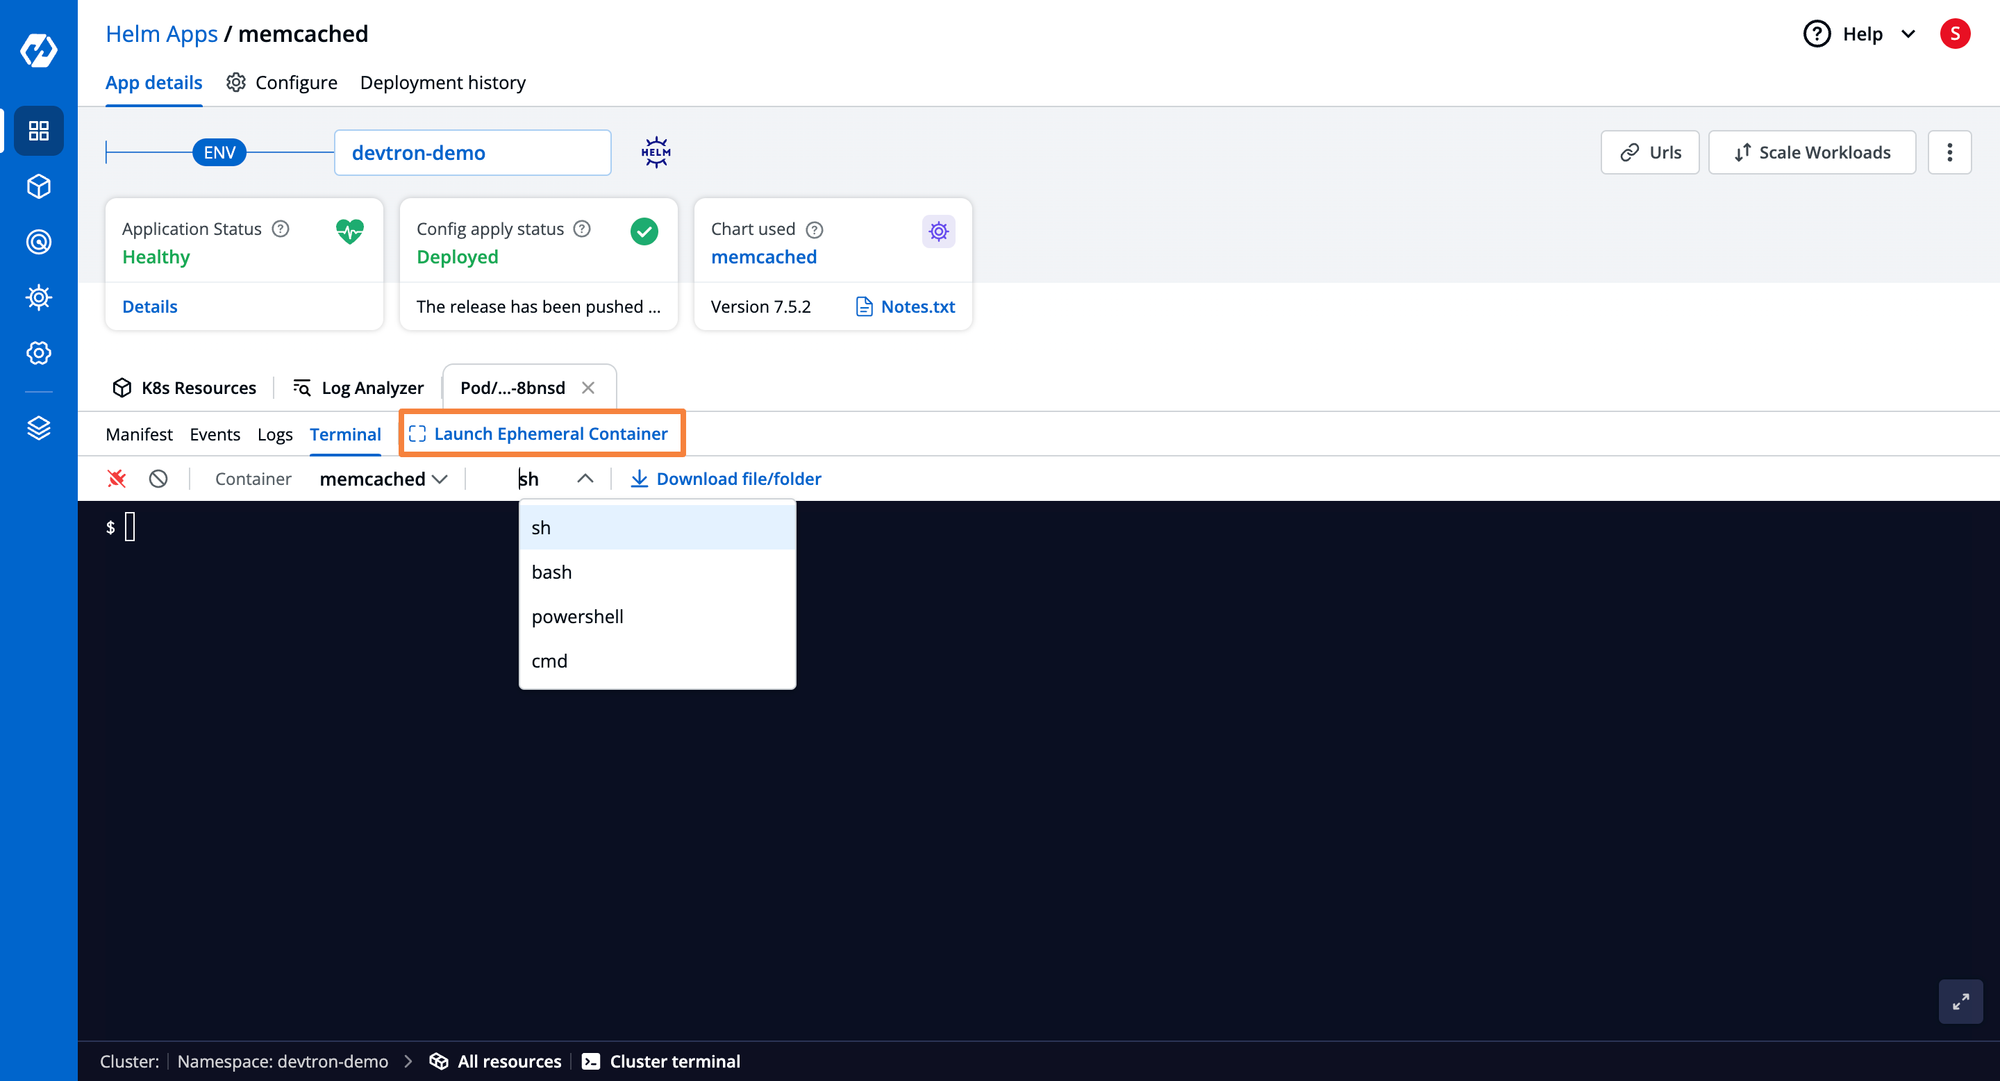
For troubleshooting errors of applications, with the Helm dashboard of Devtron, you can launch a dedicated Terminal for a specific pod and fire up some commands for troubleshooting. You can use some advanced capabilities of Devtron’s Helm dashboard for troubleshooting like Launch Ephemeral Containers.
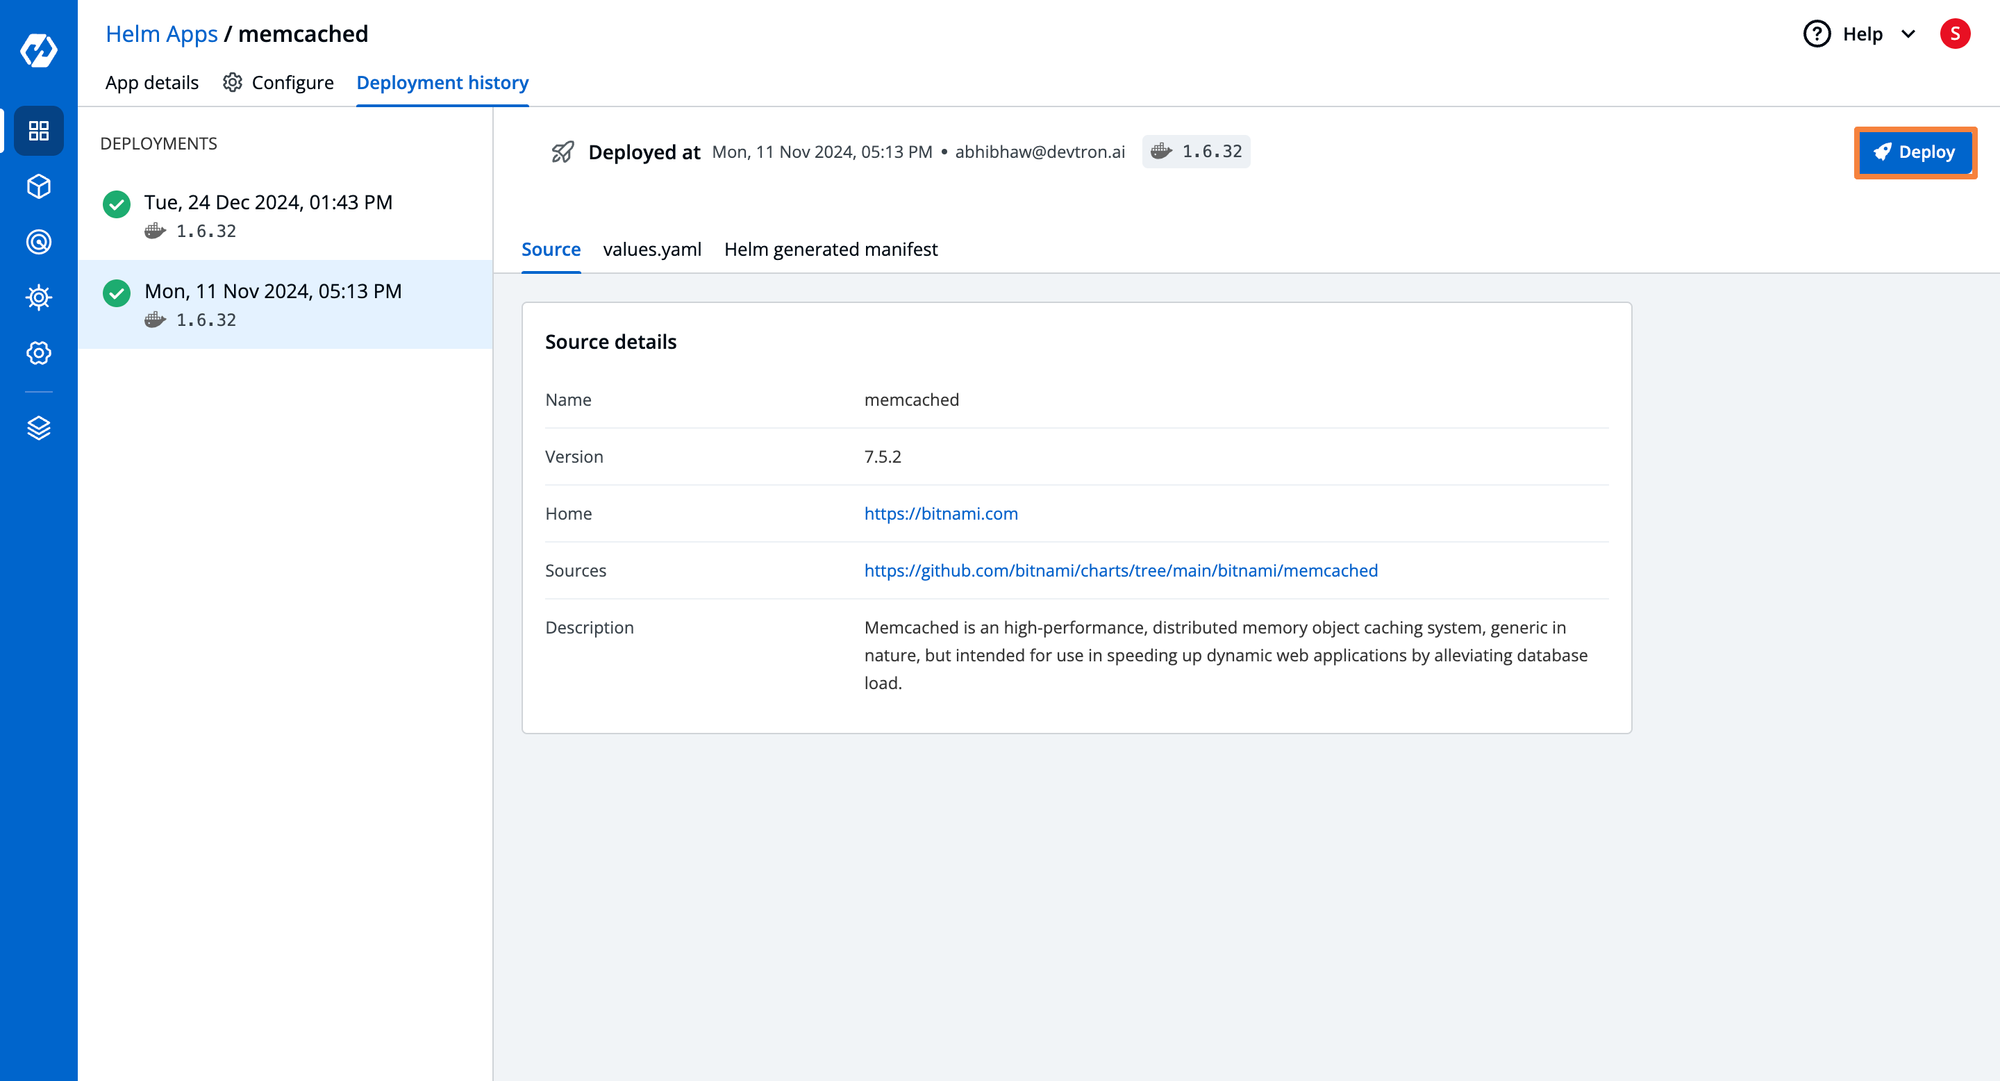
To trace the changes in applications and their configurations at scale the audit log is something that can help. The Helm dashboard of Devtron provides you with a complete audit log of each deployment of applications along with their configurations. The Deployment History of Helm dashboard provides an audit log of deployments with day-date-time for deployment, an artifact that has been deployed, values.yaml, and the Helm-generated manifest. If your new deployments does not meet the expected outcome you can perform one-click rollbacks with this Helm dashboard.
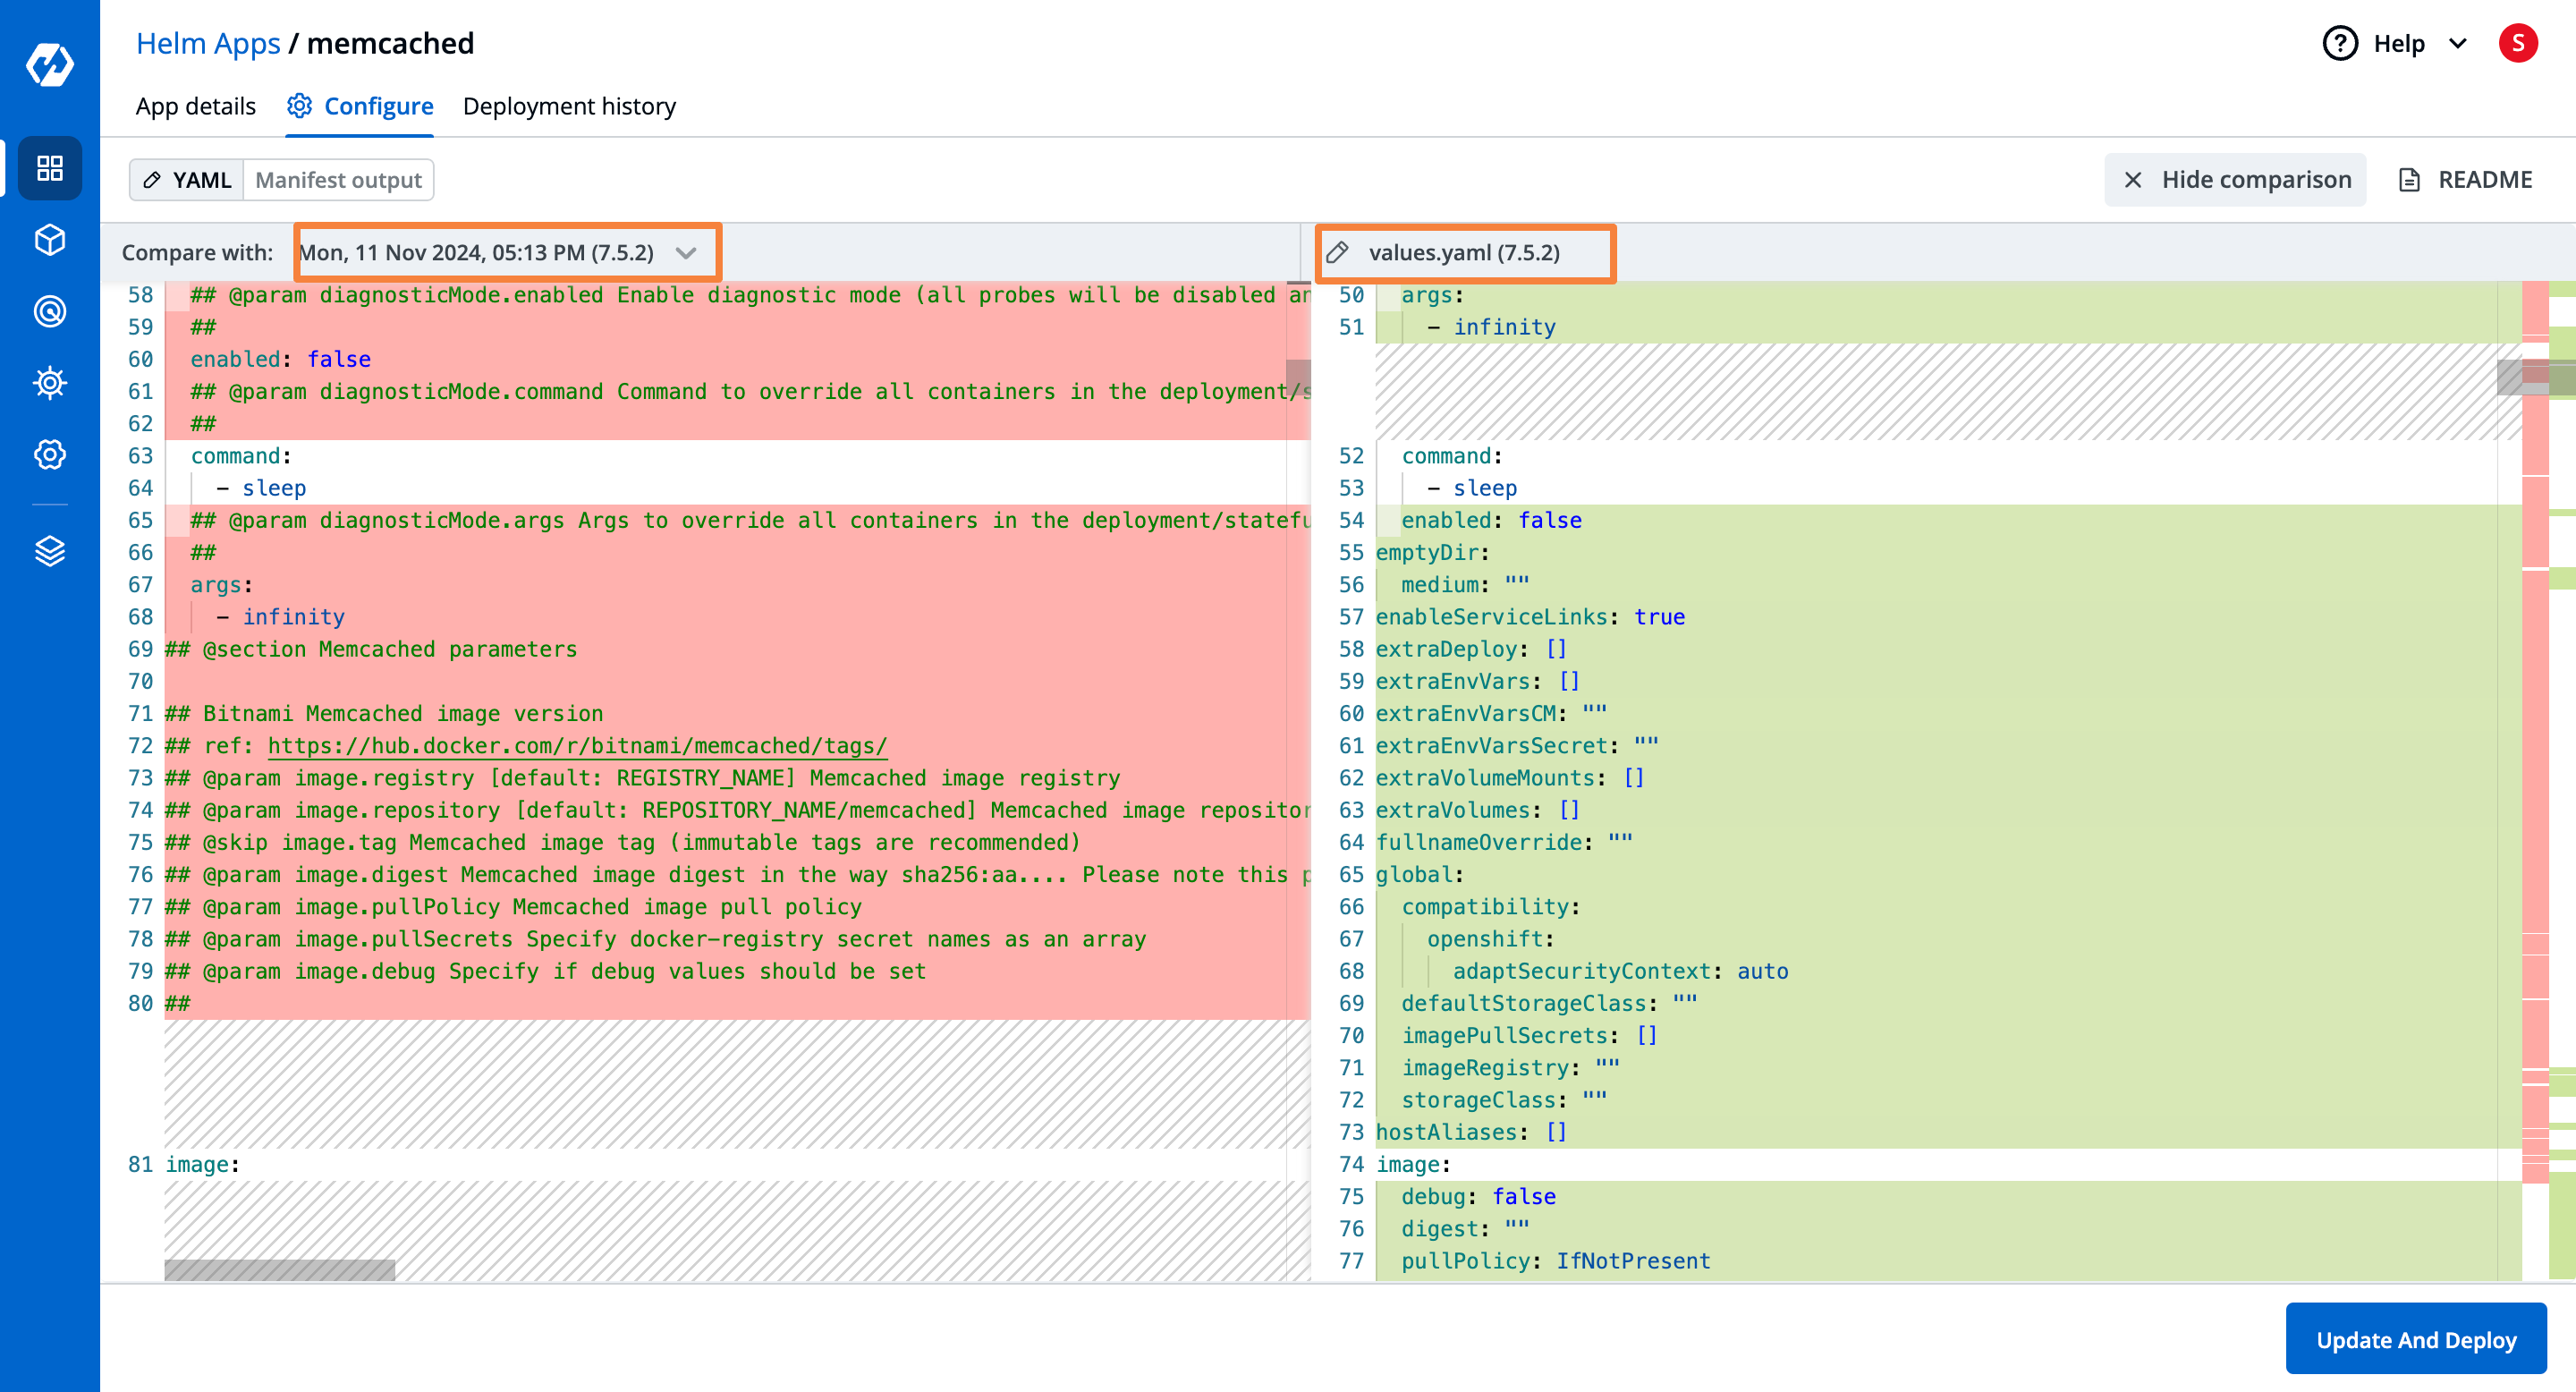
Before executing the newer version deployment of your Helm application, you may want to check the previous configurations. The Helm dashboard of Devtron allows you to compare configurations of previous deployments with the newer ones.
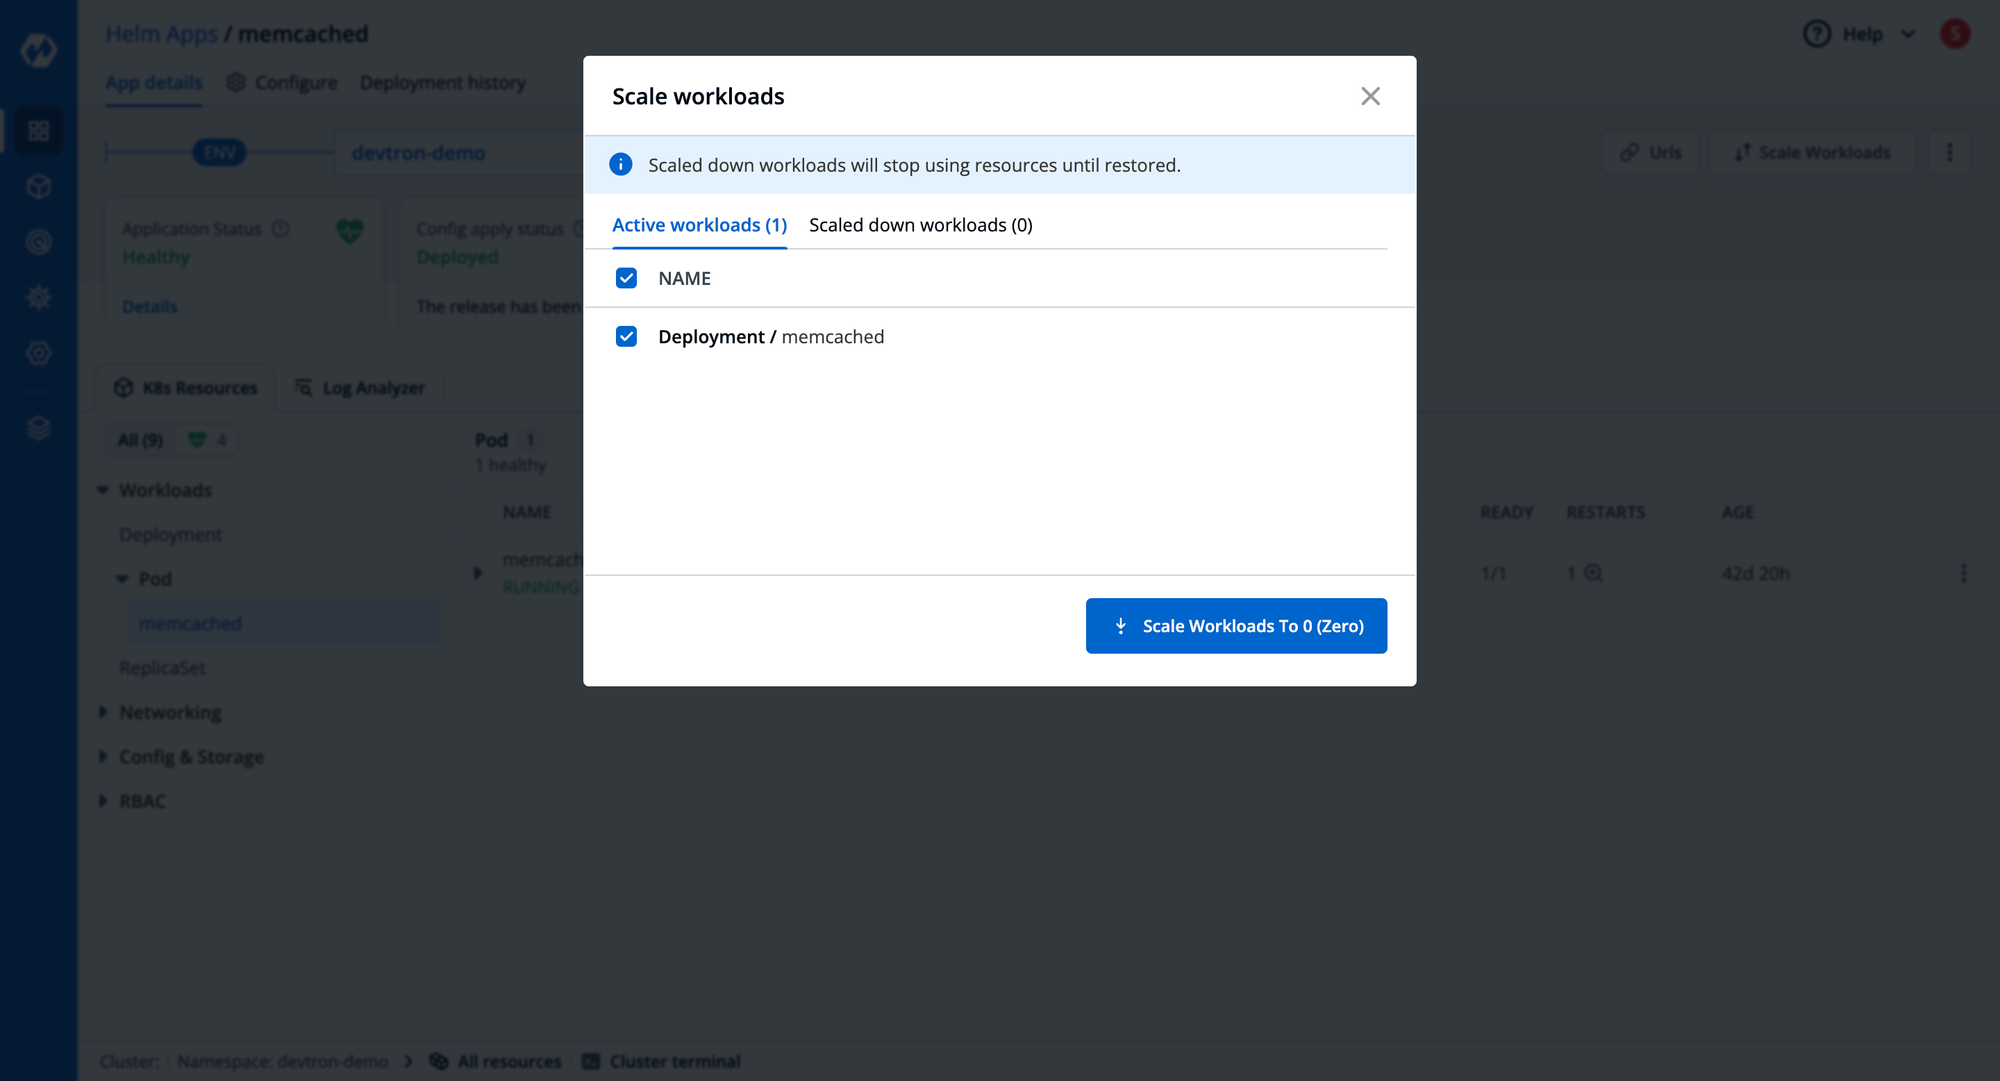
For optimizing the cost of infrastructure you may sometimes need to scale down some workloads of applications. With Devtron the workloads can be scaled down with a single click.
Additionally, Devtron lets you view the applications that are deployed via ArgoCD as well as FluxCD in the Kubernetes clusters. If a FluxCD application is deploying a Helm chart, you can view and manage the application as well.

| Capability | Devtron | Komodor Helm Dashboard |
|---|---|---|
| Deploy Helm Charts | ✅ | ✅ |
| Custom Chart Repository | ✅ | ✅ |
| Chart Catalog | ✅ | ✅ |
| GUI editor | ✅ | ❌ |
| Config Diff visualization | ✅ | ✅ |
| Chart Deployment Status | ✅ | ✅ |
| Chart Resource Status | ✅ | ✅ |
| Rollbacks | ✅ | ✅ |
| Resource grouping | ✅ | ❌ |
| Logs | ✅ | ❌ |
| Events | ✅ | ✅ |
| Pod Terminal Access | ✅ | ❌ |
| Manifest file | ✅ | ❌ |
| Ephemeral Containers | ✅ | ❌ |
| Scaling of Workload | ✅ | ❌ |
Cluster Management
Clear visibility into Kubernetes workloads is vital for maintaining application health, troubleshooting issues, and optimizing resource usage. Kubernetes orchestrates a range of components, including pods, deployments, and custom resources, which often interact in complex ways. Without proper insight, teams may struggle to assess workload performance, diagnose failures, or understand the impact of changes on the cluster. This can result in prolonged downtime, inefficient resource usage, and diminished confidence in deployments.
Visibility tools offer real-time insights into resource utilization, pod health, and the status of custom resources, helping teams quickly identify and resolve issues. For instance, detecting a pod stuck in a "CrashLoopBackOff" state or identifying misconfigured CRDs becomes significantly easier with tools that highlight these details through dashboards or CLI interfaces. By enhancing visibility, organizations can boost reliability, streamline operations, and support smoother transitions from development to production.
Komodor Helm Dashboard
Komodor’s Helm Dashboard does not provide any features to manage the Kubernetes cluster. It only lets you deploy the helm chart, and see the Kubernetes resources that are deployed as a part of the Helm chart.
Devtron Dashboard
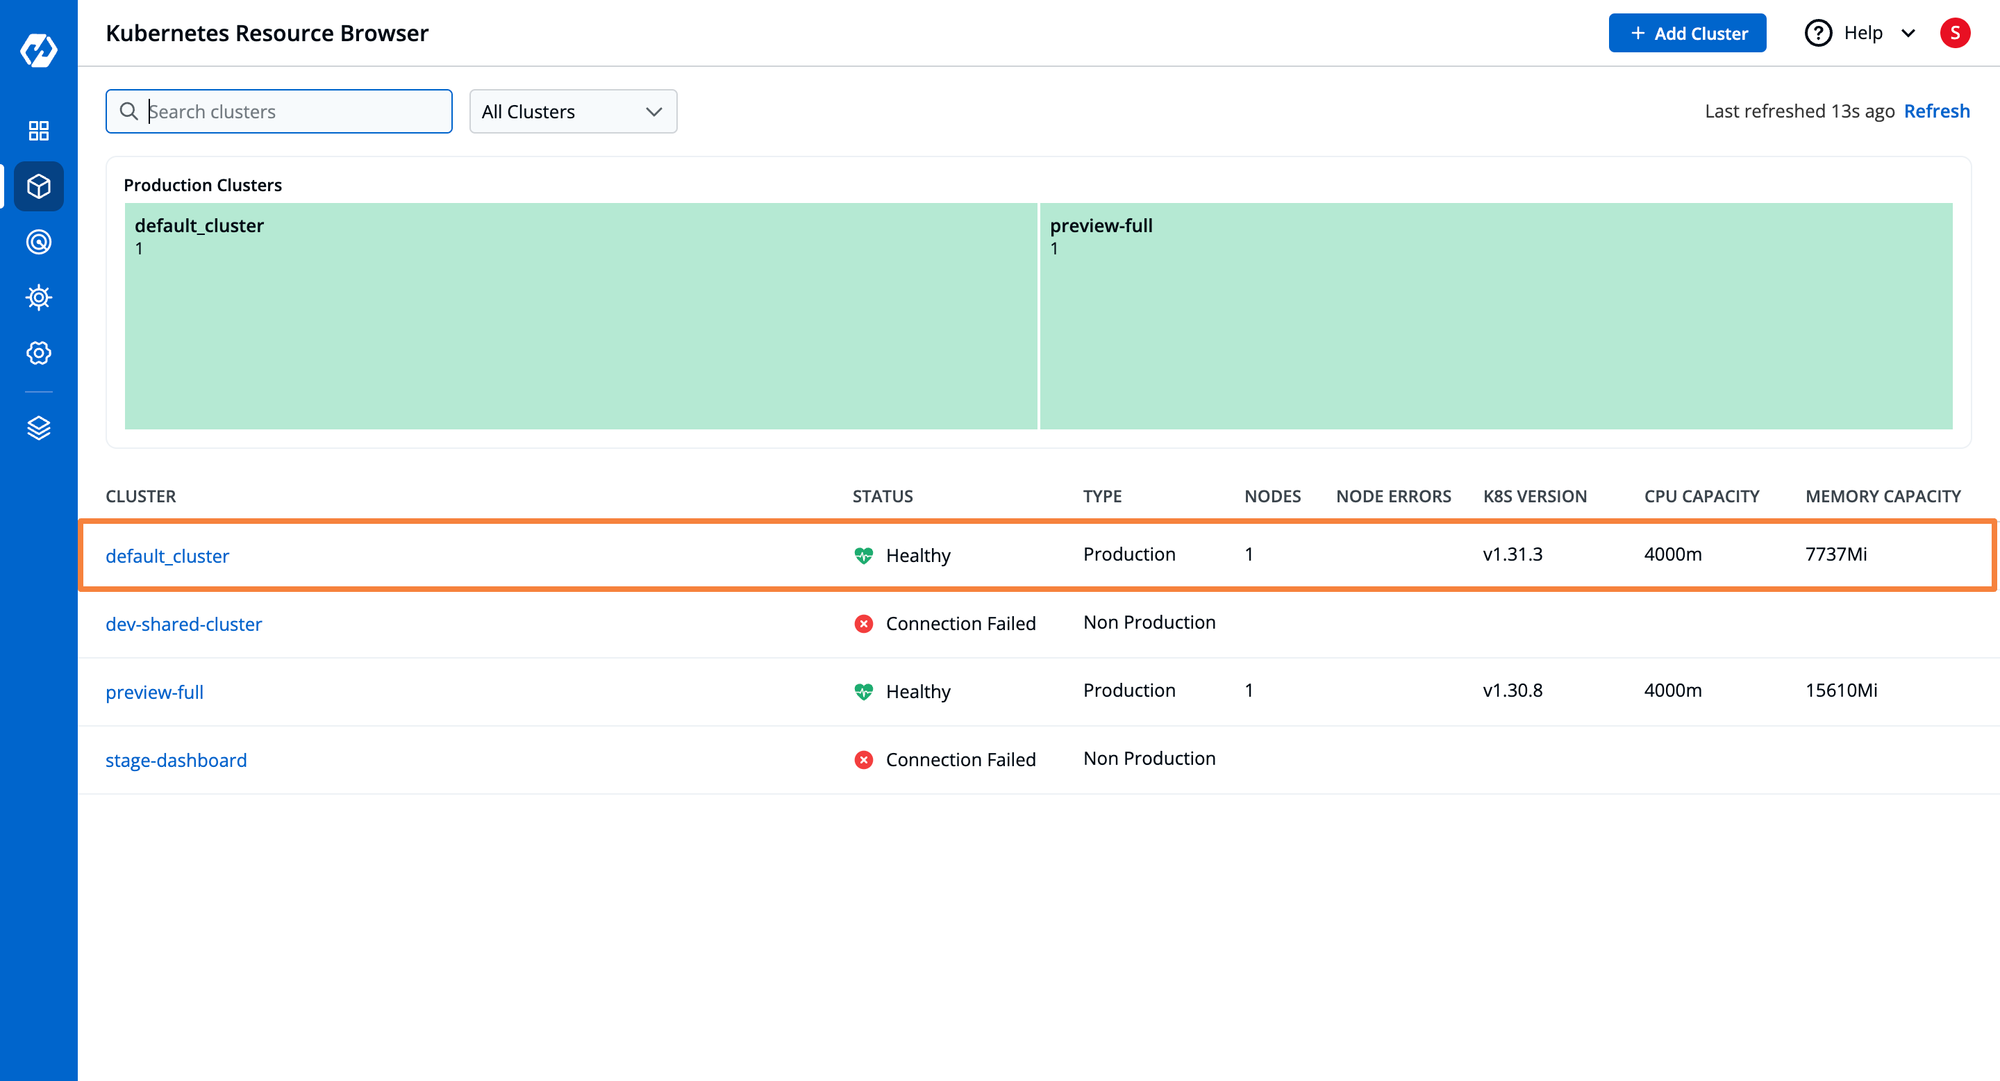
Devtron provides full visibility into the cluster through its Resource Browser. As the name suggests, it shows you a complete list of the resources within the cluster. As you can see in the below image, the resource browser has listed all the clusters connected to Devtron along with useful information such as CONNECTION STATUS, NODES, NODES ERRORS, K8S VERSION, CPU CAPACITY, and MEMORY CAPACITY of each Kubernetes cluster.
*Within the enterprise version of Devtron, you can also visualize all the different clusters that are connected to the cluster.
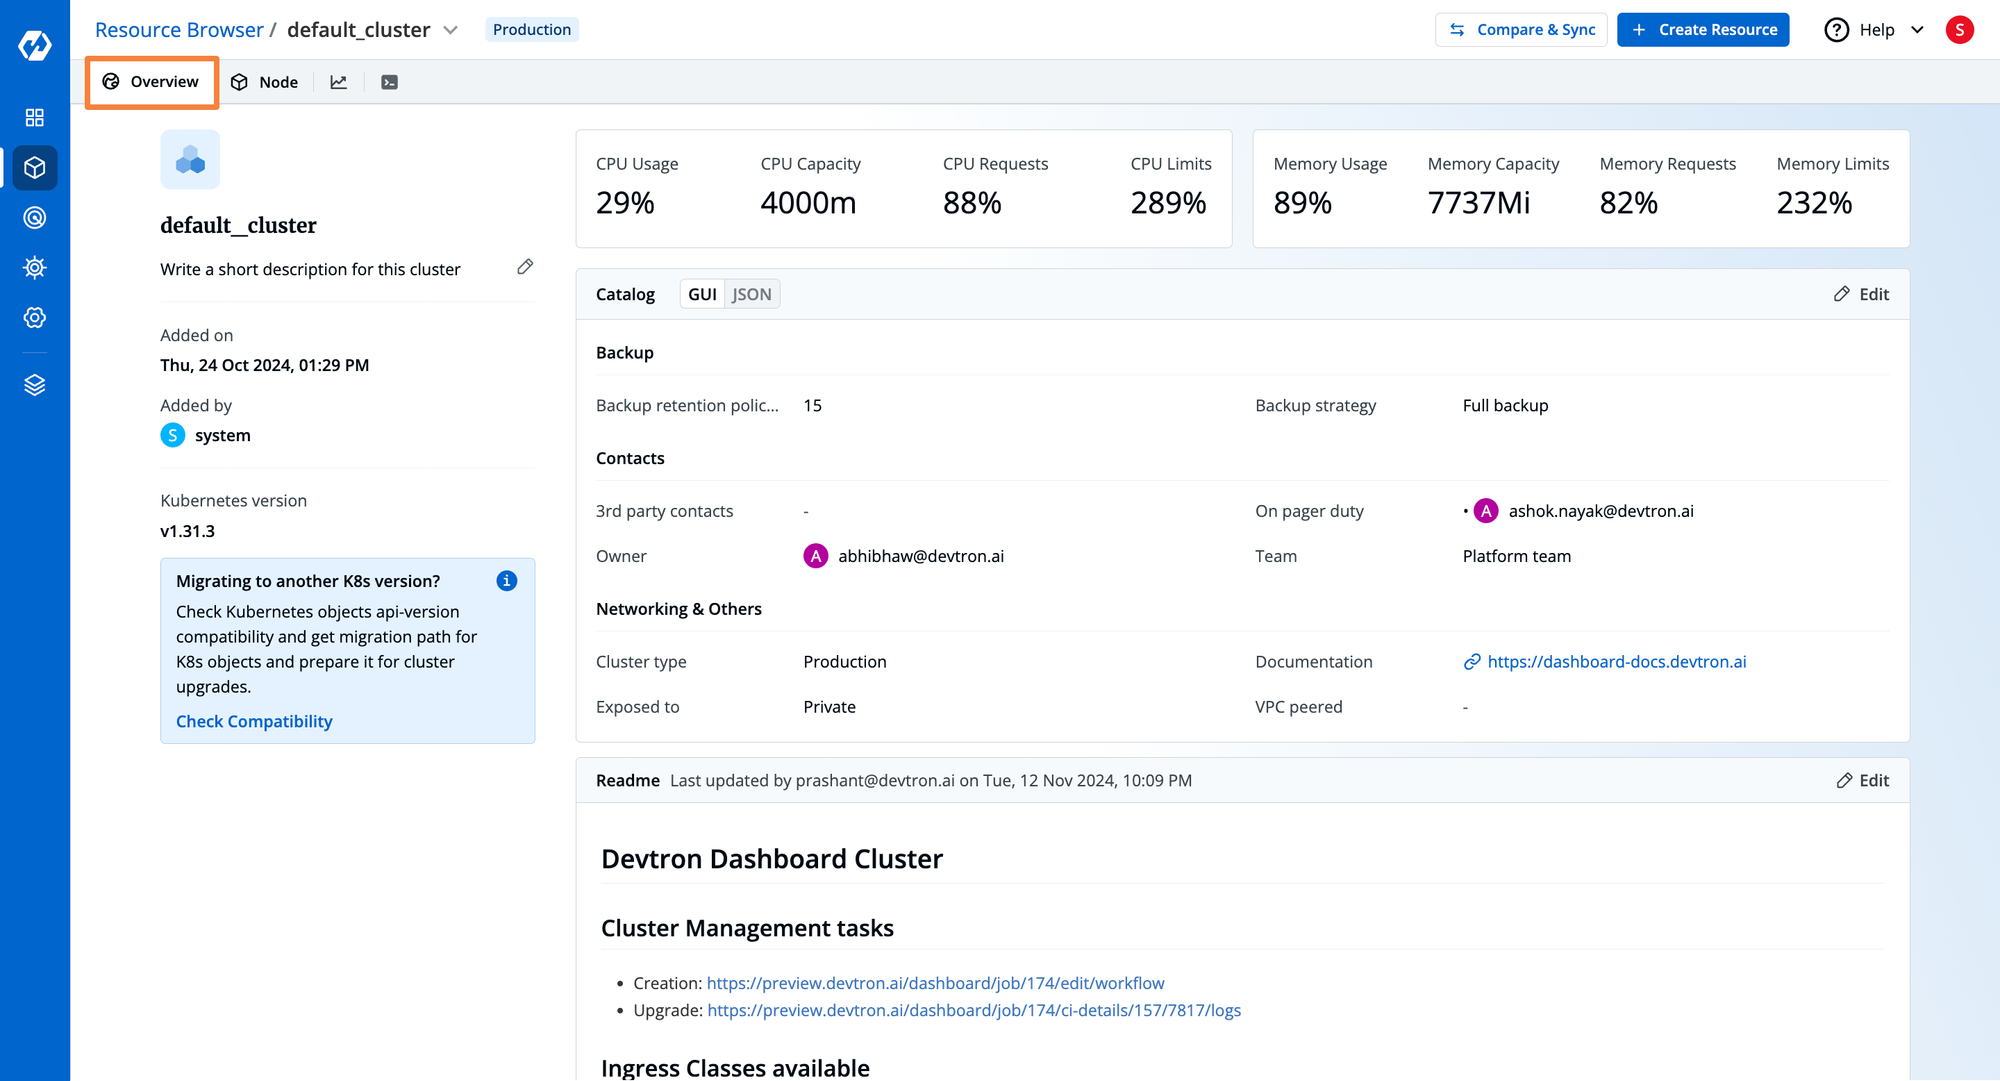
When navigating to each cluster you get an Overview of the selected Kubernetes cluster. You can visualize information about the utilization and availability of assigned resources, the owner of the cluster, and a Readme file where we can describe the cluster. The Readme attached to the Kubernetes cluster can help teams collaborate and understand the purpose and configuration of our cluster.
* The enterprise version of Devtron comes with additional features such as a catalog framework which lets you create a custom catalog that contains information about the cluster such as Cluster owners, backup strategies, etc. There is also an integration with silver-surfer which helps during Kubernetes cluster upgrades by showing the APIs with breaking changes.
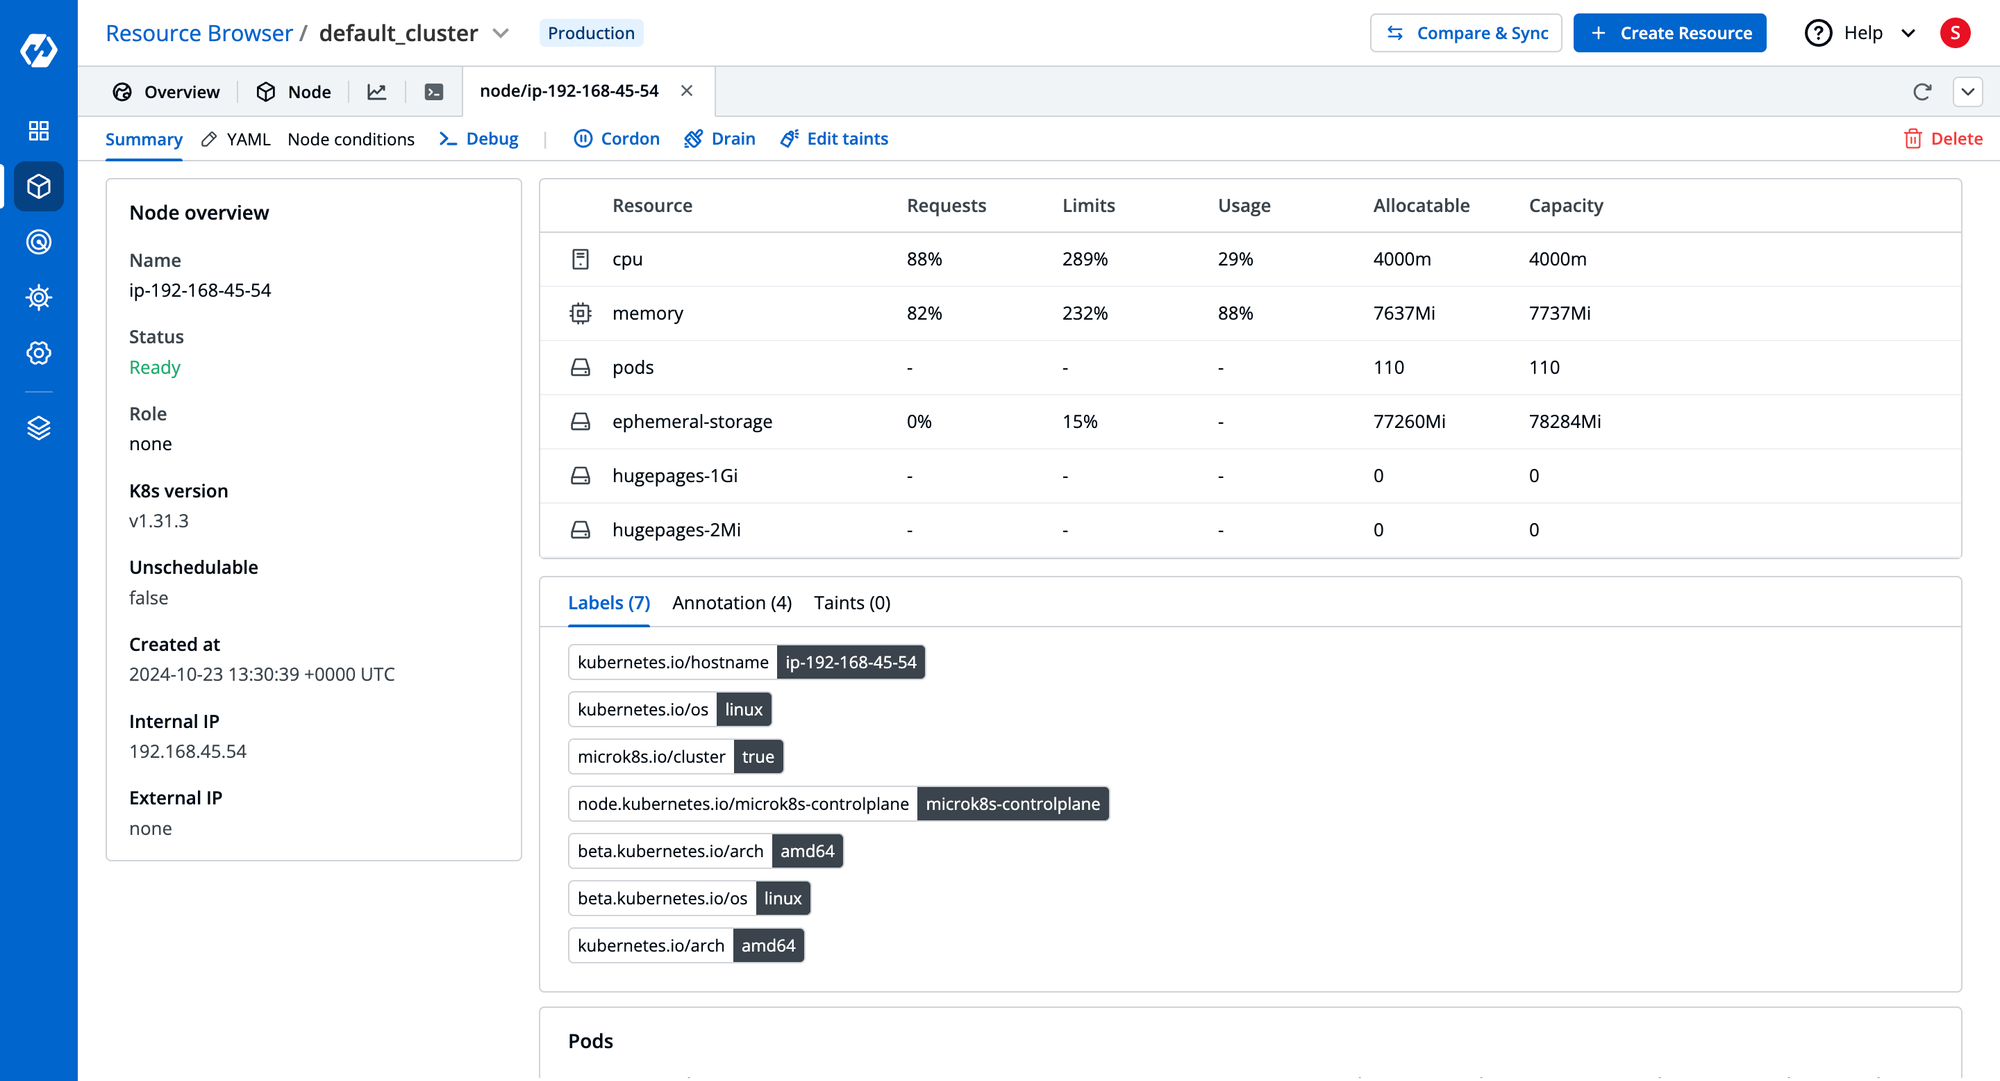
At the Node level of the Kubernetes cluster, Devtron’s Resource Browser allows executing essential operations like visualizing and editing live YAML manifest, viewing the Node Conditions, Debug (Devtron provides a dedicated terminal for each node), Cordon, Drain, Edit the taints, and Create & delete Resources.
Along with the above operations, the Node Overview tab shows resource consumption by the node, along with the pods running on the specific node.
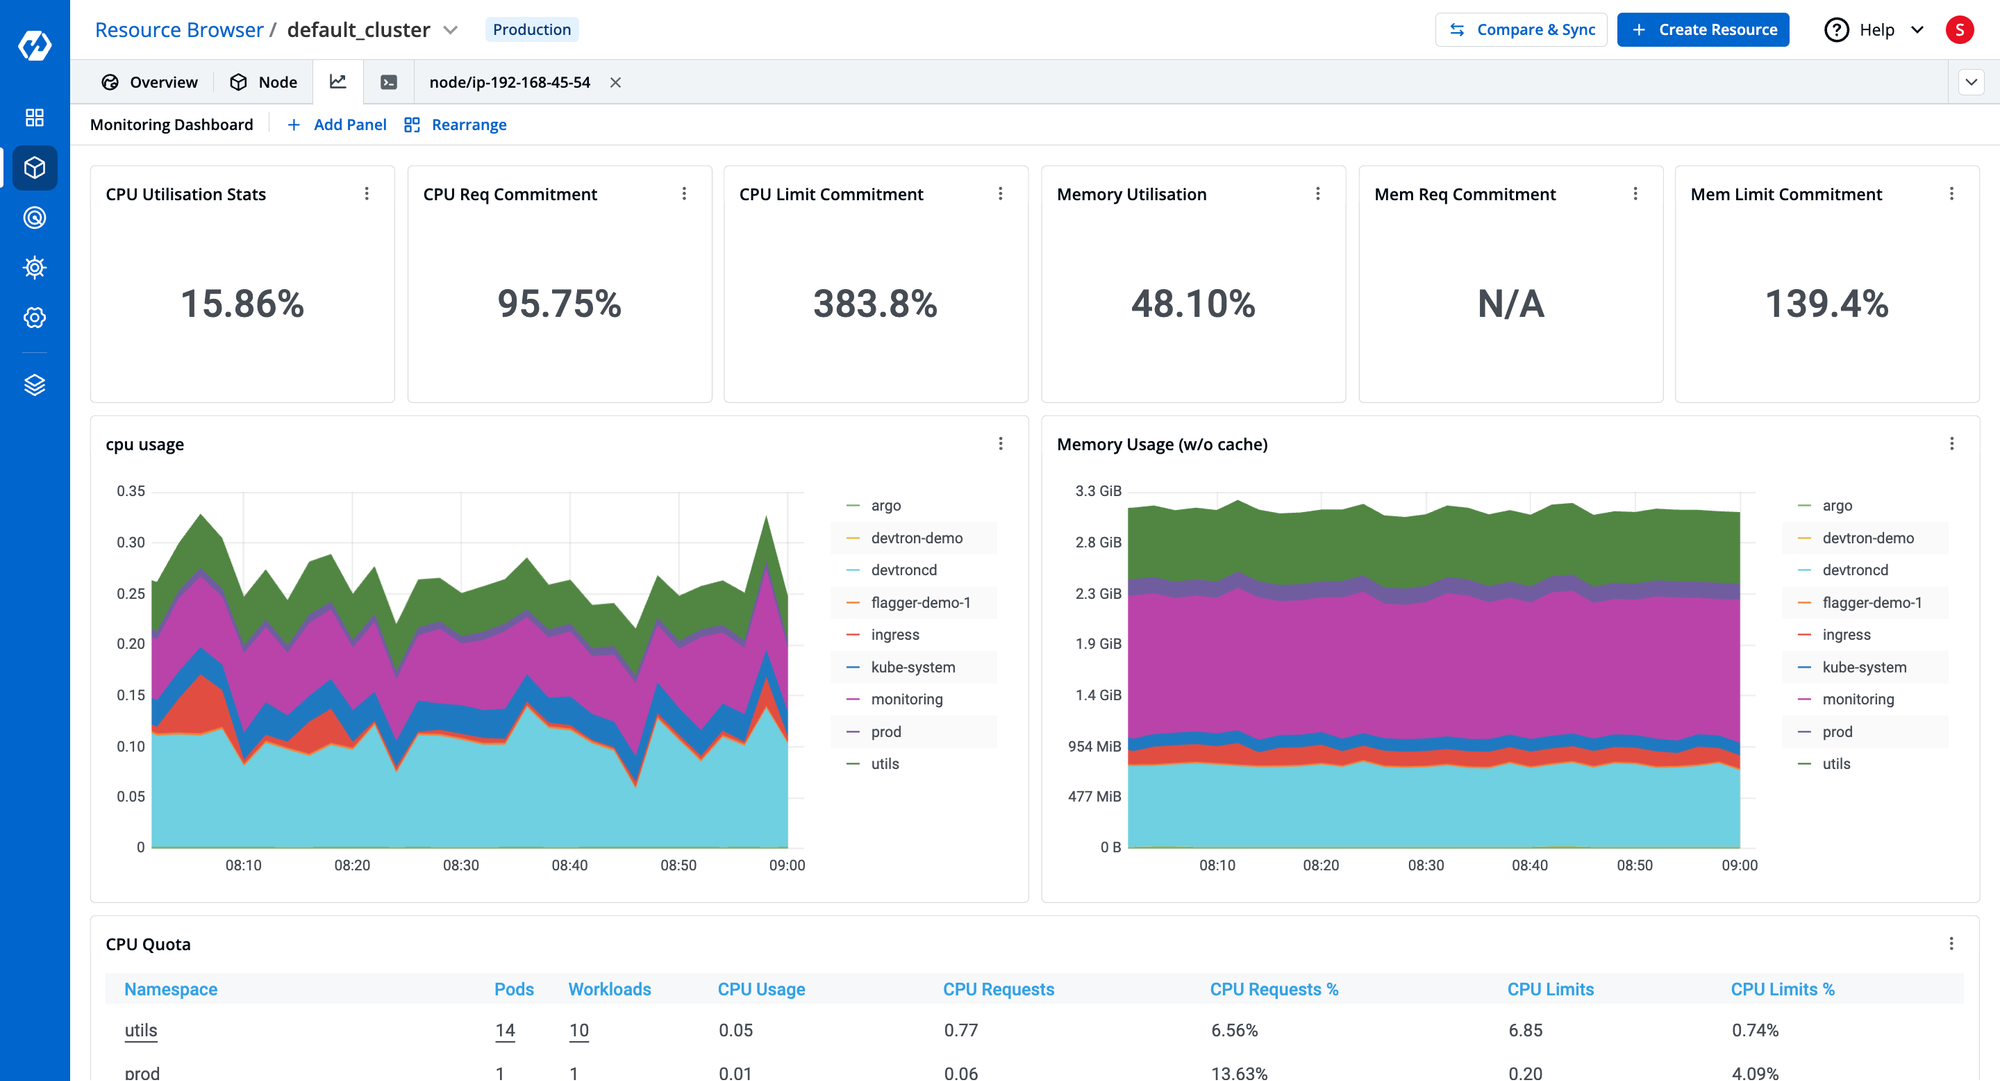
Devtron’s Kubernetes dashboard also has a fully customizable monitoring dashboard. This dashboard can be used to fetch and visualize custom metrics from Prometheus and Grafana dashboards. The layout can be customized as you wish, and the metrics are embedded using iframes.
The Namespace tab of Devtron’s Resource Browser lists out all namespaces from specific Kubernetes clusters. It allows us to perform actions over the namespace like visualize and edit live Manifest, check for namespace events, and Delete namespace.

The Resource Browser of Devtron provides a lot more capabilities compared to Komodor’s Helm Dashboard. Unlike Komodor’s Helm Dashboard where there is no way to troubleshoot the resources, Devtron can launch a cluster-wide terminal within which you can run kubectl commands, without leaving the Devtron dashboard. This helps reduce context switching. Within Komodor’s Helm Dashboard, you constantly need to context switch to a CLI for performing any kubectl operations.
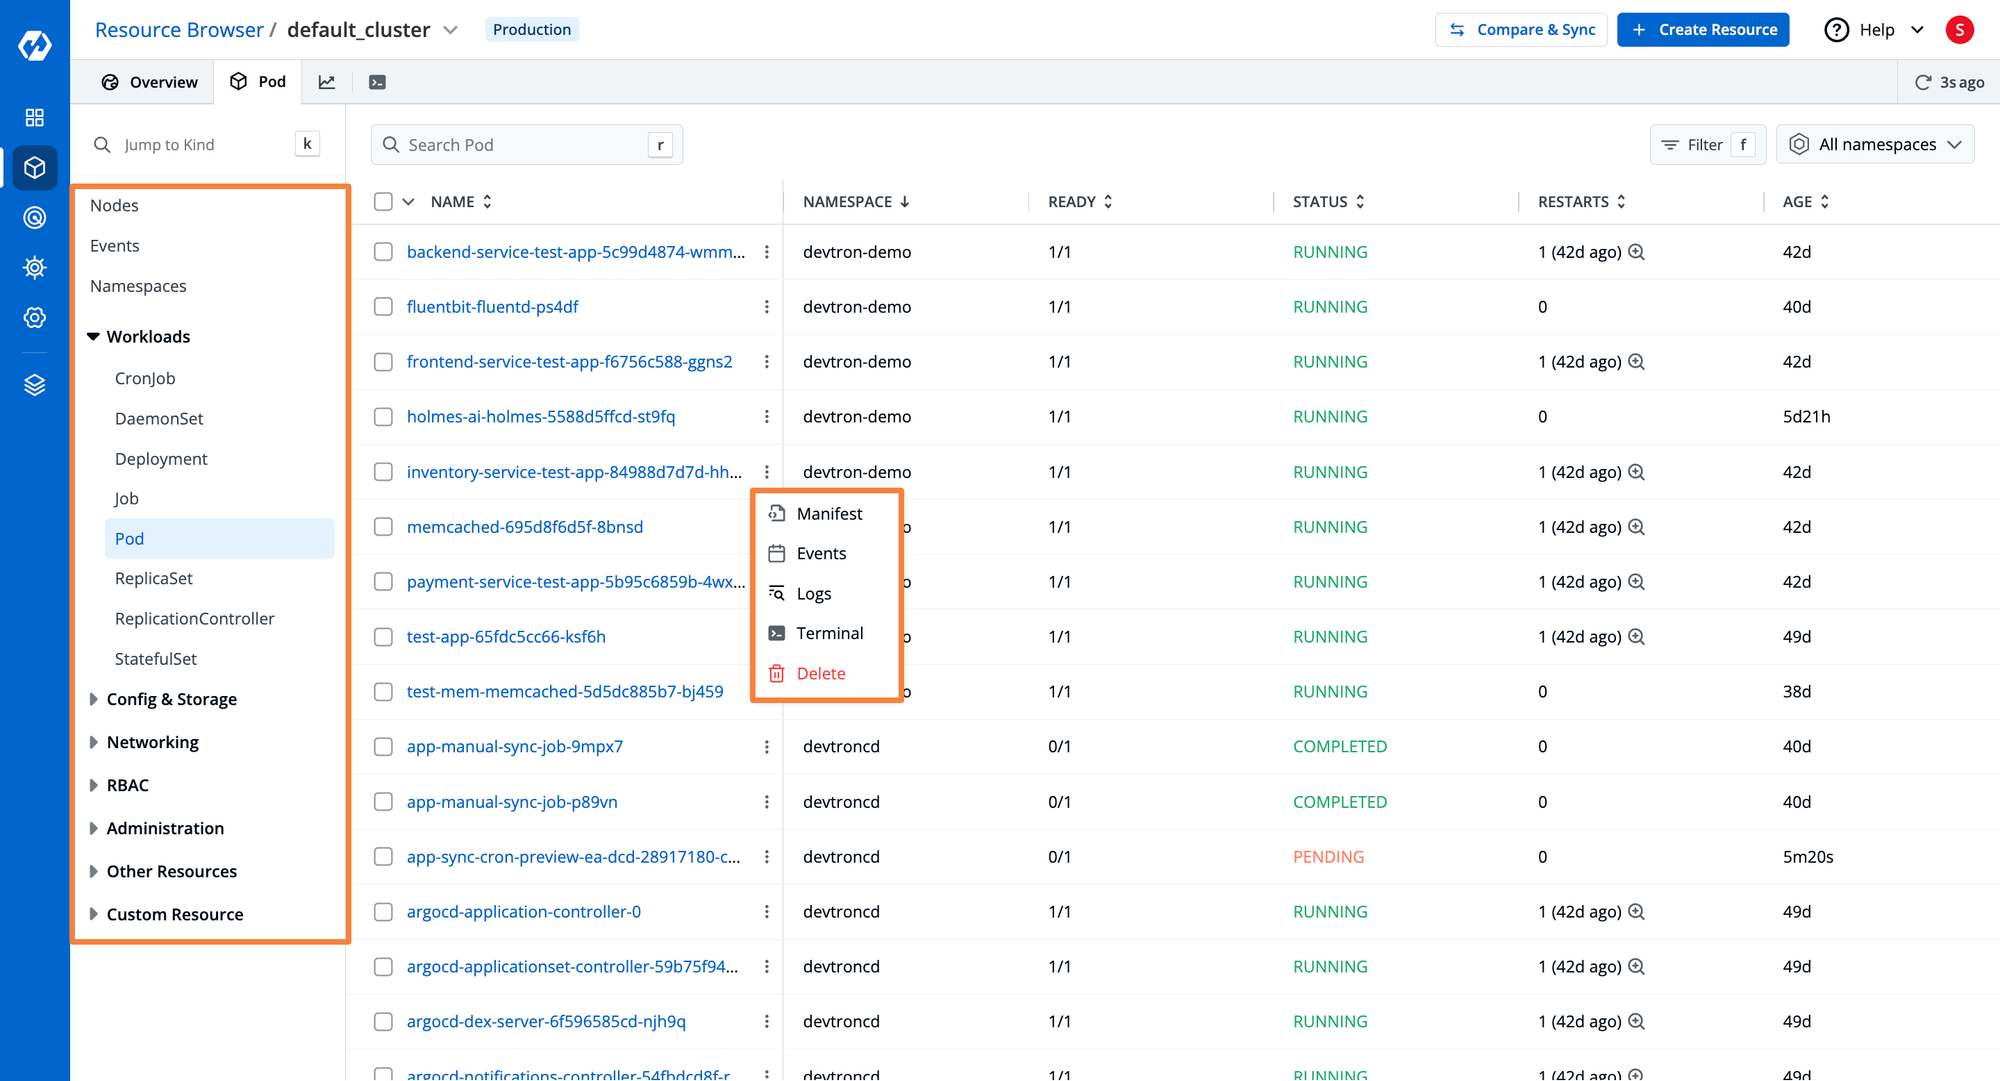
The Resource Browser of Devtron lists out all the workloads with visibility for their namespace, current status, restarts, IP, and node. The Resource Browser has a logical separation of different Kubernetes resources. As an example, the workloads category consists of K8s objects like CronJob, DeamonSet, Deployment, Job, Pod, ReplicaSet, Replication Controller, and StatefulSet. Other resources of the Kubernetes clusters are being listed accordingly under categories like Config & Storage, Networking, RBAC, Administration, Other Resources, and Custom Resources.
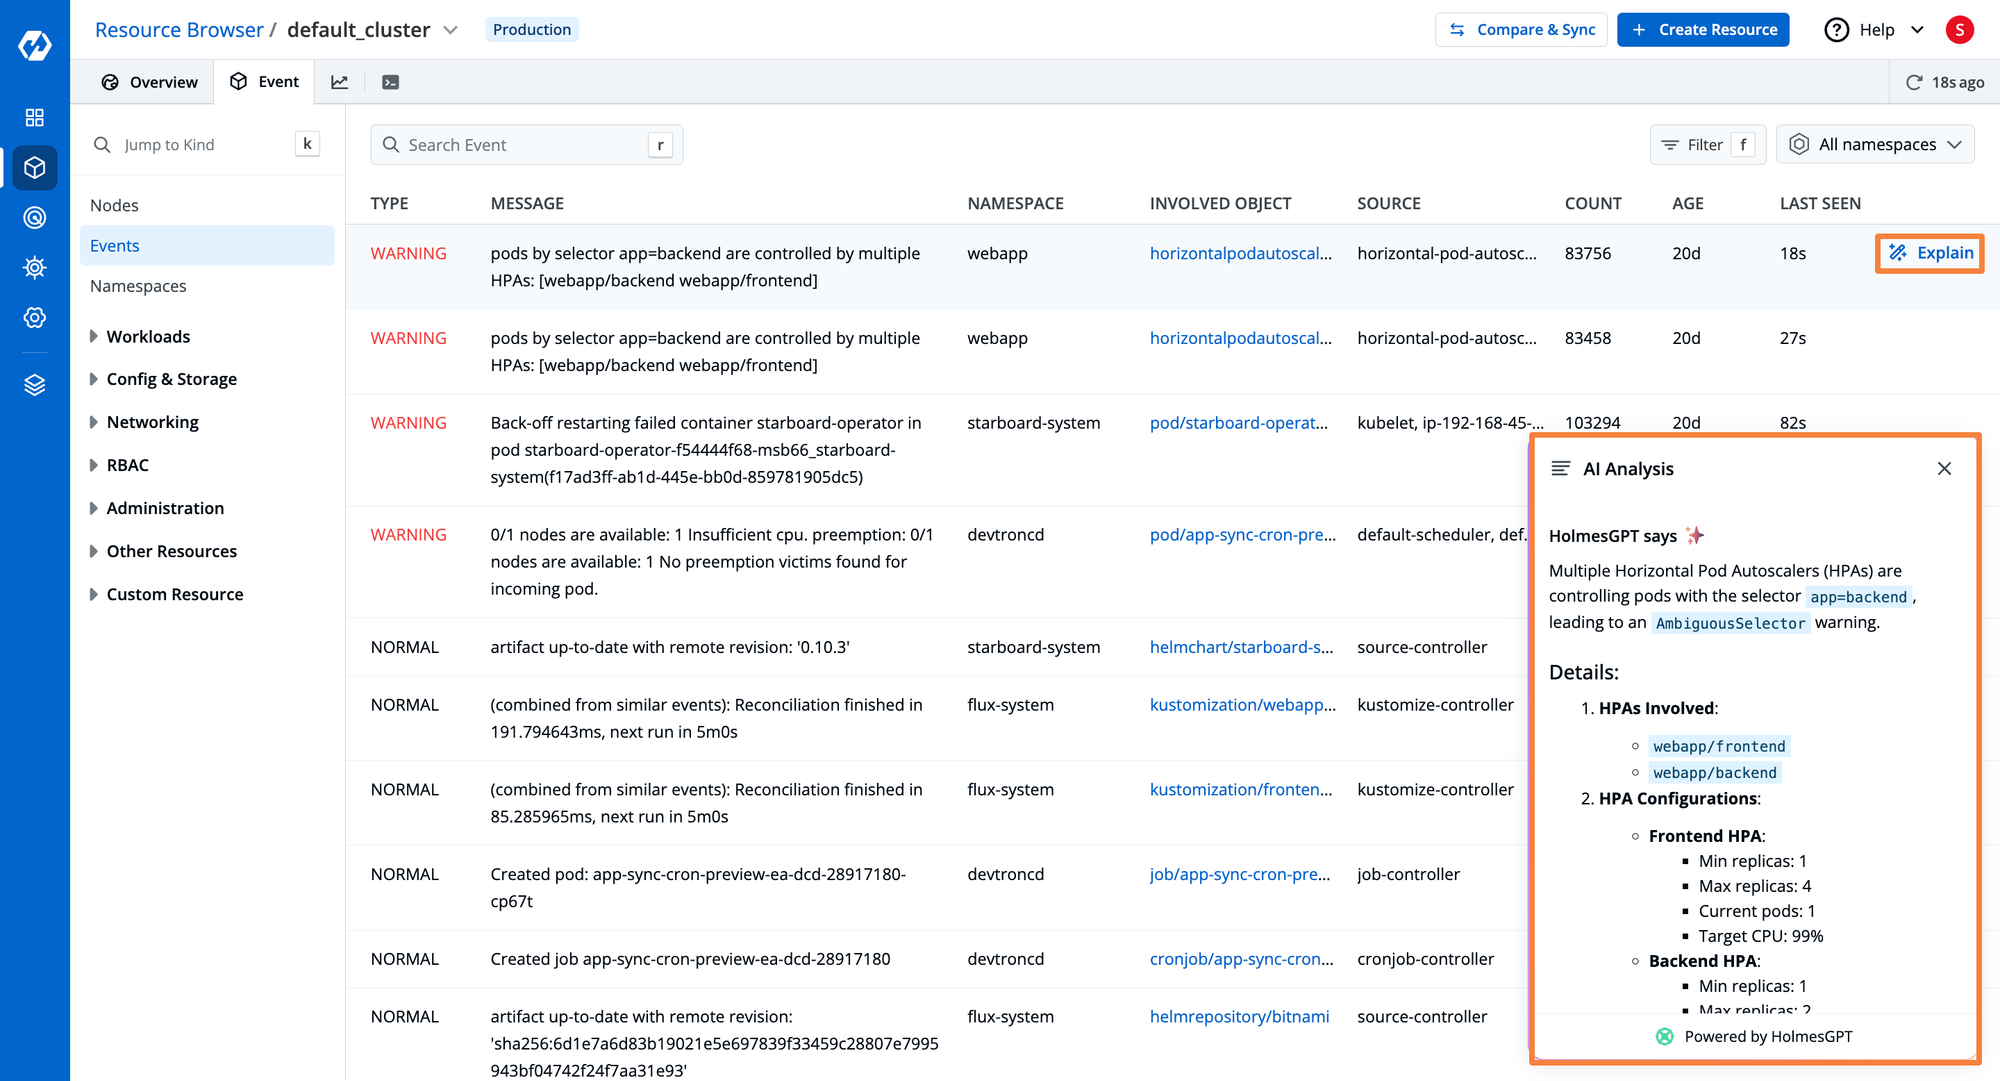
When debugging any cluster events, it can often get tricky to understand the problems that are occurring and what can be the action steps to resolve the problem. Devtron has a built-in AI tool that will analyze the events and help you gain actionable insights into warnings and error events.
On Workloads like Pods, it is possible to execute actions like visualizing and editing live Manifest, checking Events and logs, and exec into a particular container running in the pod. When you exec, you have the option to select the particular shell that you want to use and are familiar with.
| Capability | Devtron | Komodor Helm Dashboard |
|---|---|---|
| Multi-Cloud & Multicluster Management | ✅ | ❌ |
| Terminal Support for Kubernetes Nodes | ✅ | ❌ |
| Real-time Logs | ✅ | ❌ |
| Support for the custom image to use tools like k9s, netshoot, busybox, and kubectl, for debugging | ✅ | ❌ |
| Dedicated Panel for Cluster Resource Monitoring | ✅ | ❌ |
| Preconfigured RBAC Access Management | ✅ | ❌ |
| Resource Grouping of all K8s resources present in Cluster | ✅ | ❌ |
Security & Collaboration
Security in a Kubernetes dashboard is crucial, as it serves as a centralized interface for managing clusters, workloads, and sensitive configurations. Without adequate security measures, such dashboards can become vulnerable to unauthorized access, potentially leading to data breaches or accidental misconfigurations that disrupt operations.
Role-Based Access Control (RBAC) is fundamental to securing Kubernetes dashboards and enabling safe team collaboration. By assigning roles with specific permissions, RBAC ensures that users can only access and modify resources within their scope of responsibility. For example, a developer might have permission to view logs and deploy applications but be restricted from altering cluster-wide settings. This separation of duties reduces the risk of errors, safeguards critical resources, and allows teams to work simultaneously without conflicts. By providing targeted access, RBAC not only strengthens security but also facilitates effective collaboration.
Komodor Helm Dashboard
Komodor’s Dashboard does not have any security or collaboration features. It runs as a binary file locally and uses your KubeConfig file to authenticate to clusters. Every team member will have to download and run the binary on their local systems. Their level of access will be restricted according to the level of access defined in their specific KubeConfig files.
Devtron Dashboard
Devtron has a dedicated tab under Global Configurations for Authorization where you can manage access to your Kubernetes infrastructure. You can Add Users by navigating to the User Permission tab of Devtron, where you will be able to configure a robust Resource Base Access Control (RBAC) for each user. For each new user, you can configure access down to the smallest unit of your Kubernetes cluster through an intuitive user interface.
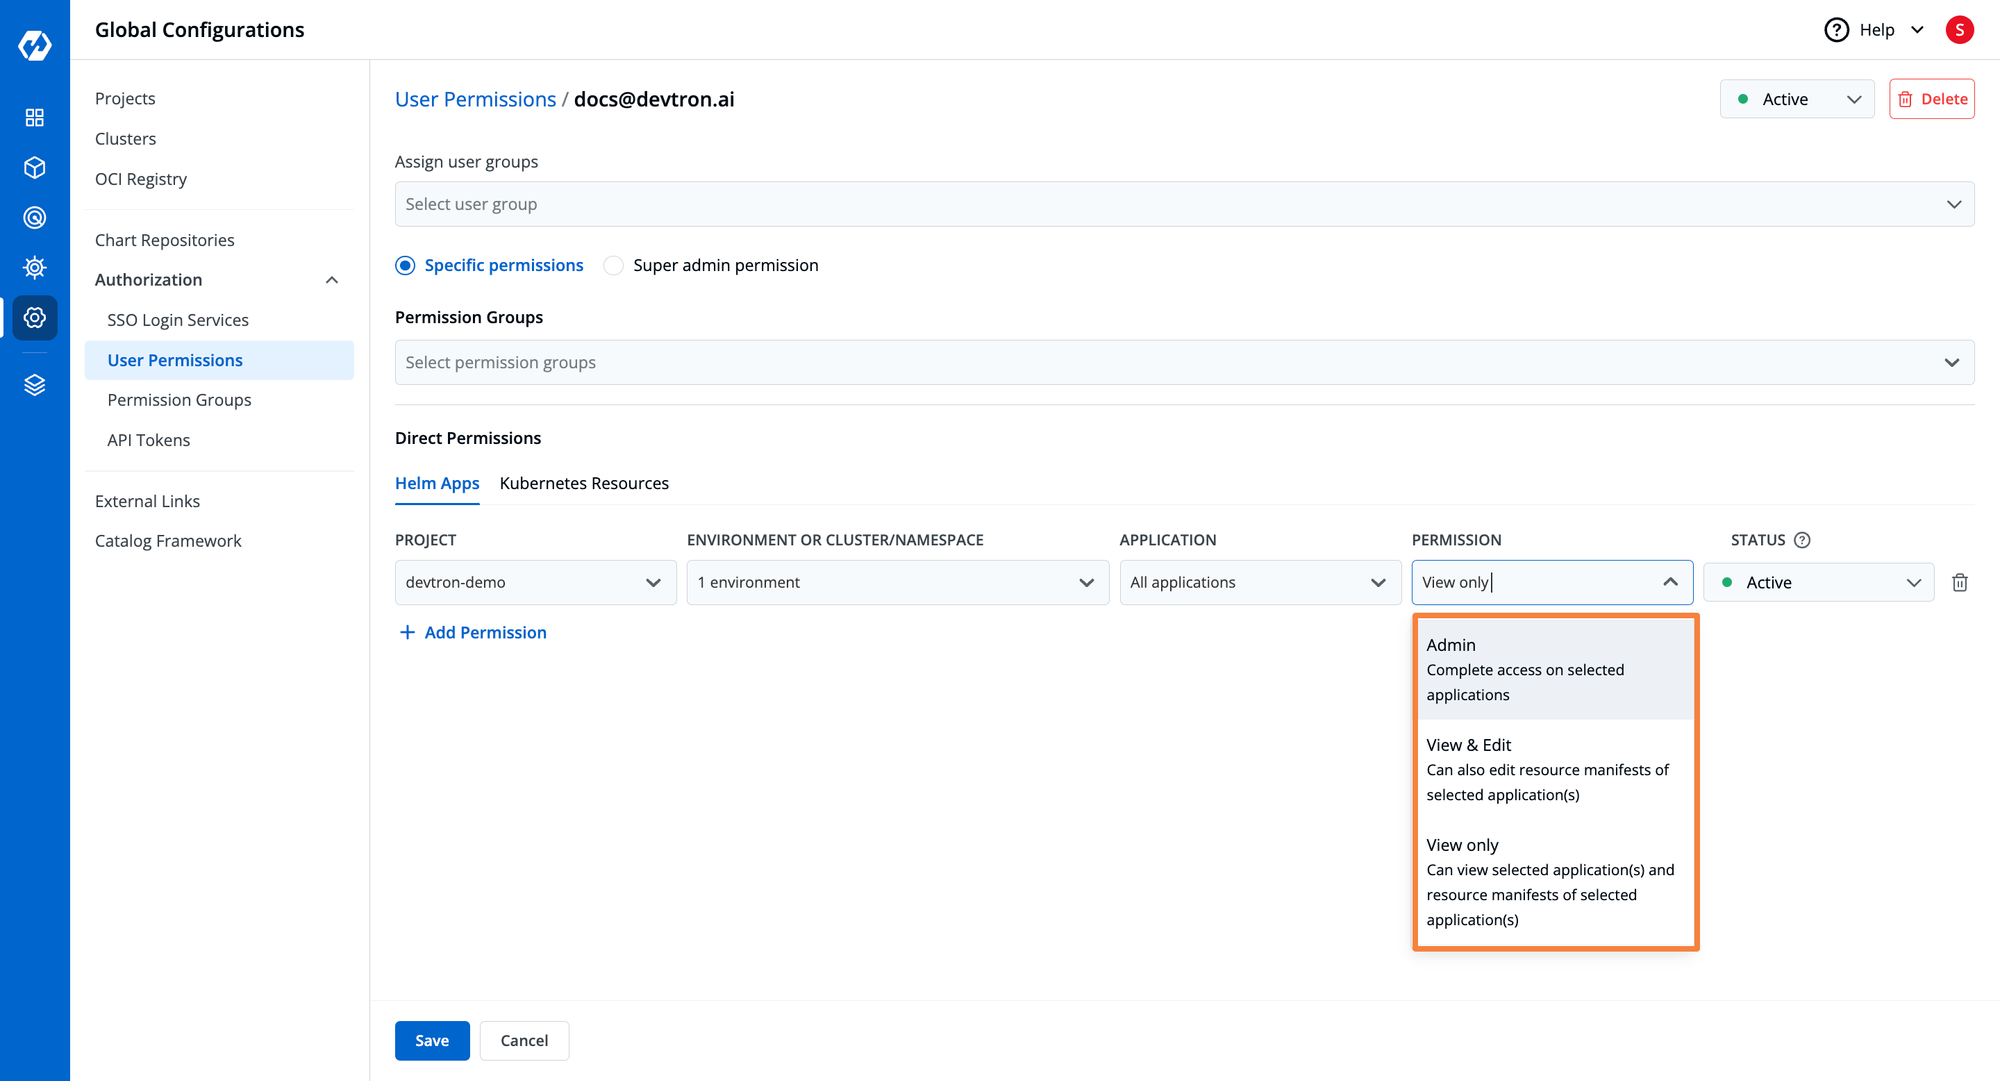
Devtron provides you support for defining Permissions Groups to which you can attach some specific permissions and the same permissions will be applied to users added to the group. For example, for every new joiner in the team, you can give `view access` to some application that you want them to see and these permission groups can be directly assigned whenever you add a new user.
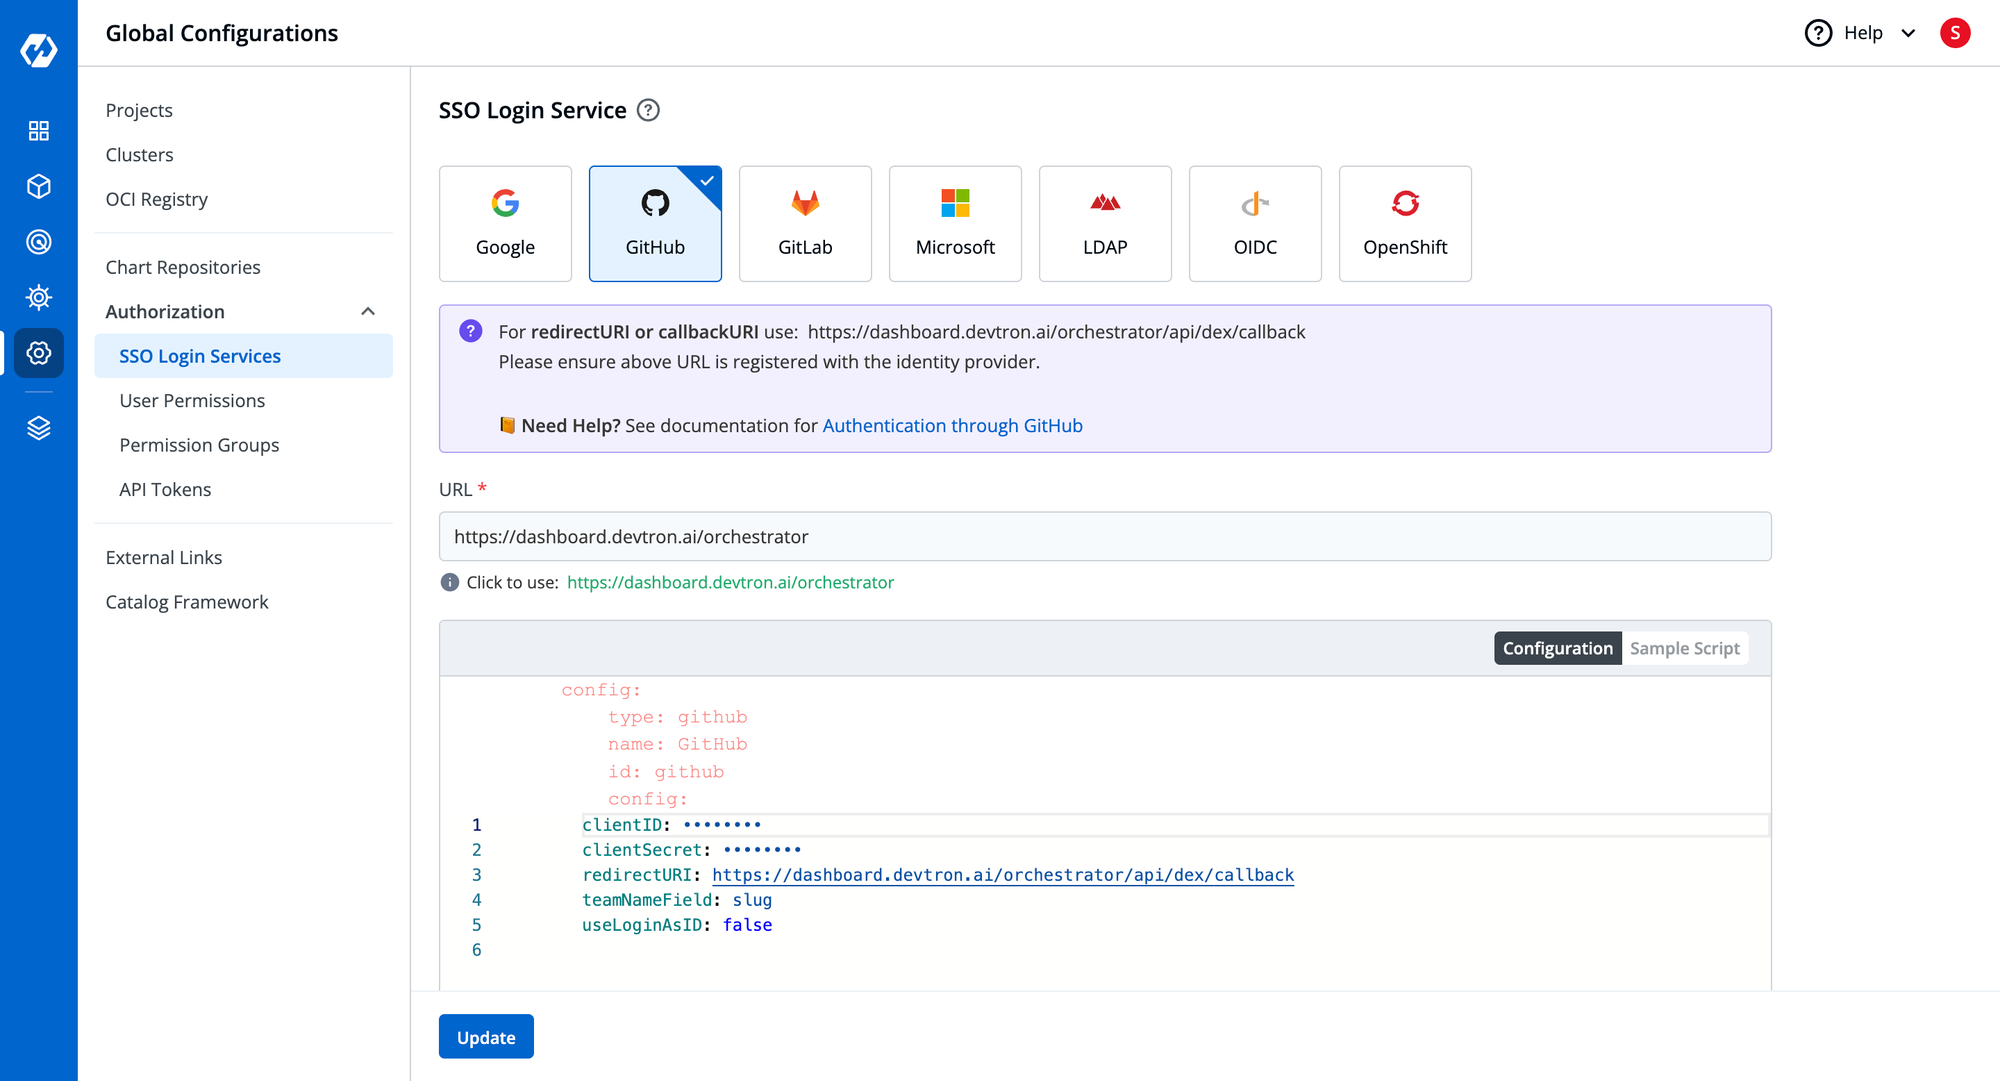
For the ease of accessing your Kubernetes infrastructure and to eliminate the headache of maintaining separate credentials for accessing Devtron’s dashboard, Devtron has support for Single Sign-On(SSO). Where you get seven SSO options to choose one whichever suits you and your teams.
| Capability | Devtron | Komodor Helm Dashboard |
|---|---|---|
| SSO (Github, Google, Gitlab, OIDC) | ✅ | ❌ |
| Kubernetes RBAC | ✅ | ❌ |
| RBAC for Dashboard Access | ✅ | ❌ |
| Time-based Access | ✅ | ❌ |
| Team Collaboration | ✅ | ❌ |
Conclusion
In conclusion, while both Komodor's Helm Dashboard and Devtron offer valuable tools for managing Helm charts, they cater to different needs in the Kubernetes ecosystem. Komodor's Helm Dashboard is a focused solution designed to streamline the process of deploying, upgrading, and managing Helm charts, with handy features like rollbacks, version diffs, and integration with custom chart repositories. It is a great option for teams primarily concerned with Helm chart management in a simpler, more lightweight manner.
On the other hand, Devtron provides a comprehensive platform that goes beyond just Helm chart management. With advanced features such as role-based access control (RBAC), team collaboration tools, and cluster management capabilities, Devtron is a more robust solution for organizations looking for a centralized dashboard to observe and manage their Kubernetes workloads, Helm applications, and collaborate across teams. For teams seeking an all-in-one DevOps solution that supports the full Kubernetes lifecycle, Devtron offers a more expansive feature set to meet these needs. Ultimately, the choice between these two tools depends on the complexity of your infrastructure and your team's requirements for scalability, security, and collaboration.
If you have any questions, or want to discuss any specific usecase, feel free to connect with us or ask them in our actively growing Discord Community.

