Platform engineers are hired to build reliable systems, not to spend their days hunting through disconnected data streams. Yet the reality of incident response has become an investigative exercise that consumes a disproportionate amount of engineering time. On average, platform teams spend 60% of their time addressing issues that arise and 40% on actually building reliable systems.
When an alert fires at 2 AM, the platform engineer has to begin with: Was it the recent deployment? A resource constraint? A dependency failure? The answer hides somewhere in the 15+ dashboard of the point solution that was employed to build the system, each offering a fragmented view of what happened. The platform engineer has to collect these pieces, connect them, and find the root cause.
This isn't a failure of engineering competence; it's a structural limitation of how systems are being built. “Collect multiple point solution tools and put a single pane of glass.” During the incident, this single pane of glass does not provide answers to questions like "What broke, why, and what should I do about it?" The platform engineer has to dig into multiple dashboards to get the answers.
Each transition between tools requires rebuilding context. Engineers need to remember the timestamp from the metrics dashboard, the deployment ID from the CI/CD logs, and the service identifiers from your tracing system. Then manually map relationships between these data points.
The result of all this:
- Increased Mean Time to Resolution (MTTR): Each tool transition adds minutes to the investigation. For complex incidents spanning multiple services, this can extend resolution time from minutes to hours.
- Investigation fatigue: Engineers lose critical details as they move between interfaces. Important correlations get missed because the human working memory can only hold so many variables at once.
Knowledge silos: Effective incident response becomes dependent on knowing which tools to check and in what order. This tribal knowledge doesn't scale and creates bottlenecks around senior engineers (Hero Engineers) who've internalized these workflows.
Consolidating the Investigation Path
Devtron brings together everything happening in your Kubernetes environments. Your applications, the infrastructure they run on, and their complete operational history. Everything into one connected view. When an alert fires, you don't just get a notification. You get the full story: what's failing, what it depends on, how it got to this state, and what else might be affected. The platform presents the complete picture, so your team can understand the situation quickly and respond with confidence.
Unified Visibility
When production stops working at 2 AM, engineers don't need another dashboard; they need answers. Is the problem in the application code? A misconfigured deployment? Infrastructure resources hitting limits? Or a cascading failure across multiple layers?
Devtron consolidates these fragmented views into a single operational model. When an alert fires, the platform presents the complete system state: application health, infrastructure status, recent deployments, configuration changes, and resource utilization—all correlated and contextualized.
Application Level Details
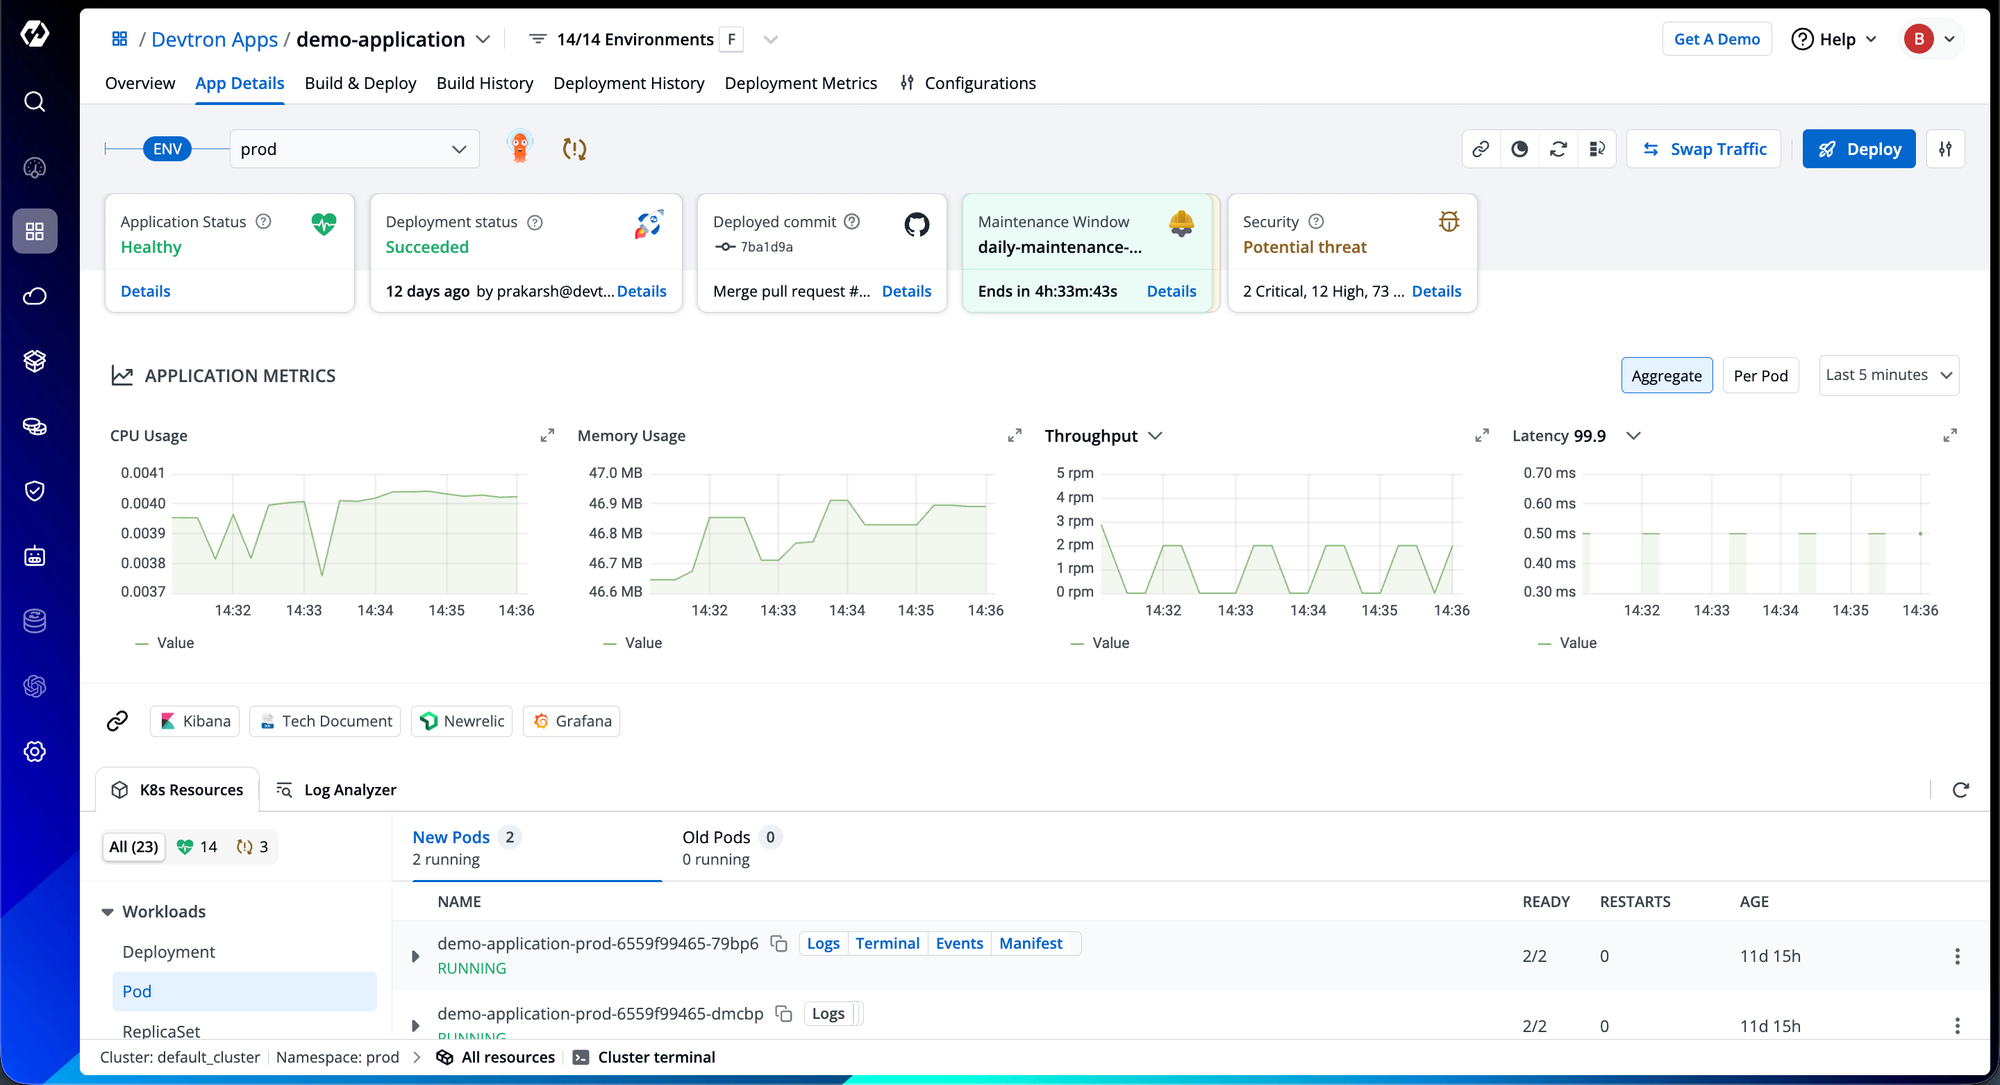
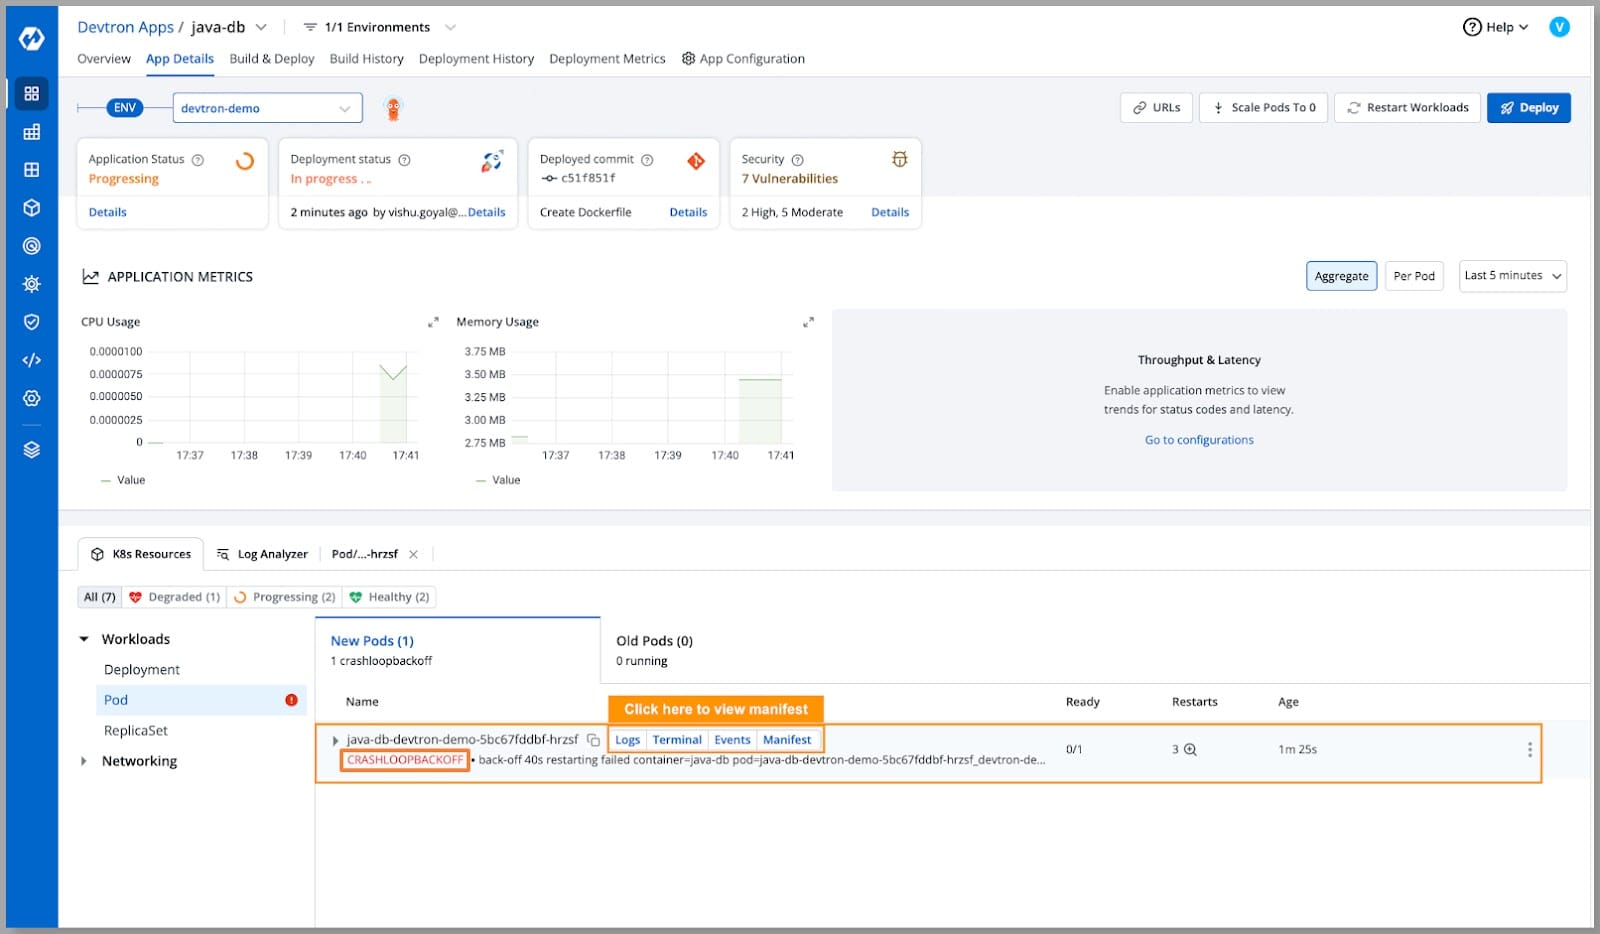
The Devtron offers a comprehensive, unified view of your applications. Bringing together everything you need to understand, monitor, and troubleshoot efficiently. At a glance, you can see critical information such as “Application Status”, “Deployment Status”, and “Security Overview”.
Beyond status visibility, Devtron provides real-time application metrics like “CPU Usage” and “Memory Usage”, “Throughput”, and “Latency”. These insights help engineers quickly assess performance and identify potential bottlenecks.
When debugging complex issues, especially during late-night incidents, engineers often need context about the underlying Kubernetes resources. Devtron seamlessly maps Kubernetes resources to relevant applications, presenting them in a single, unified interface. This deep helps teams trace, debug, and resolve issues faster, without context switching between multiple tools or dashboards.
Build and deployment history: Change correlation made explicit
A significant portion of production issues traces back to recent changes. Traditional approaches require manually correlating deployment timing with incident timing, then investigating what changed in that deployment.
Devtron maintains a comprehensive build and deployment history directly within the application context:
Failed builds with retained context
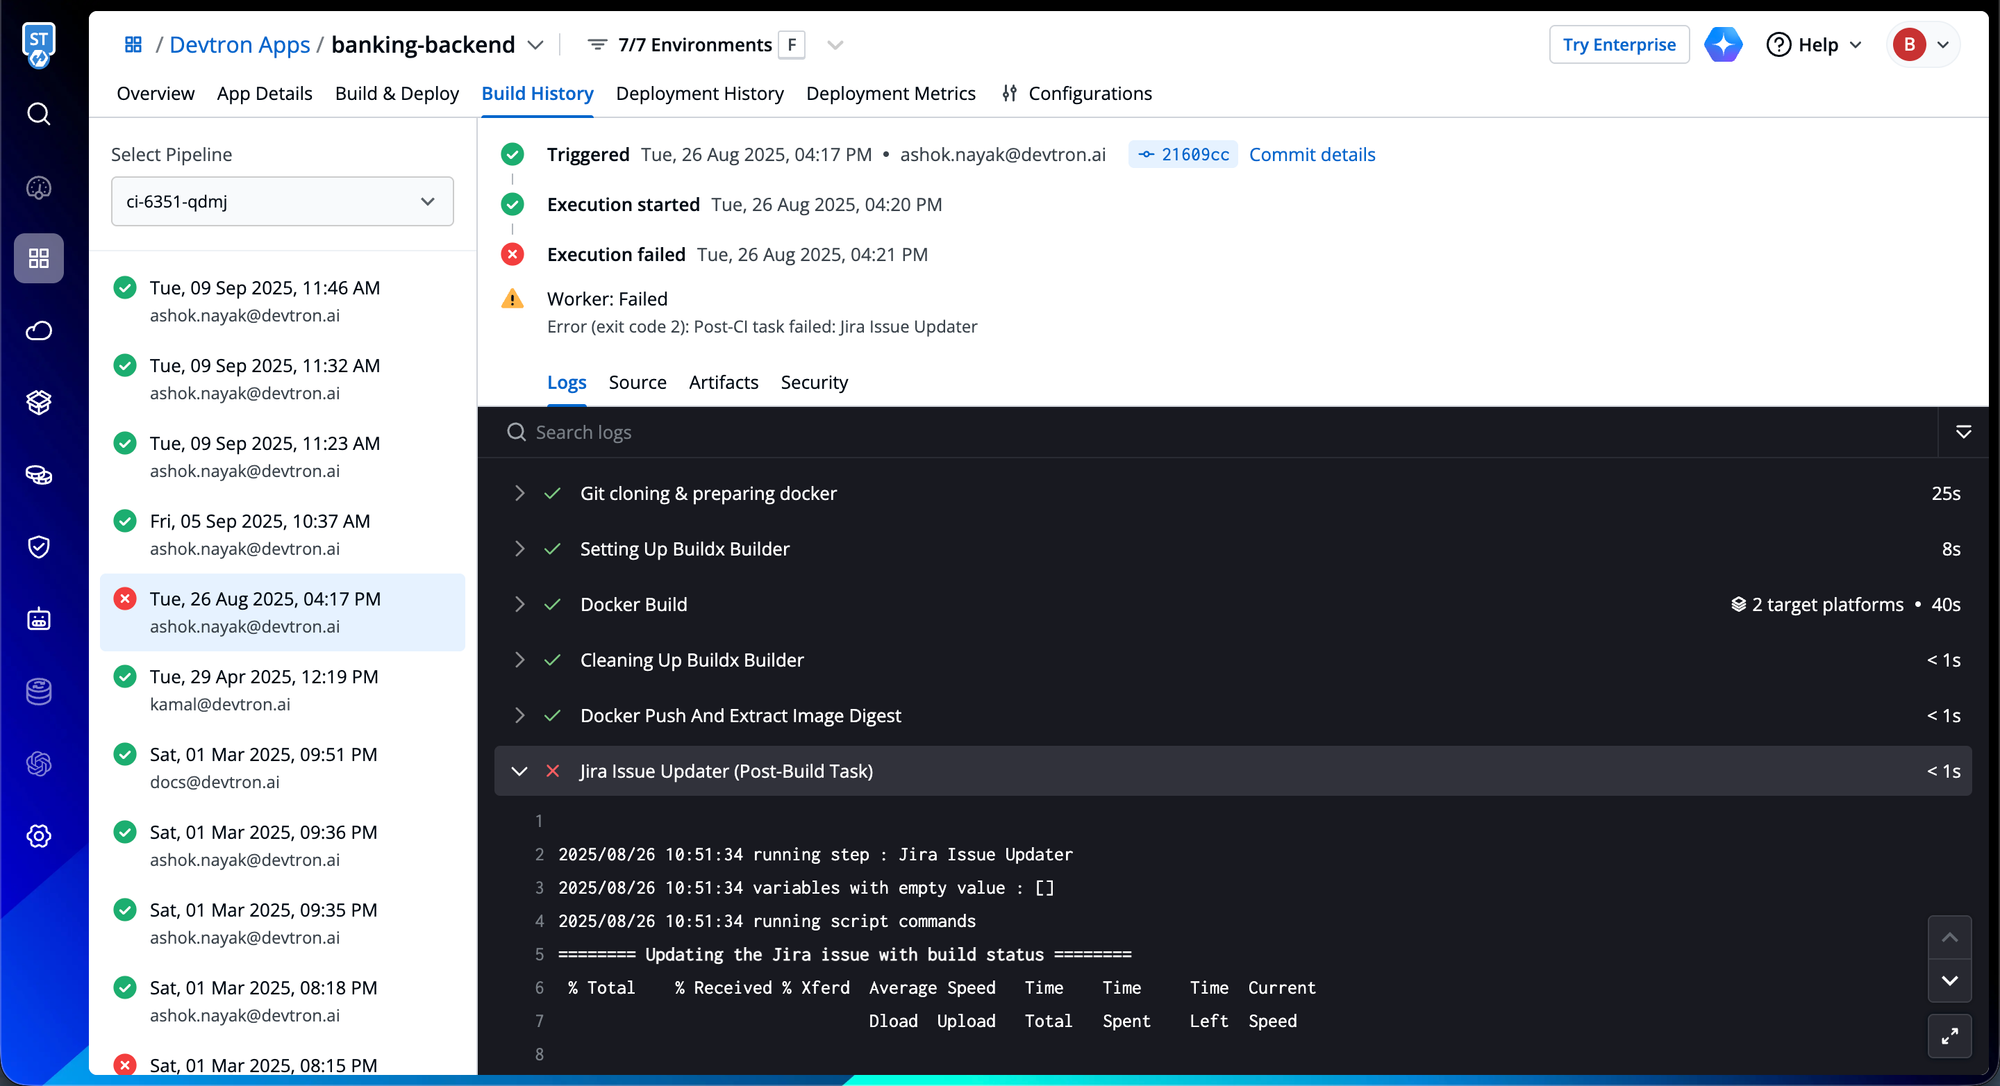
When builds fail or get stuck, engineers shouldn't need to jump between Jenkins, GitHub Actions, or other external CI platforms to piece together what went wrong. Devtron's integrated CI system captures and preserves the complete failure context in one place.
Unlike traditional CI solutions that log build outcomes in isolation, Devtron retains the full operational story: the specific commit that triggered the build, complete execution logs, source repository details, security scan results, and the exact error that caused the failure. This comprehensive context remains immediately accessible during incident investigation, no context switching required, no manual correlation across systems.
The result: engineers move directly from detecting a build failure to understanding its root cause, eliminating the time typically spent reconstructing what happened across fragmented tools.
Deployment timeline with state transitions
When deployments fail and production goes down, the pressure to diagnose and resolve issues quickly intensifies. In these critical moments, engineers often find themselves checking the Argo CD dashboard, reviewing Flux CD reconciliation status, or running terminal commands for Helm deployments, just to piece together what went wrong.
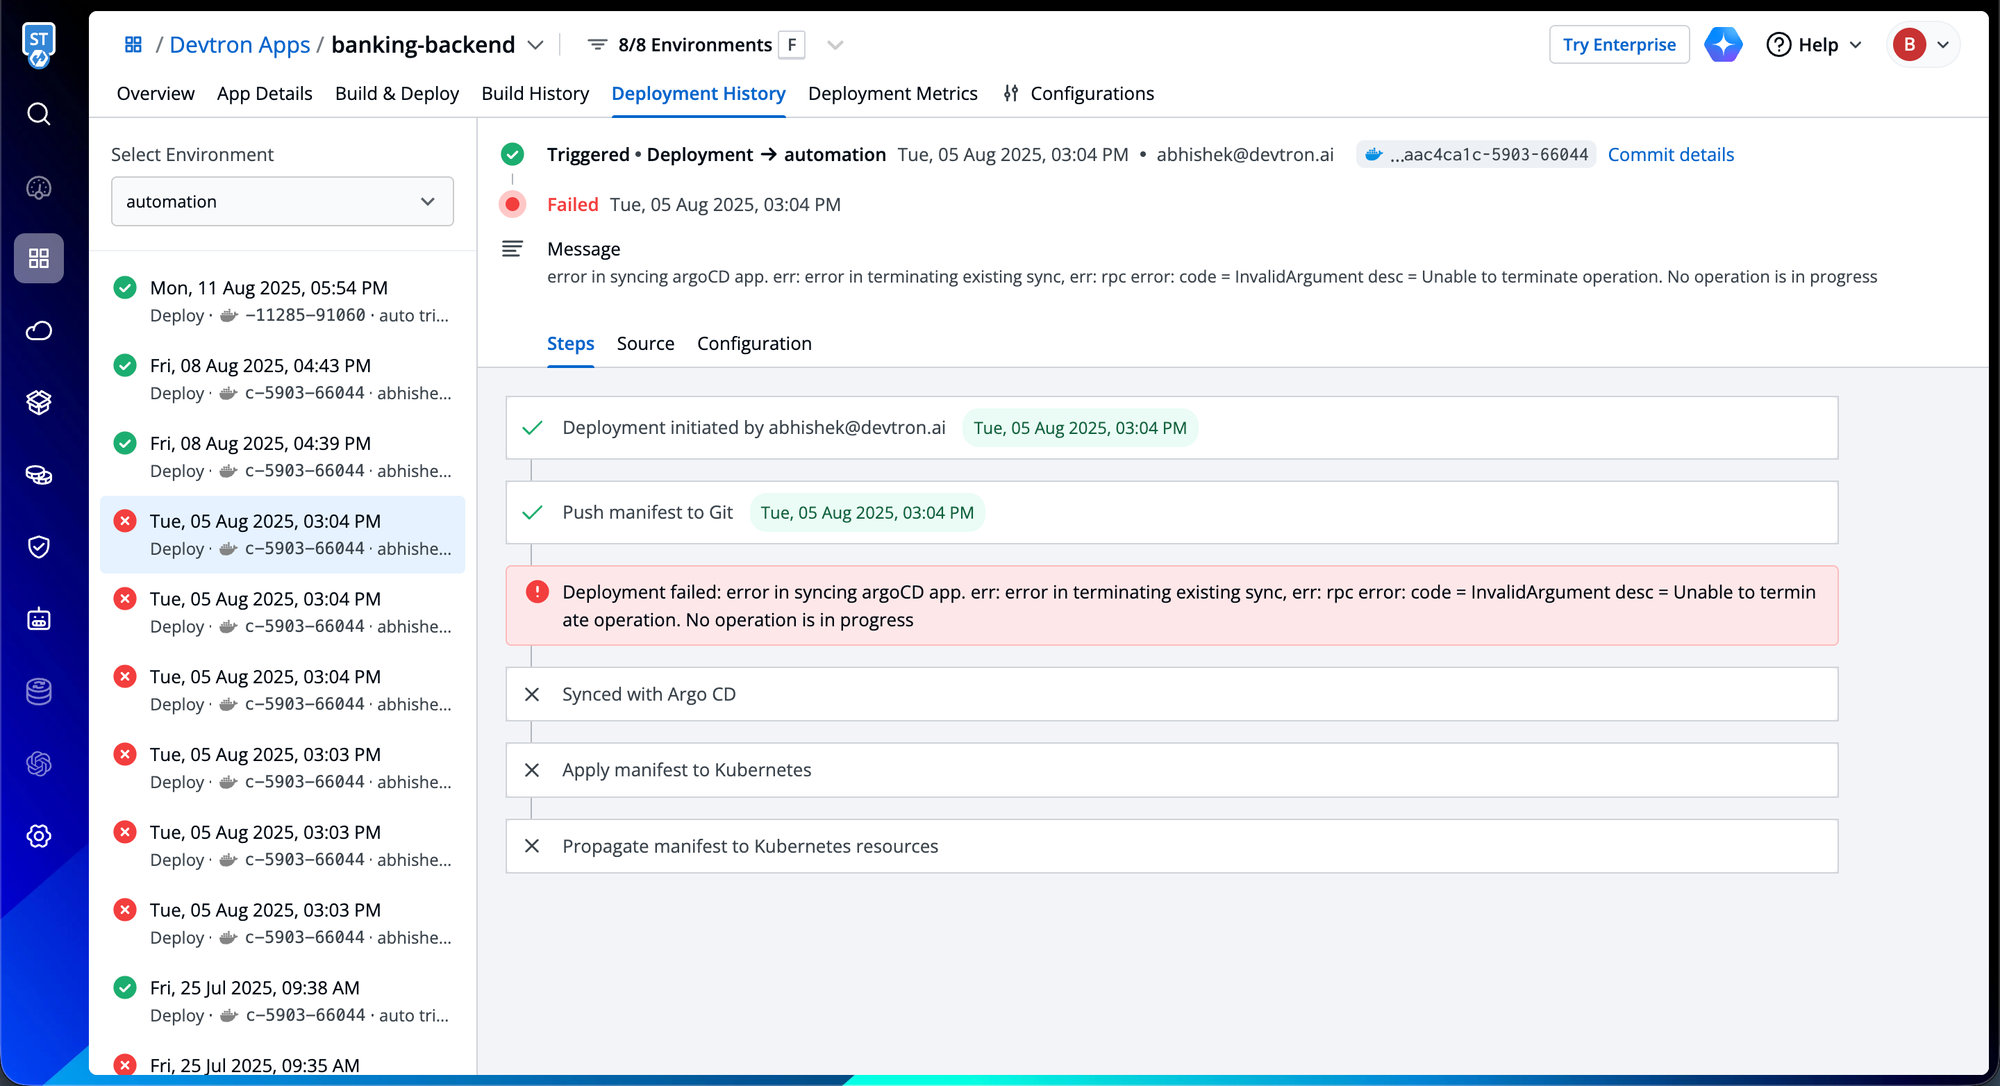
Devtron orchestrates GitOps deployments across Argo CD, Flux CD, and Helm while consolidating their operational data into a unified deployment timeline. This integrated view captures the complete deployment narrative: failed attempts, rollback events, and configuration changes.
Each timeline entry preserves critical state transition details, showing exactly what changed between versions, at which step the deployment failed, what configurations were applied, which container image was deployed, and the specific commit that triggered it. This comprehensive context remains immediately accessible, eliminating the need to reconstruct deployment history across fragmented tools.
The result: when production breaks, engineers can immediately trace the deployment failure to its source, understanding both what changed and why it failed—without switching between multiple GitOps dashboards or piecing together terminal outputs.
Infrastructure Level Details
Troubleshooting Kubernetes environments often forces engineers to rely heavily on command-line tools like kubectl. While powerful, these tools introduce significant challenges when managing resources across multiple clusters. Diagnosing a single failing pod can demand dozens of commands, checking statuses, inspecting logs, reviewing events, and cross-referencing manifests across namespaces, making the process slow, manual, and error-prone.
Devtron’s Kubernetes Resource Browser
Devtron, with its Resource Browser, eliminates the friction by offering a unified, visual interface for cluster visibility and management. Instead of juggling multiple terminals or dashboards, engineers gain a holistic view of all Kubernetes resources in real time, streamlining troubleshooting and operational control.
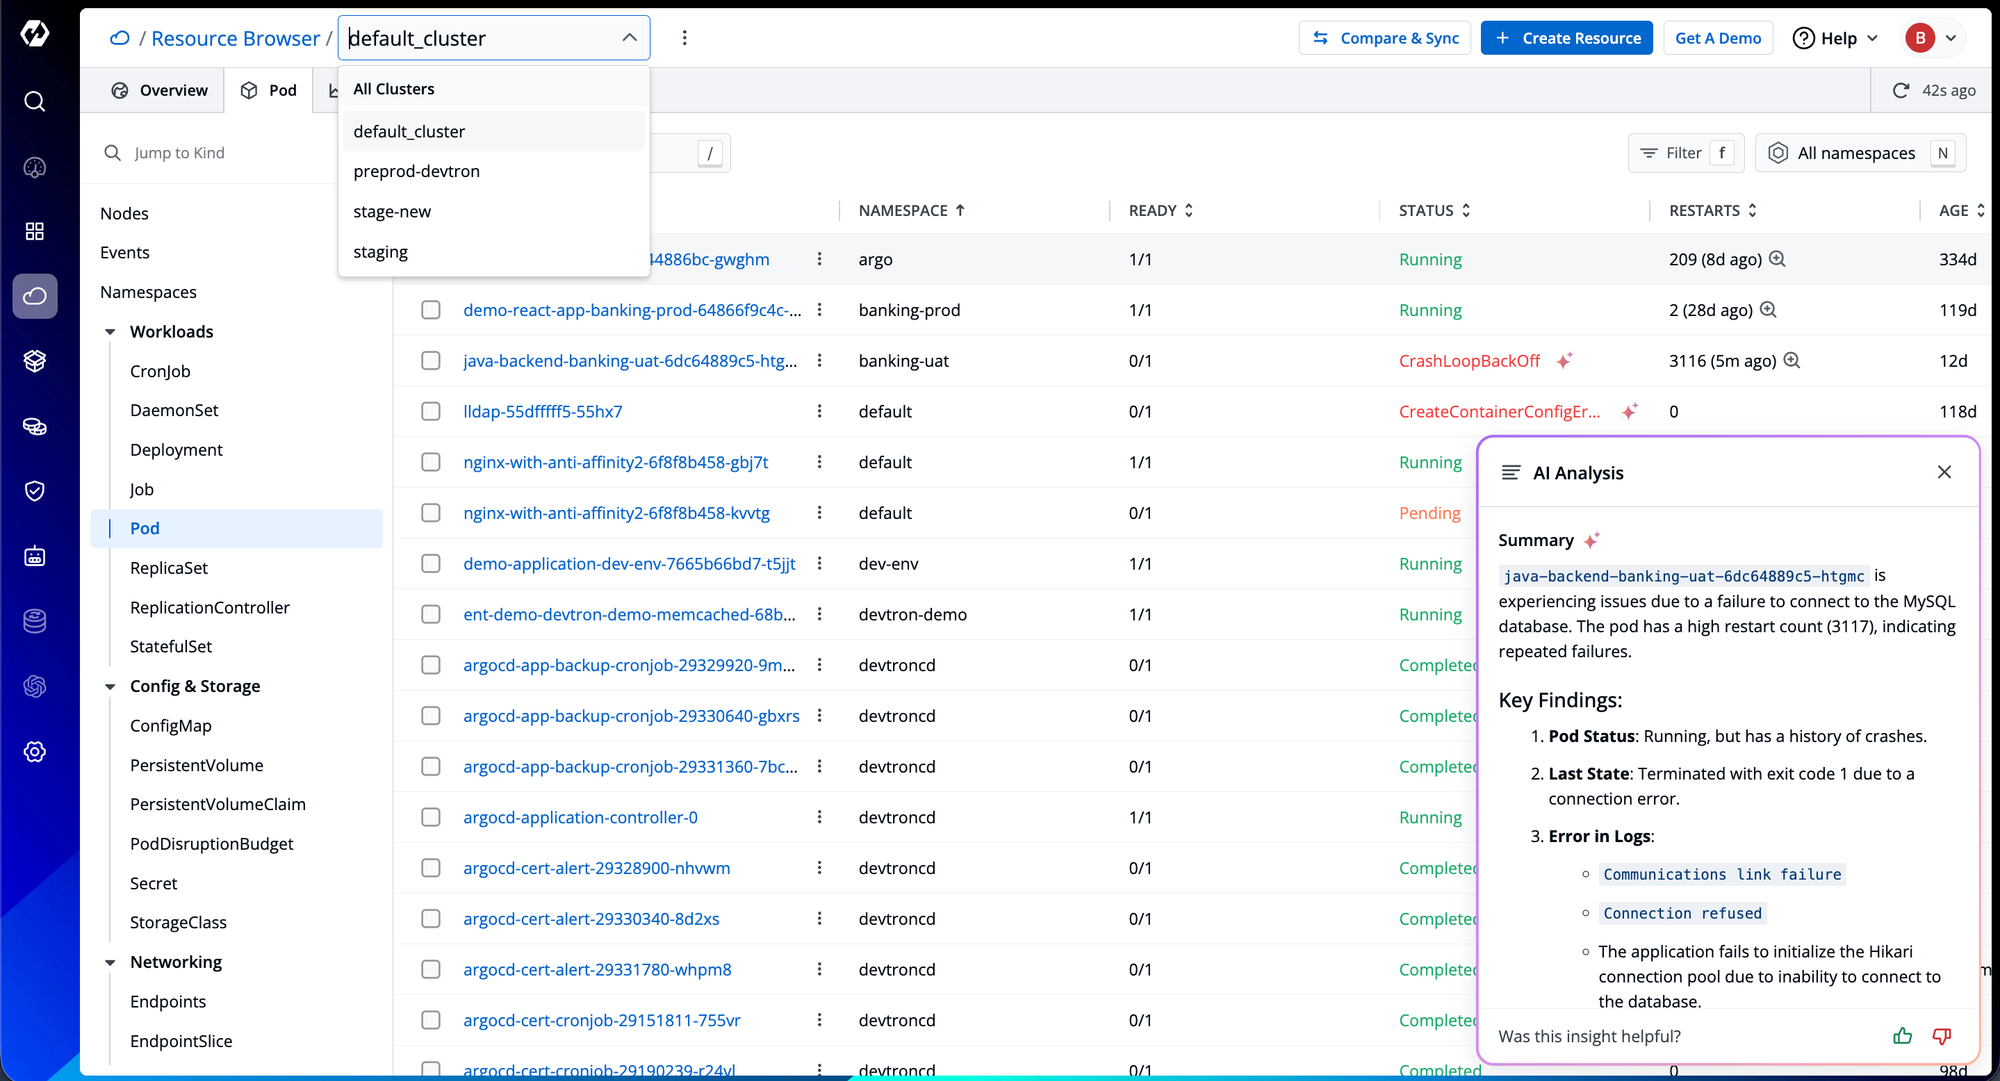
The Resource Browser provides real-time visibility into all Kubernetes objects, pods, deployments, services, config maps, and even custom resources, grouped logically by type and namespace. Advanced filtering and search capabilities allow engineers to pinpoint workloads across clusters quickly. This simplifies the cluster management and debugging from a fragmented, command-line exploration into a seamless, visual navigation experience.
Key Troubleshooting Capabilities include:
- Live manifest inspection and editing for on-the-fly configuration changes
- Real-time event streaming to monitor cluster state and scheduling behavior
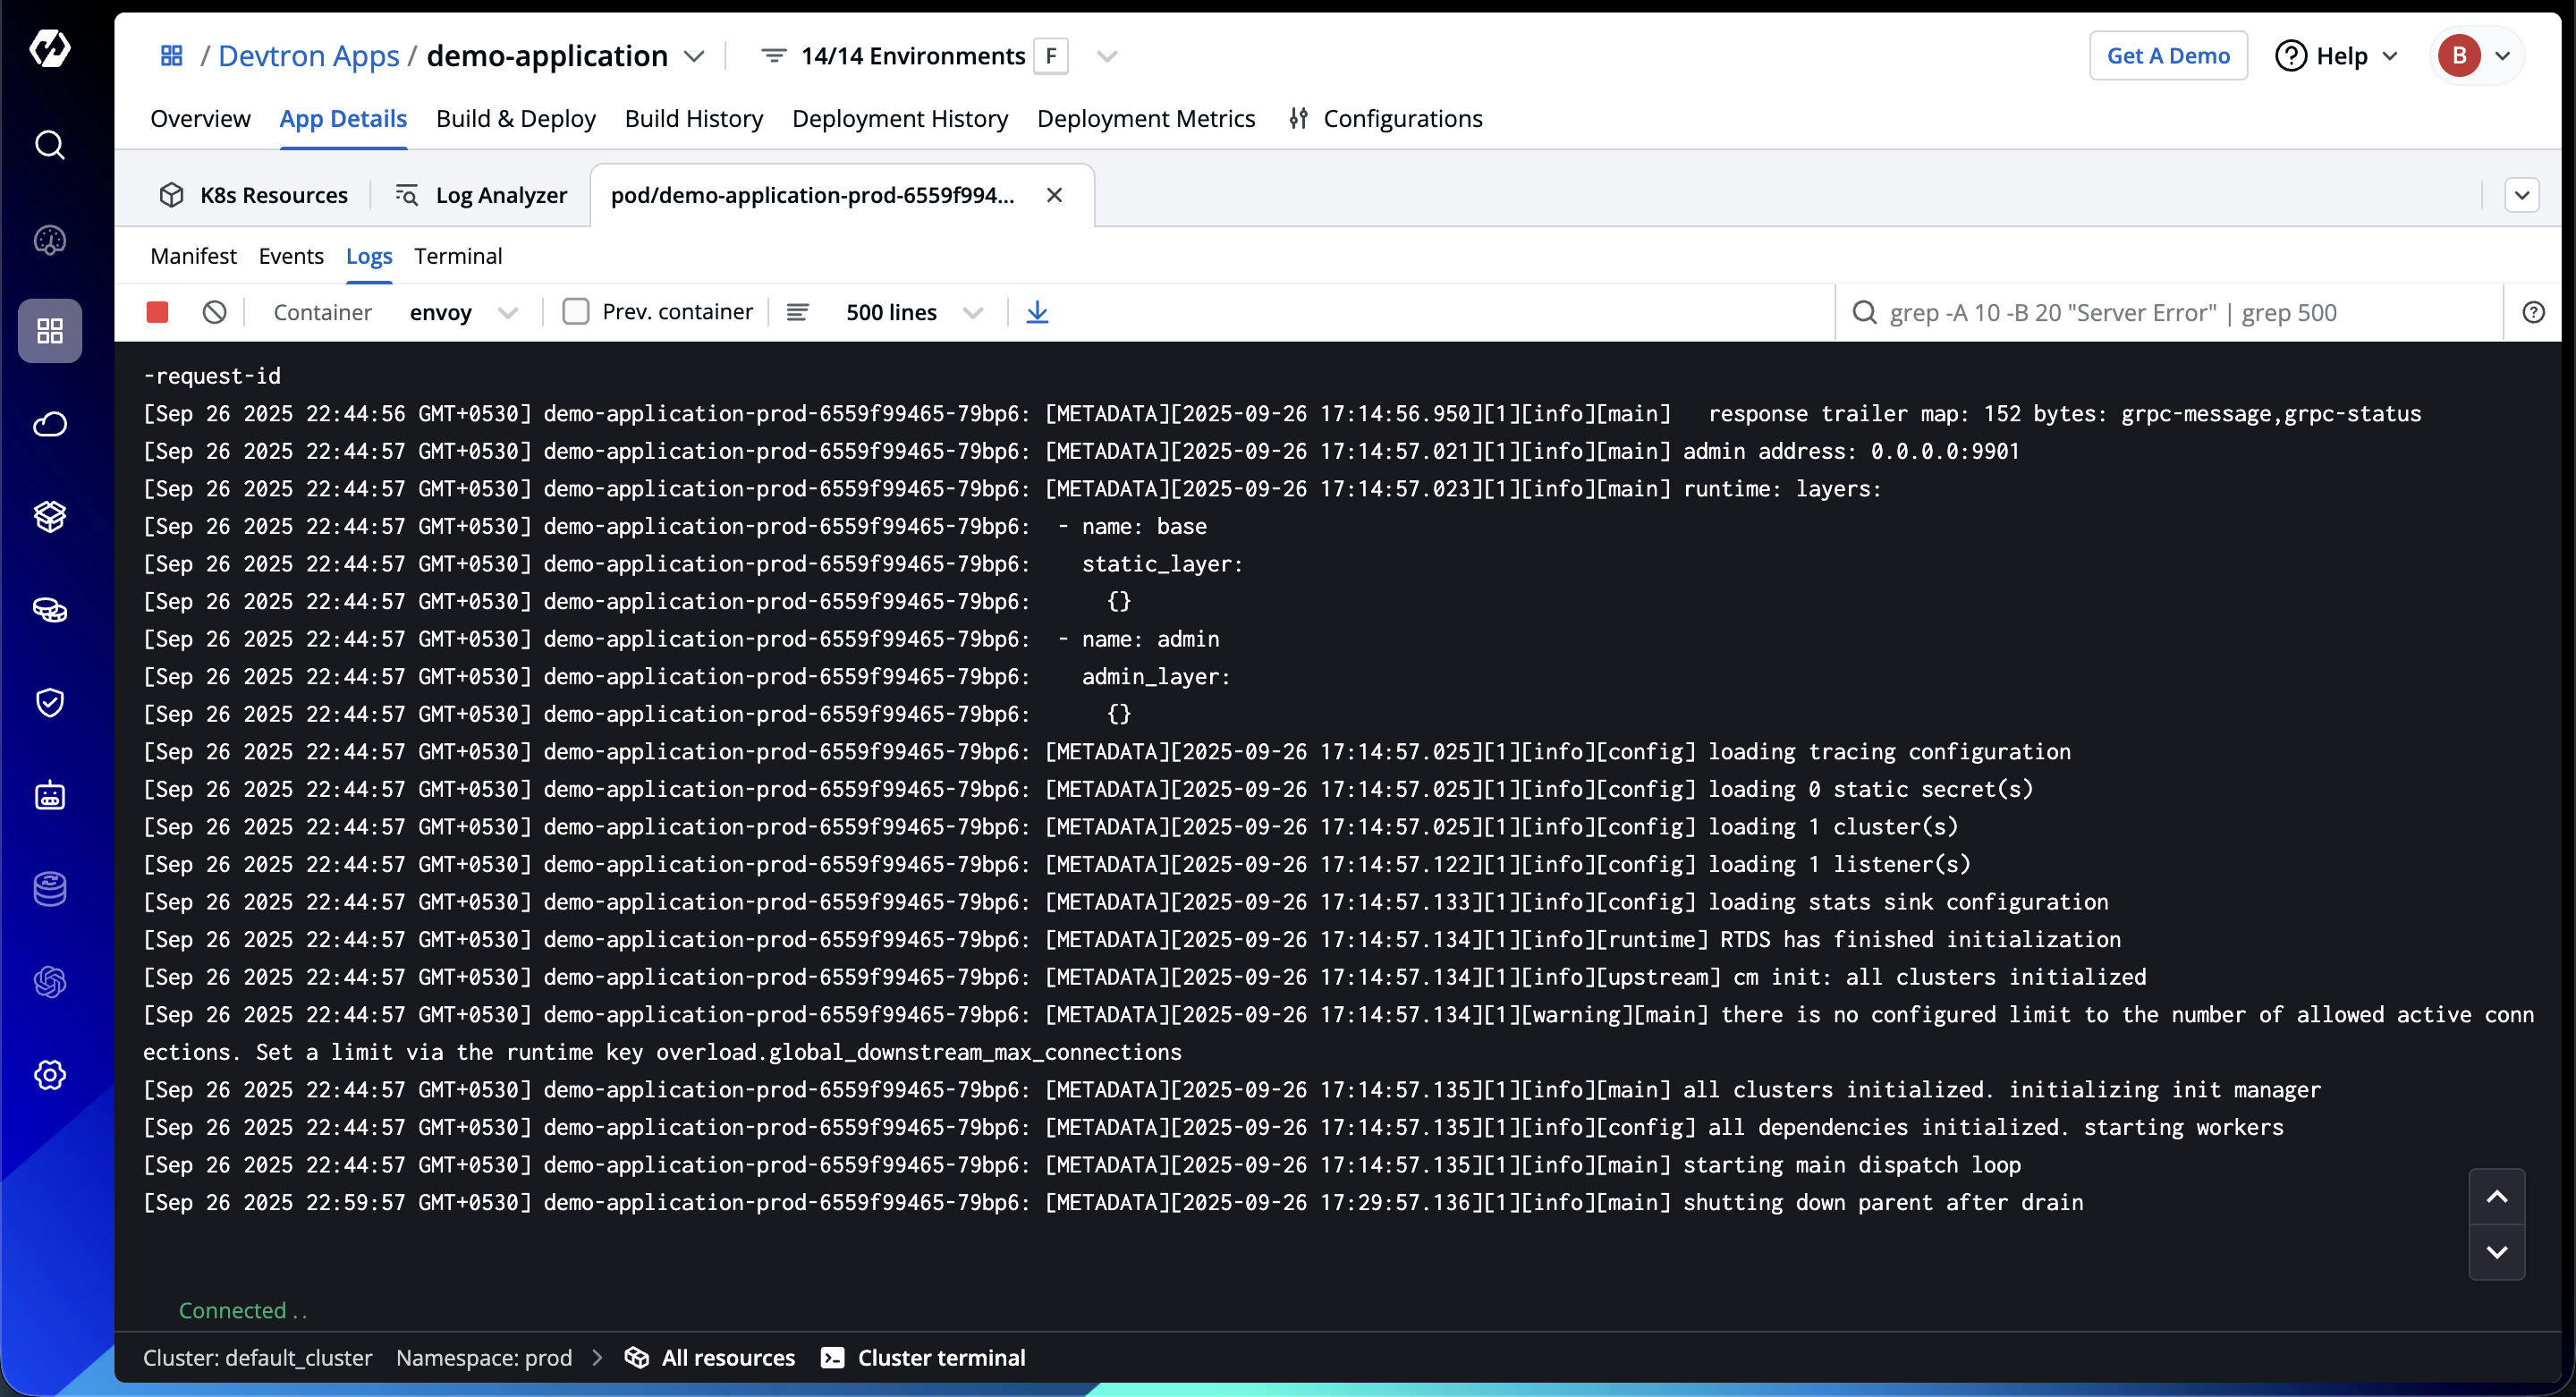
- Log streaming with filtering and search for focused investigation
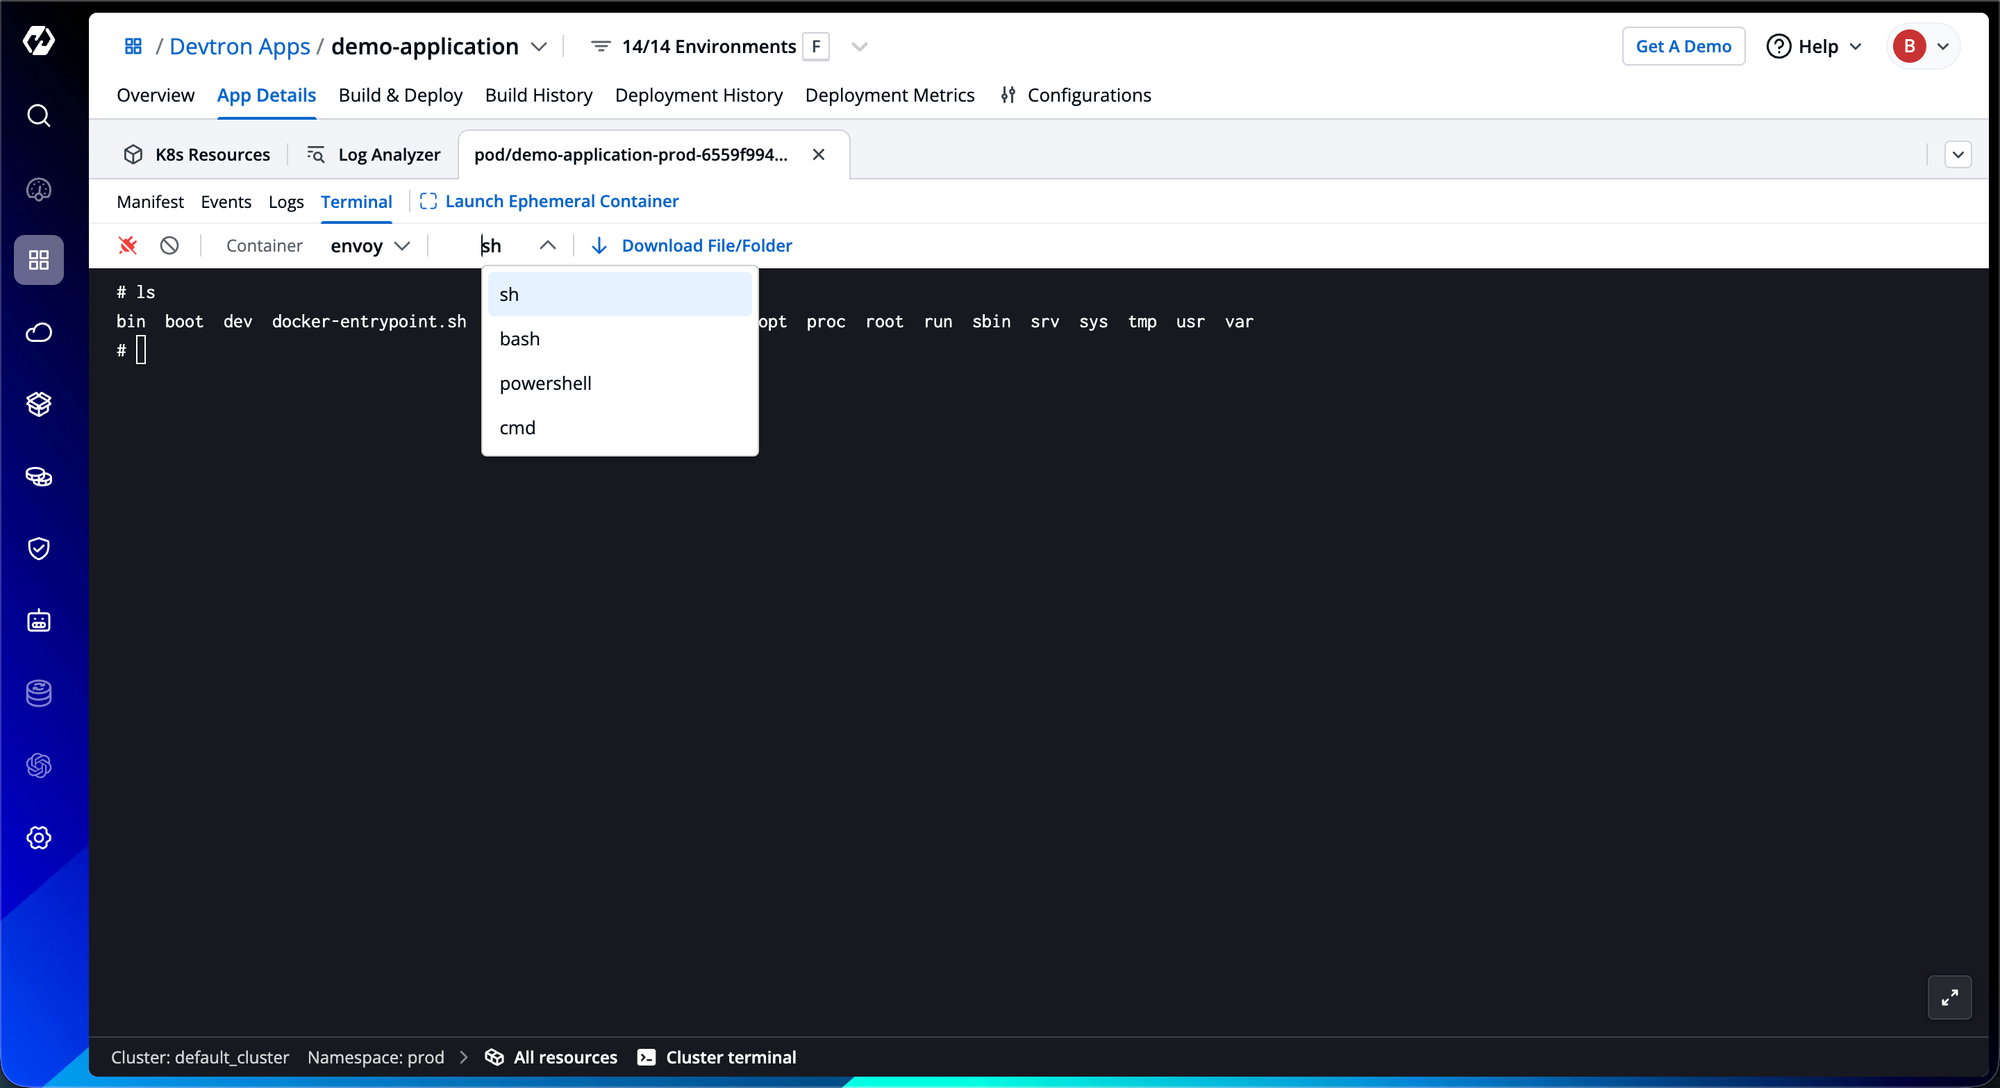
- In-browser terminal access for direct pod-level debugging
- Resource scaling and configuration management for quick remediation
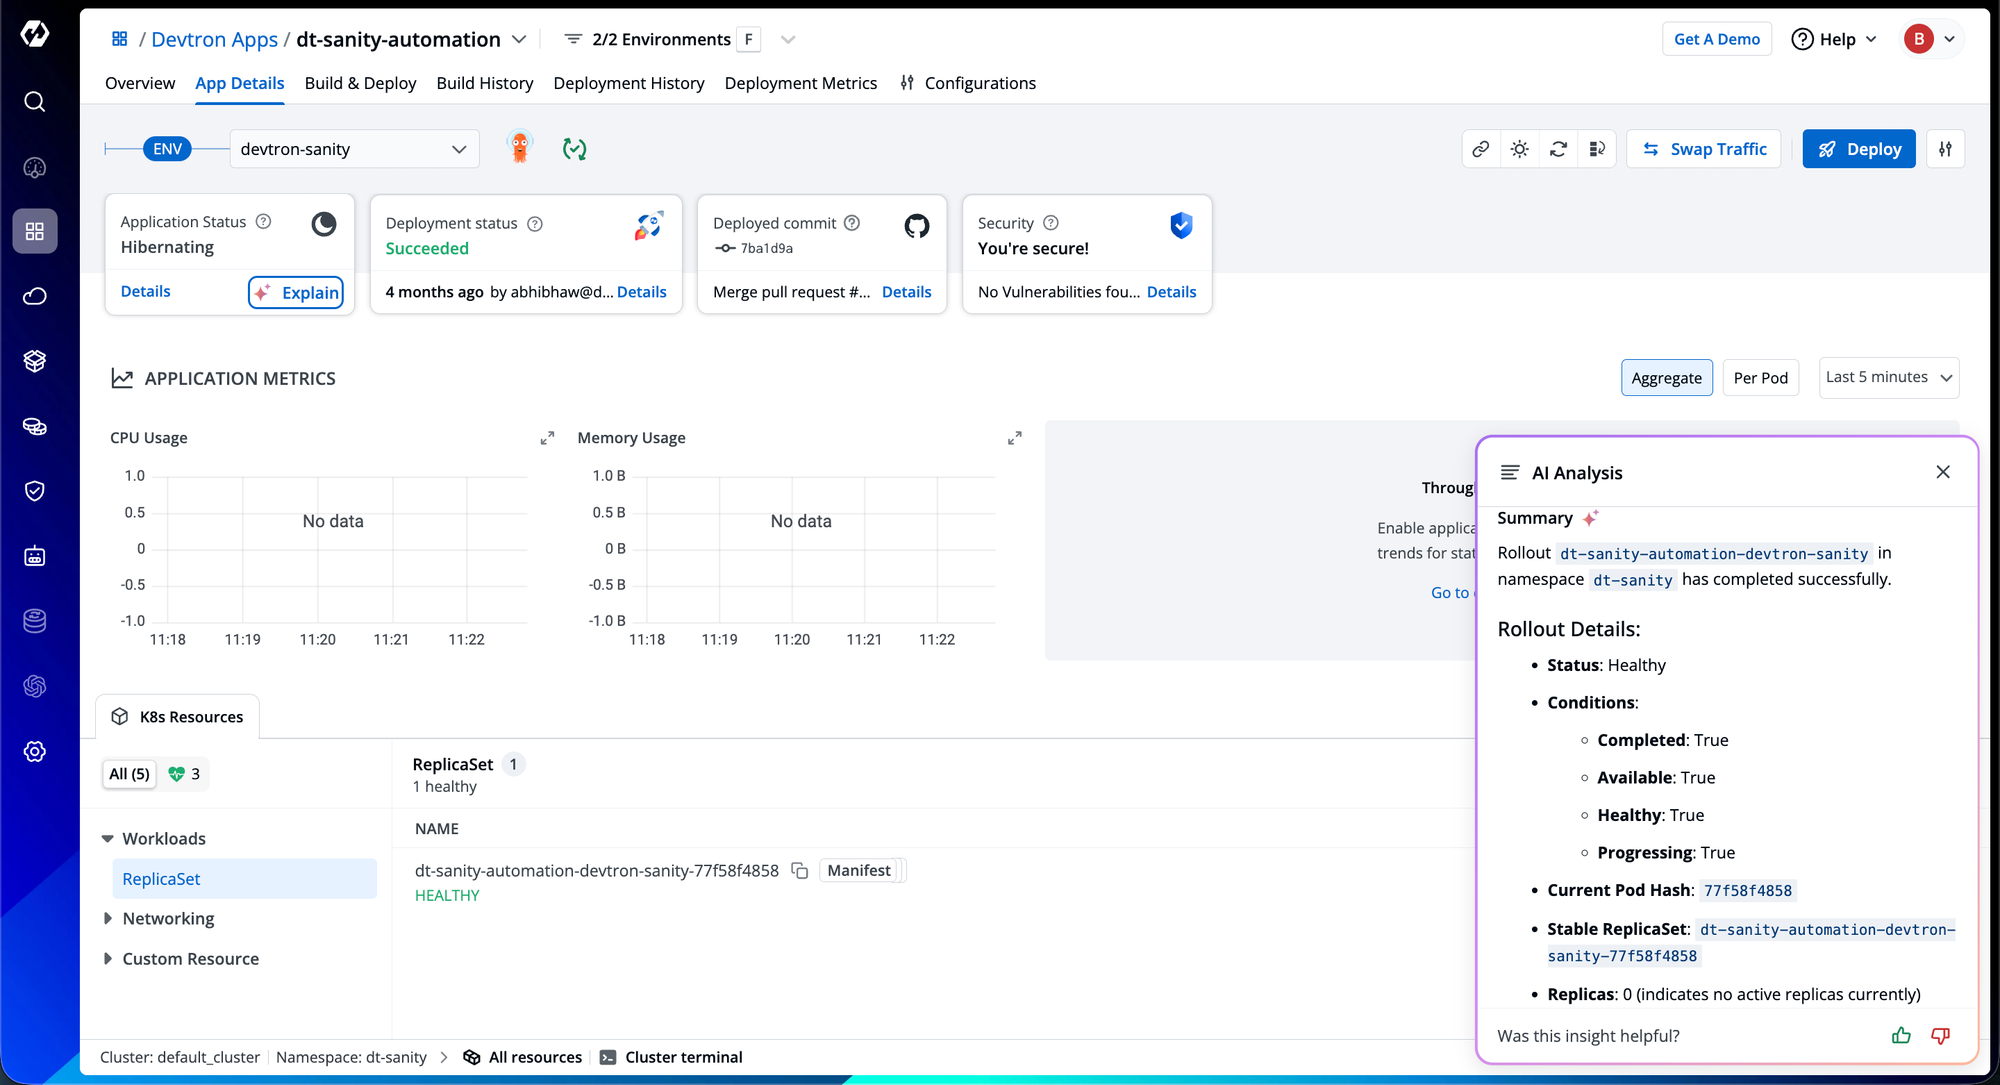
- The AI Analysis of Devtron provides a detailed summary of the errors with the steps to fix.
Consider a common issue: a pod stuck in the Pending state. Normally, this requires multiple kubectl commands to inspect events, check node capacity, and review tolerations. With Devtron, selecting the pod instantly reveals its events and insights in context, allowing engineers to identify and resolve constraint violations within seconds.
Unified Operations
At 2 AM, when production systems are failing. No engineer should be navigating fifteen different dashboards while simultaneously running kubectl commands across terminal windows to determine which node, pod, or container is experiencing issues.
Devtron consolidates Kubernetes operations into a unified interface that addresses the fragmented operations.
- Resource-aware navigation: Because Kubernetes resources are explicitly tied to their parent applications, navigation to the failing component is direct. A degraded service immediately reveals its underlying pods, and those pods reveal their constituent containers, all within the hierarchical application model rather than requiring namespace and label queries.
- Contextual action availability: Operations are available at each level of the resource hierarchy. At the cluster level, engineers can inspect node health and resource allocation. At the pod level, they can examine container status and resource consumption. At the container level, they can access logs and terminal sessions.
- Unified insight flow: Unlike conventional tools that require switching contexts between logs and events, Devtron’s integrated log analyzer and event visualizer present correlated timelines in a single view. You can trace event triggers alongside corresponding log entries, uncovering cause-and-effect relationships without leaving the investigation flow.
Devtron AI Recommendations
Devtron's AI recommendation addresses a fundamental challenge in incident response: translating observed symptoms into actionable remediation steps. When resources fail, engineers need to answer four critical questions: why is this failing, what specifically went wrong, how should it be fixed, and what preventive measures should be followed.
Devtron’s AI recommendations provide contextual reasoning support that accelerates root cause identification and remediation decision-making. This AI-augmented approach proves particularly valuable when troubleshooting unfamiliar services or during high-pressure scenarios where cognitive load impacts diagnostic efficiency.
What This Actually Costs
When platform engineers spend 60% of their time on incident response rather than system improvement, you're paying senior engineers to function as human data integration layers.
We built Devtron to change how platform engineers approach incidents. Every piece of the puzzle, applications, infrastructure, deployments, dependencies, in one connected view. No jumping between dashboards or reconstructing timelines.
Engineers can instantly see what broke, why it happened, and how to fix it. Unified visibility, AI-driven insights, seamless context across all layers.
The result: shorter incident resolution times, reduced fatigue, and teams that focus on building reliable systems instead of constantly firefighting.