Configuring and managing Kubernetes requires a lot of effort and domain expertise. From writing Kubernetes manifests to deploying and upgrading them manually every time a new change comes in, it makes your workflow more and more complex. Sooner or later, most teams end up with tools to simplify their application deployment. Helm happens to be the most adopted package manager for deploying applications on Kubernetes. Though widely adopted because it reduces the complexities of deploying applications on Kubernetes, Helm CLI has posed several challenges.
Challenges with Helm
While Helm is great at packaging Kubernetes applications, it still needs to catch up when it comes to debugging and troubleshooting applications using Helm CLI. The community currently faces some burning challenges:
- No active/real-time monitoring of Kubernetes resources with time series data - using Helm CLI just presents the current state of applications which is rarely enough for troubleshooting
- Improper grouping of resources
- Accessing the chart’s readme documentation is not seamless
- Missing unified interface for managing Helm Apps across multi-clusters
- No easy way to compare deployment values across deployments
Peripheral Challenges
Apart from the native helm challenges, there are some other issues as well which can be solved using Helm Dashboard and can help you to manage the entire team and optimize the infra costs. The other challenges are:
- No out-of-the-box support for hibernation of workloads
- Complex access management for team members
- Lack of security scanning when deploying charts
Devtron is aware of the community's difficulty with existing Helm CLI features. Considering these common problems that the community faces today with Helm CLI, we built an intuitive Helm dashboard for managing the lifecycle of Helm apps, abstracting out all the complexities and challenges. Let's take a look into the challenges and how the Devtron dashboard helps to solve those challenges.
Helm Dashboard in Devtron
Before we look out for the solution, let me grab a minute of yours. Devtron is an open-source cloud-native tool integration platform for Kubernetes. It provides an intuitive dashboard for all your Kubernetes and Helm-related challenges and enables teams to easily collaborate and work on faster delivery of applications on the top of Kubernetes.
How Devtron helps to solve all your challenges
Active Monitoring
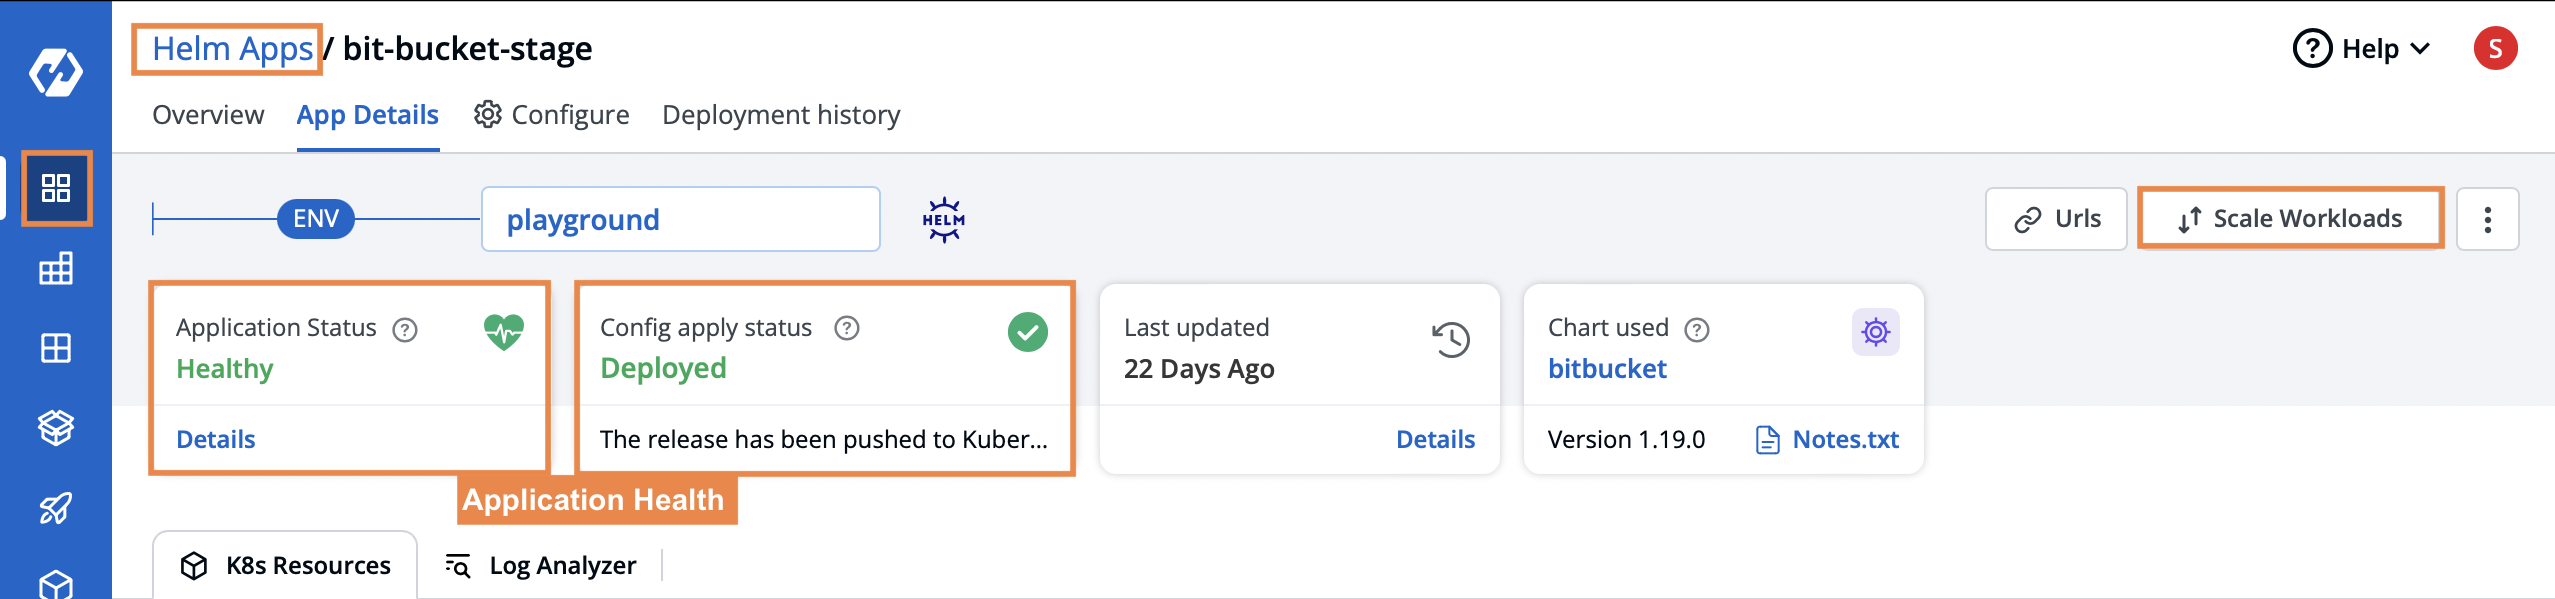
If you are using helm CLI, there’s no real-time monitoring of your workloads. Once you deploy/install a chart using helm install repo/chart, helm status will always show you as deployed even if some of the k8s resources are missing or not deployed successfully. With Devtron’s Helm Dashboard, it becomes effortless to actively monitor all the Kubernetes Resources deployed using the Helm charts. It shows the real-time status of applications deployed through the dashboard or a terminal.
Let’s assume, you deployed a helm chart and there is some configs error in it. Unlike helm CLI, Devtron will show the status as Degraded since the chart configs were not correct. If everything was good and deployed successfully, the status will be shown as Healthy. Again if the chart is deployed, and someone deletes any k8s workload associated with it, Devtron will immediately change the status to missing.
Resource Grouping
In the official kube-prometheus-stack chart, about 174 Kubernetes resources get deployed when you install the chart. Imagine if there’s an error in any of the config files of the multiple Kubernetes resources. How difficult would it be to debug using helm CLI or just kubectl?
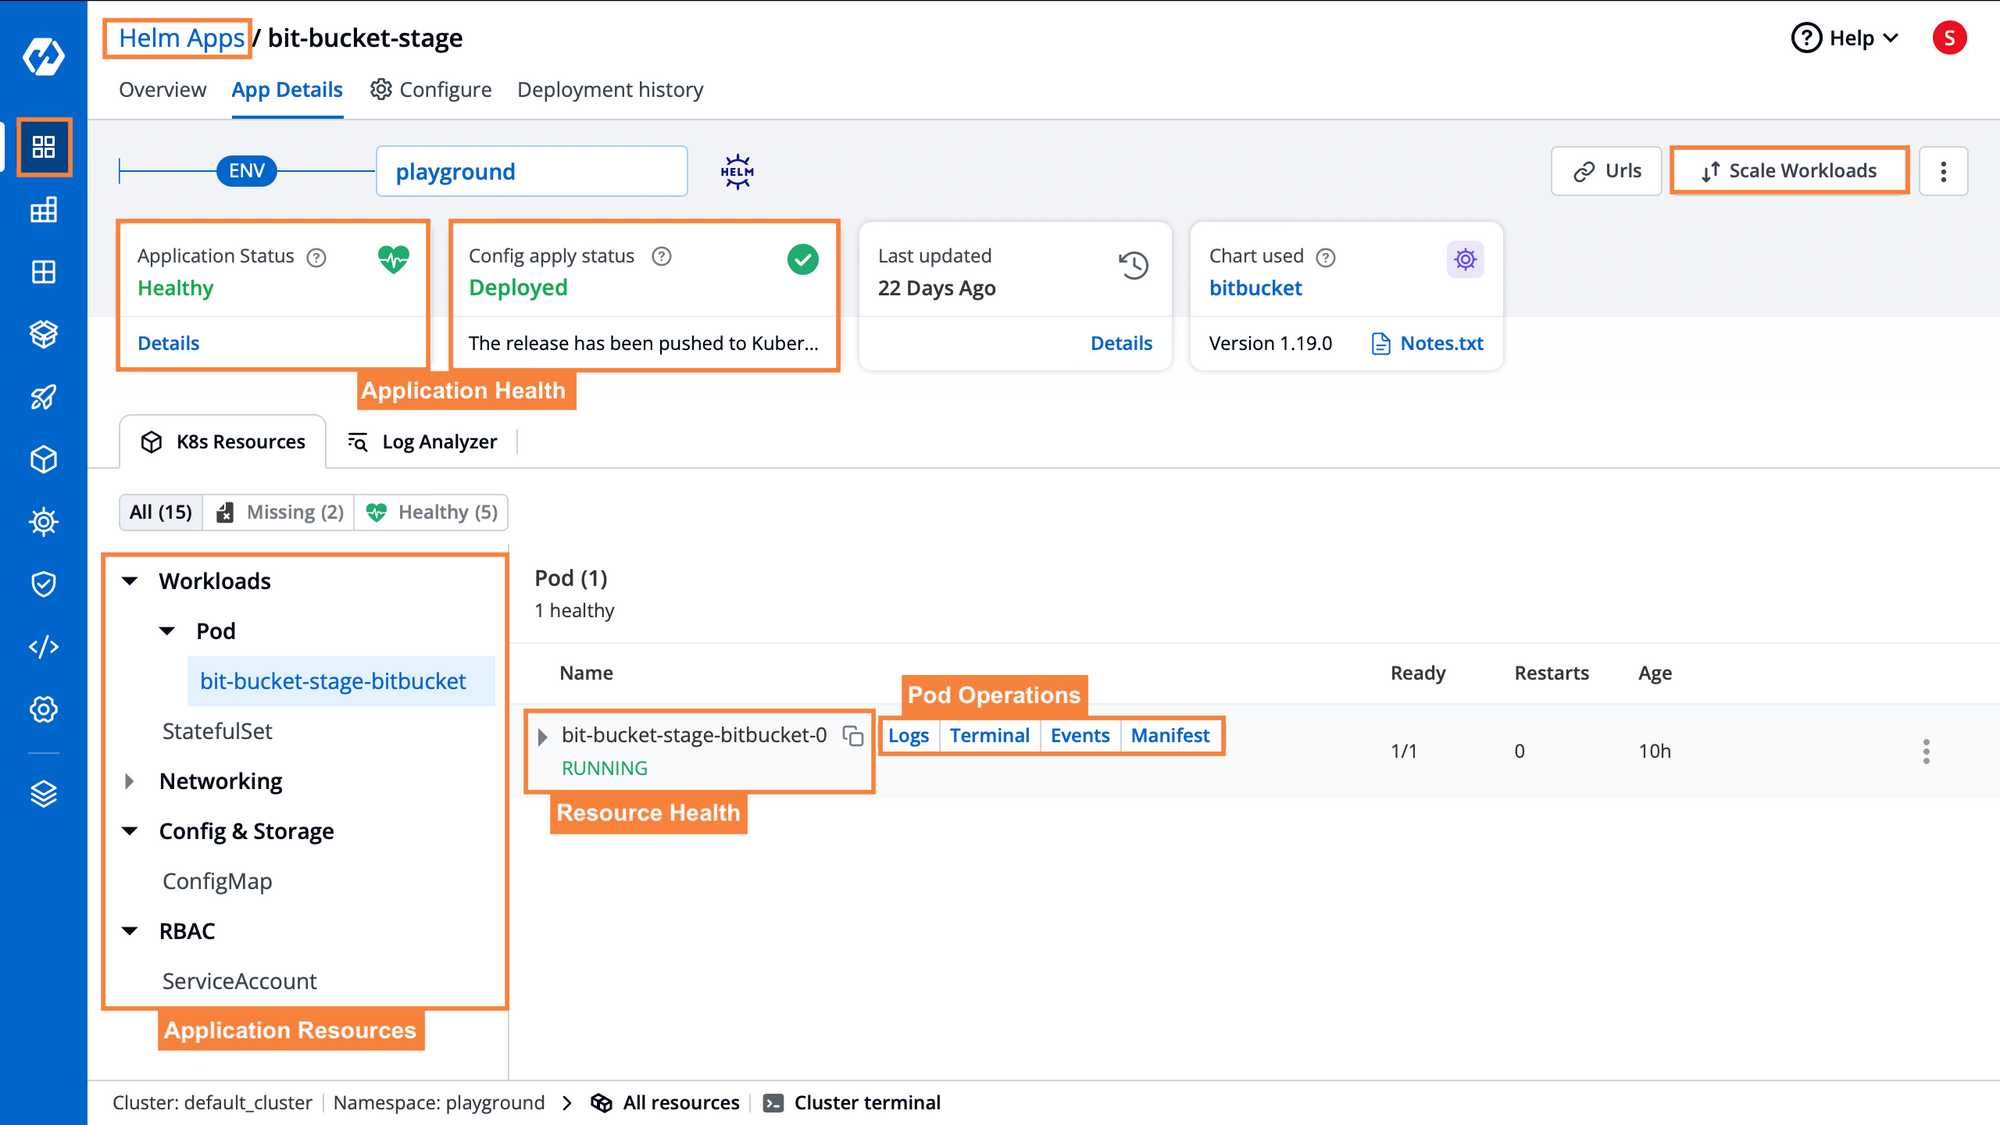
You would have to fire a lot of kubectl/helm commands to figure out which workload is not working. Then check out the logs, describe the pods, etc just to figure out what went wrong and all that from the terminal. But Devtron greatly simplifies that.
Devtron does the grouping of resources of all your applications and categorizes them into different buckets, which makes it easy to find the right resources while debugging. As you can see in the above screenshot, all the networking-related components are categorized under Networking (like Ingress, Service, and Endpoints), ConfigMap, secrets under Config & Storage, etc. Also, if you hover over any workload, you will get an option to check out the k8s manifest and events, check logs in real-time, and even exec into a pod for debugging directly in the Devtron UI.
Here is an additional read on a detailed understanding of debugging and logging capabilities of Devtron for Helm apps.
Referring to Chart’s Documentation in your Workflow
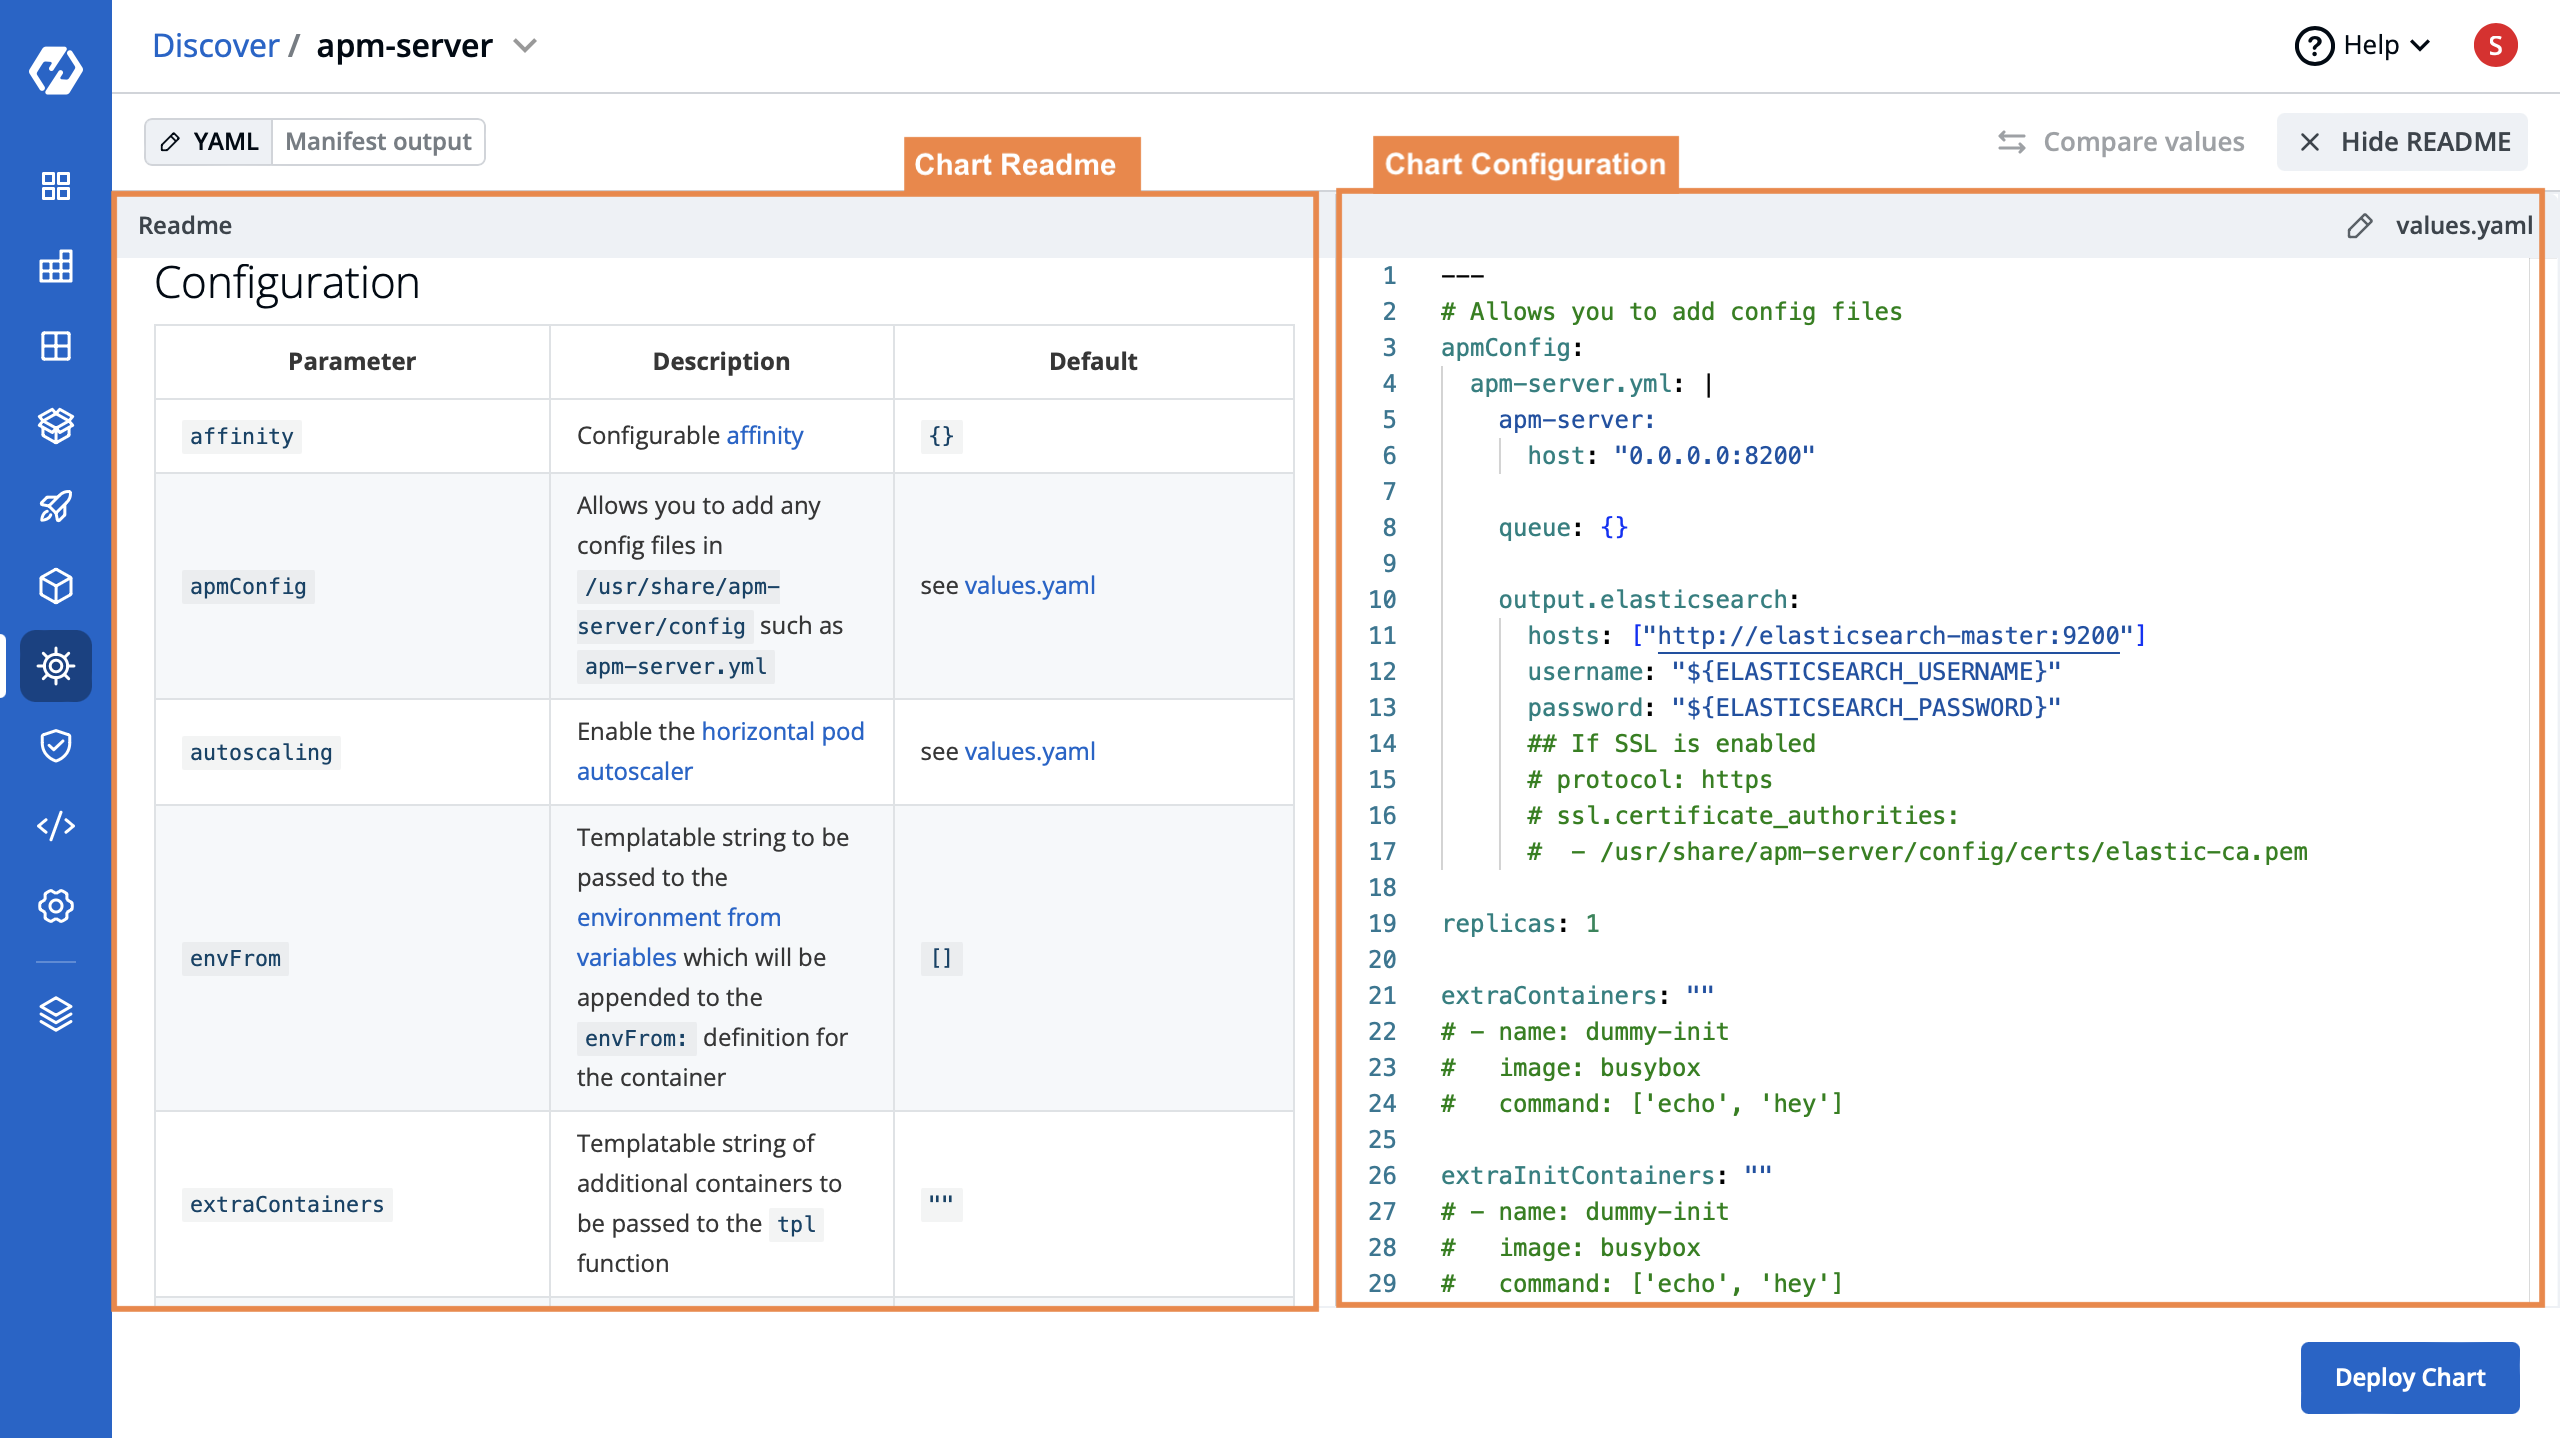
If you want to try out a new Helm chart, you will use its README to check out the different parameters exposed, the values to be passed, and so forth. If using Helm CLI, it becomes a hassle to refer to README, again and again, navigate to different tabs in the browser, making typo errors or mismatched parameters and values in the process, all leading to spending more time to get the job done. With Devtron’s Helm Dashboard, you can see the chart’s README beside the values and check out the parameters, their descriptions, and values to be passed all at the same place.
Managing Helm Apps Across Multi-Clusters
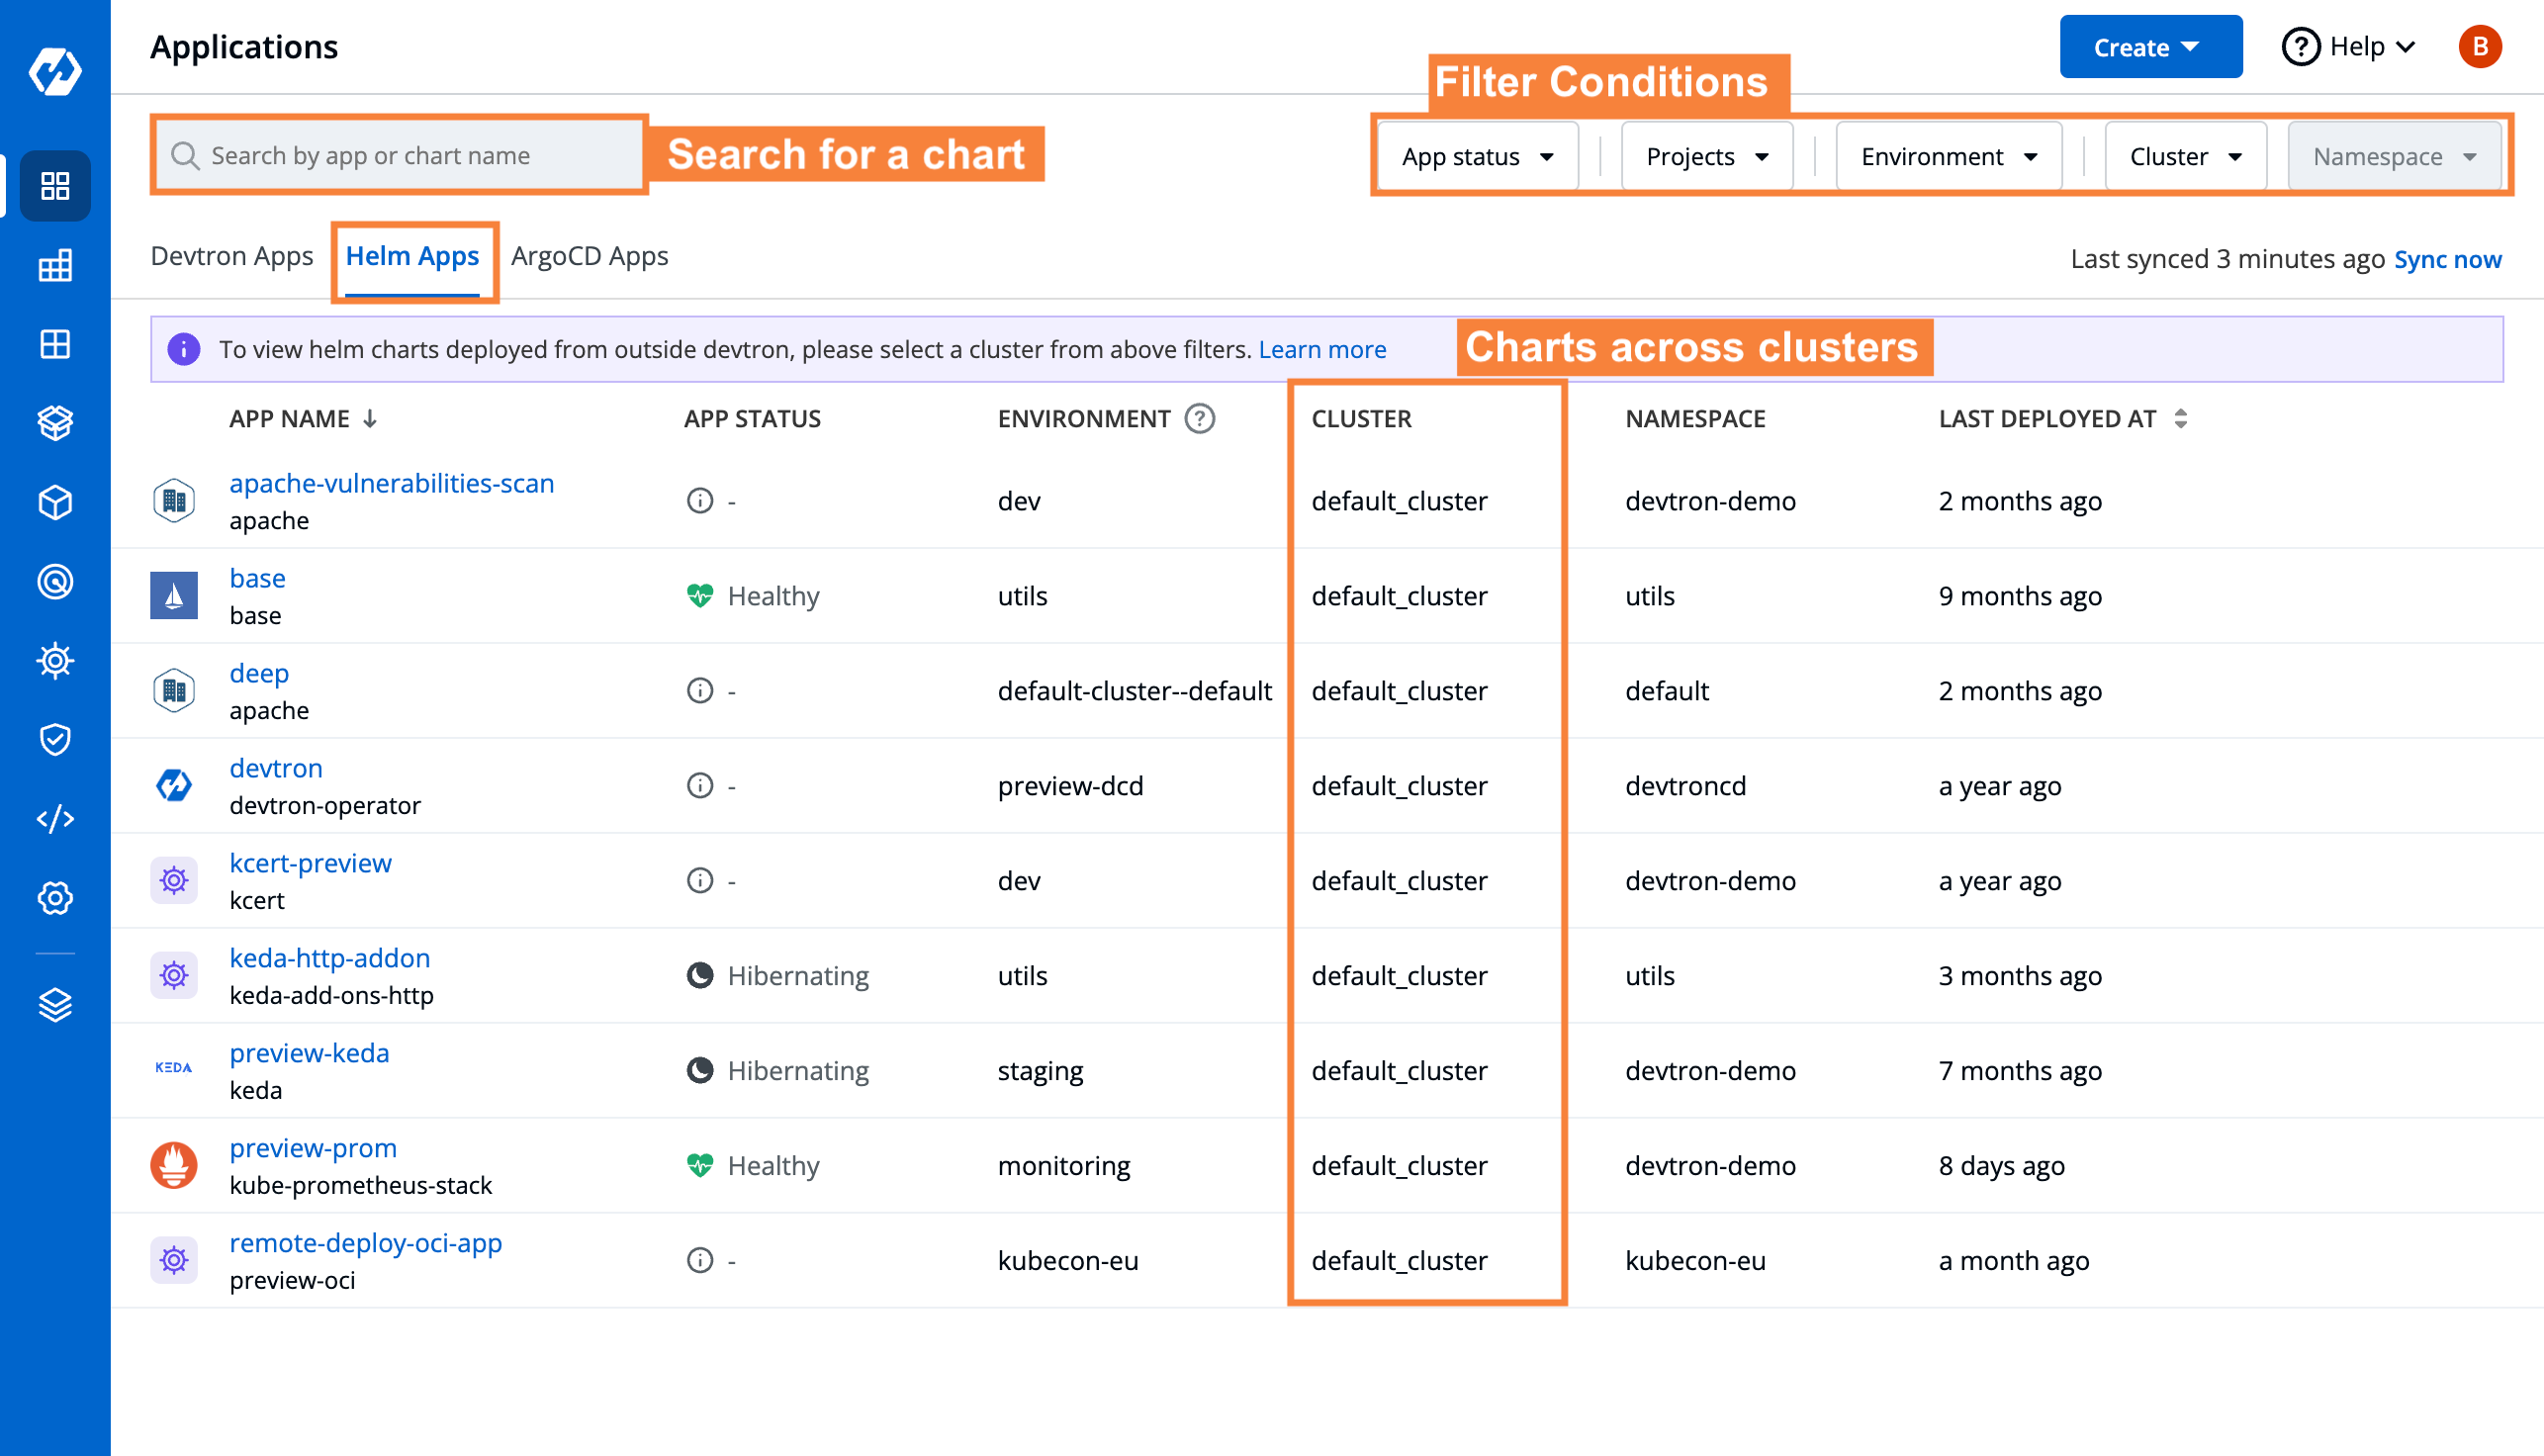
One of the big pain points of using helm CLI or kubectl is that there isn’t any unified platform/dashboard to manage deployments across multi-cluster in a hybrid cloud. As seen in the above image, Devtron does it very smoothly. With Devtron’s application tab, you can easily observe and manage your deployments across multiple environments and clusters, irrespective of the cloud providers.
Deployment Values Comparison
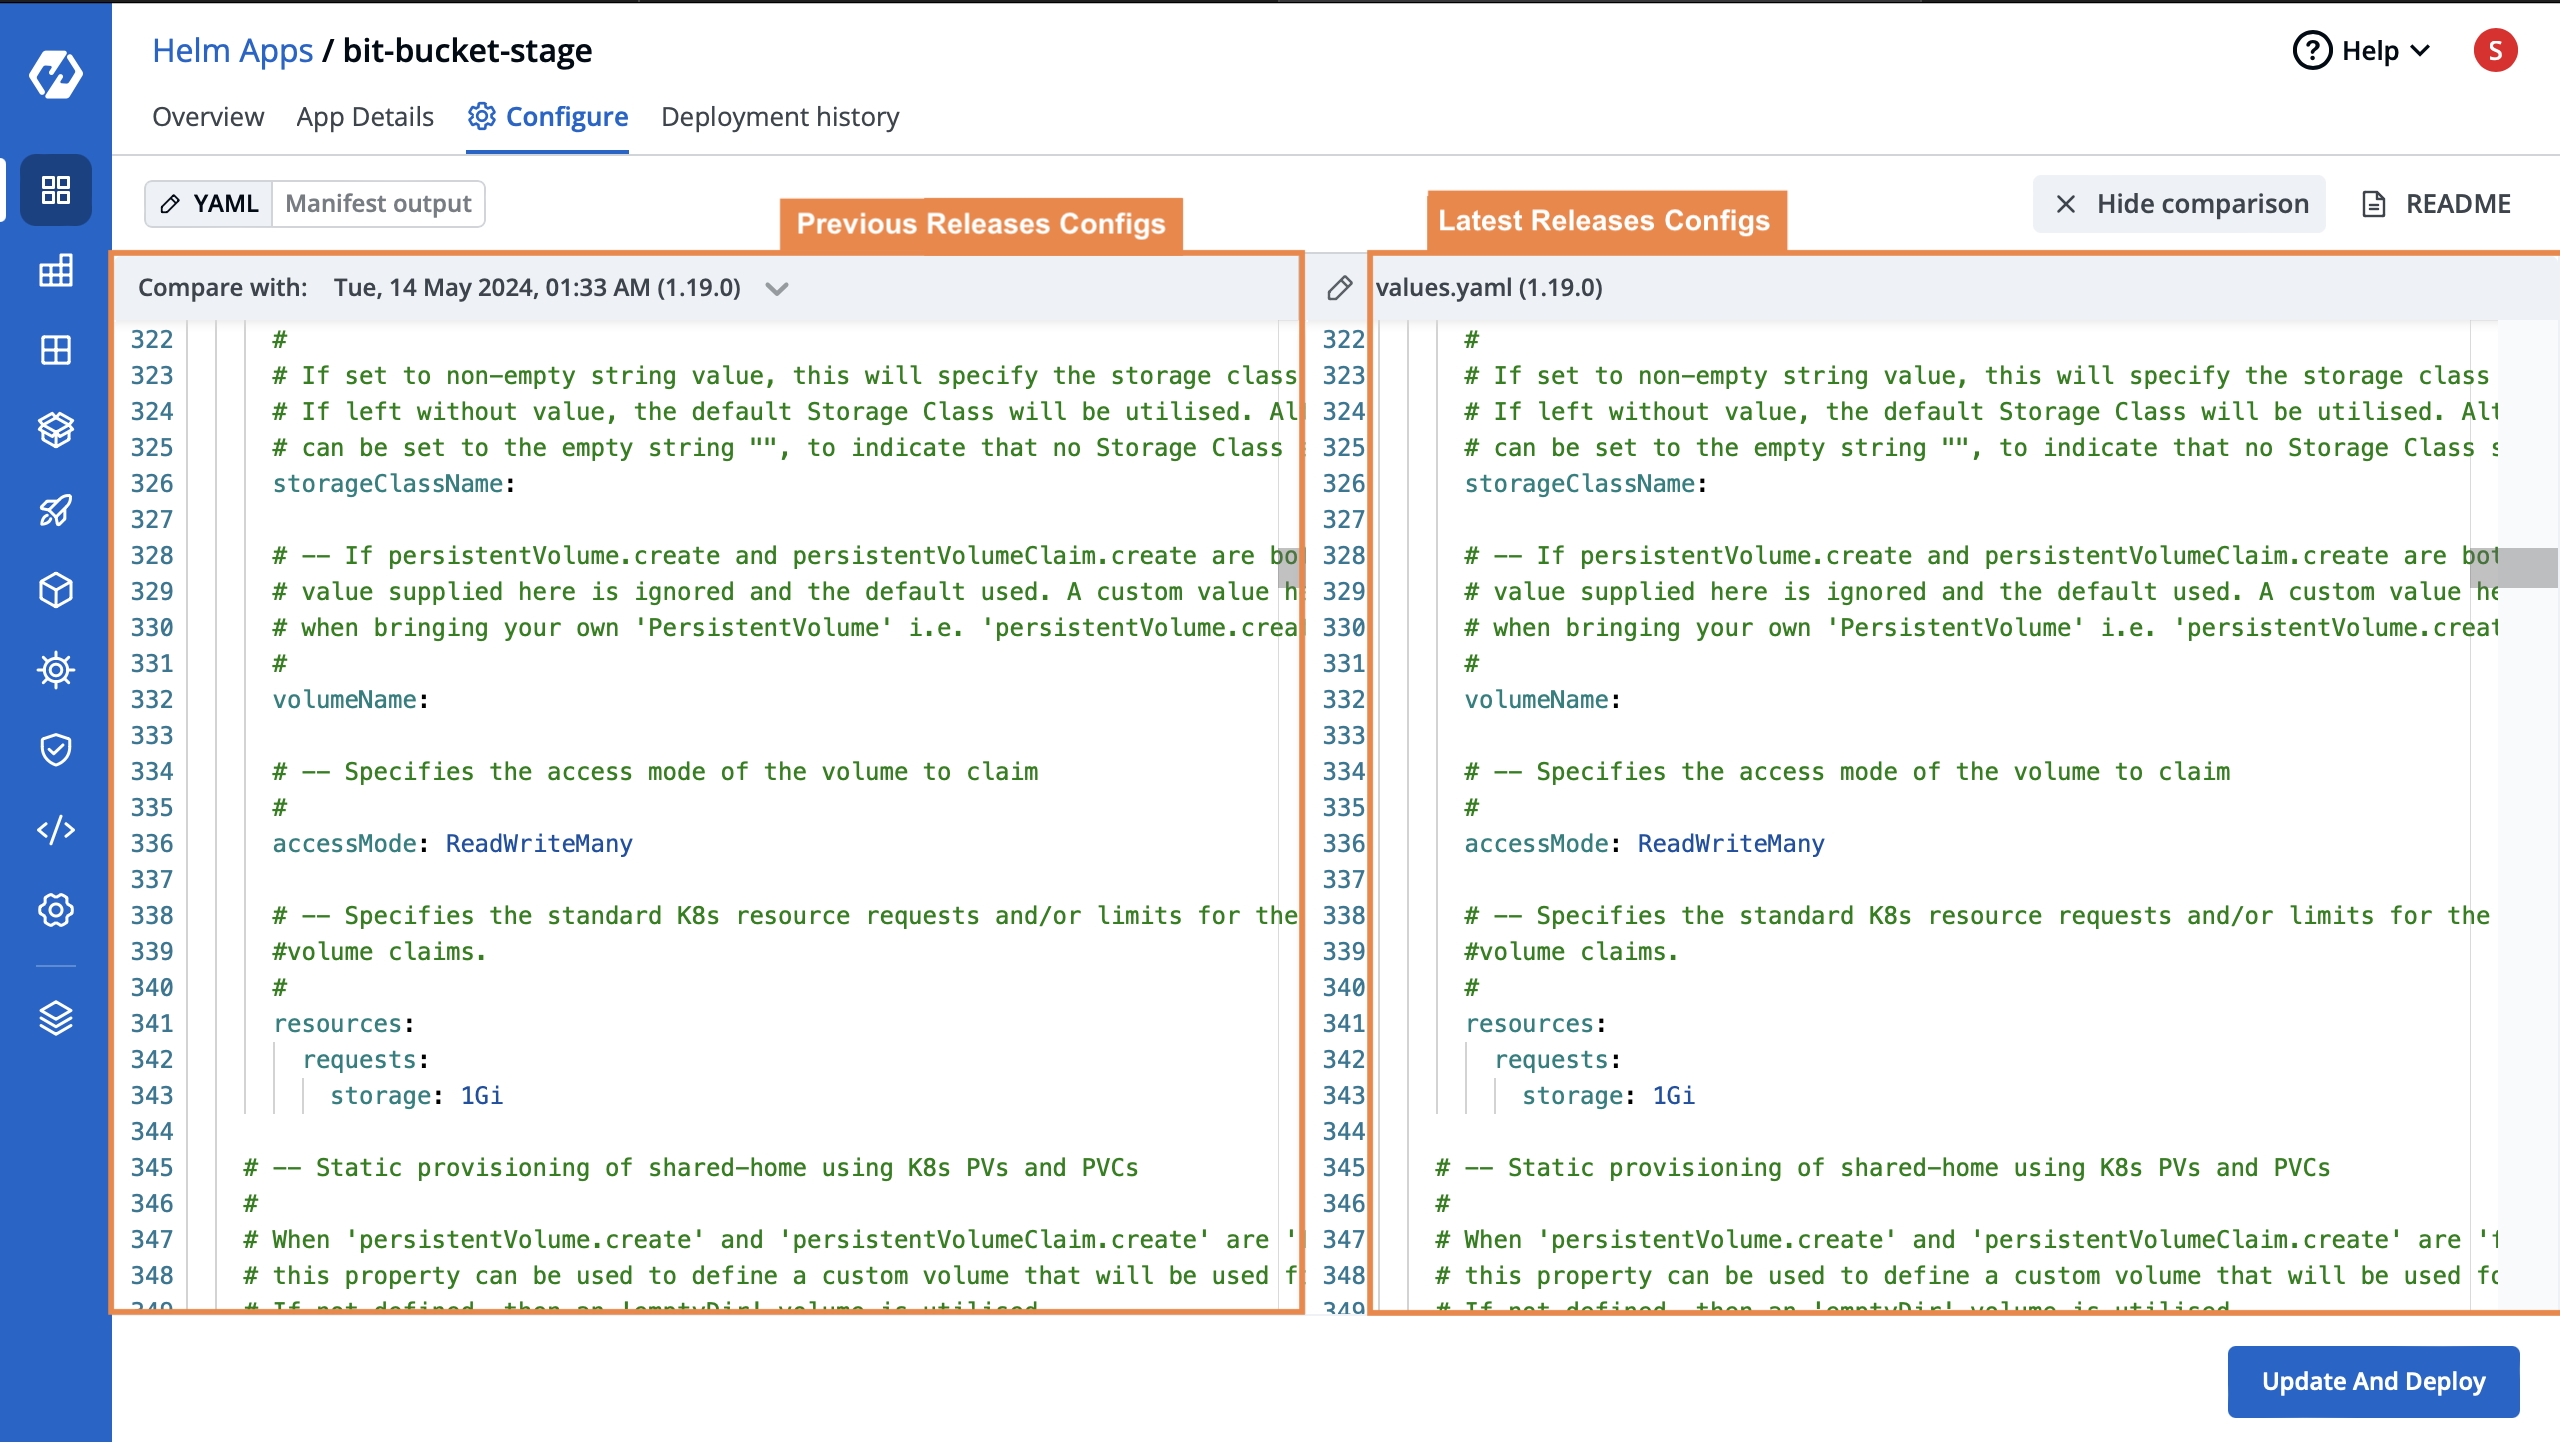
One of the primary questions that SREs and developers ask while troubleshooting is “What changed” since the last time the application was stable? In the context of Helm, comparing value.yaml files is one of the most common workflows for all teams. Devtron’s Helm Dashboard provides a handy way to compare Helm configurations when you are dealing with an incident or troubleshooting
Hibernation of Workloads
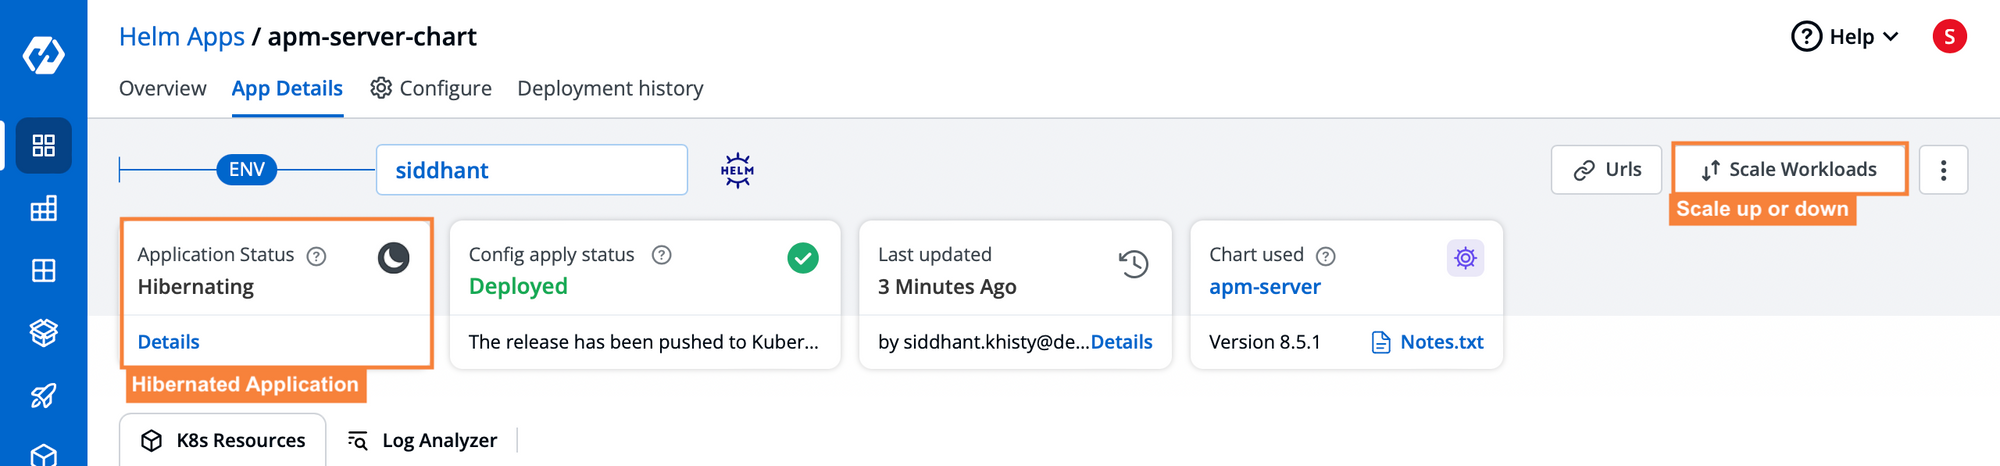
There’s no Out-of-the-Box support for the Hibernation of workloads in Helm or raw Kubernetes. When it comes down to cost optimization, it becomes essential to consume the resources as per requirements, and especially talking about small-scale industries or startups, features like hibernation of workloads can help them save dollars just with a few clicks.
It becomes very effective for environments like non-prod or staging. With a few clicks, as shown in the image above, you can quickly scale down your workloads, not in use, and save the infra costs.
Access Management
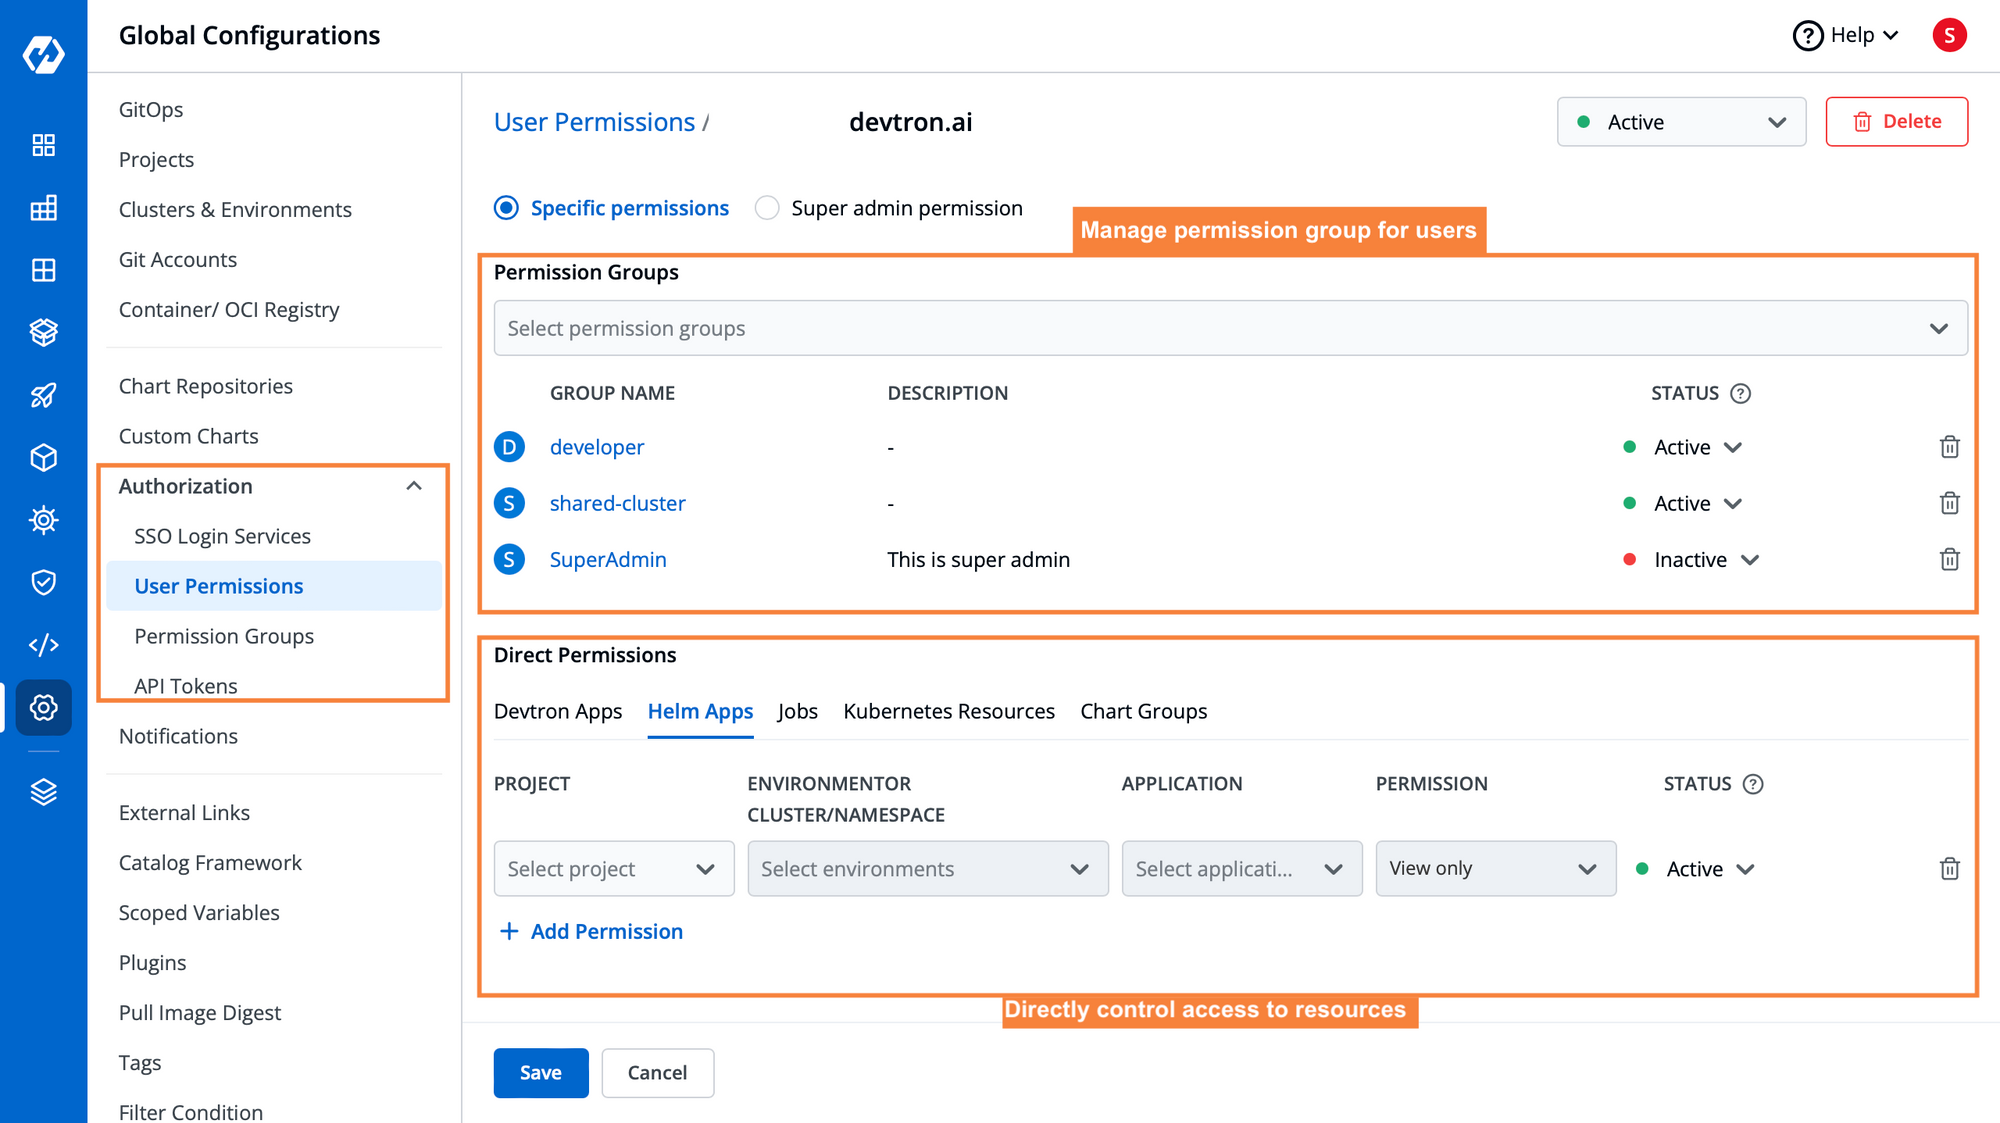
When you use raw Kubernetes or Helm CLI, collaborating with other team members becomes a bit complex. For adding any user or upgrading any user's access, you will need to write RBAC rules every time. But Devtron significantly simplifies that. Internally it also uses RBAC, inheriting all its advantages and abstracting out the complexities by providing this intuitive user interface, as seen in the above image. You can add users just in seconds.
Devtron also has its flavor for access management and enables teams to provide access at different levels - for entire projects, environments, and even for a single application. It also comes with Group permissions wherein users can create a group of accesses, for e.g - View only access to maybe staging environment for all new joiners and add the group permissions while adding new users. Please refer to the documentation on User Permissions for more detailed information about fine-grained access management for helm apps.
Security Scanning
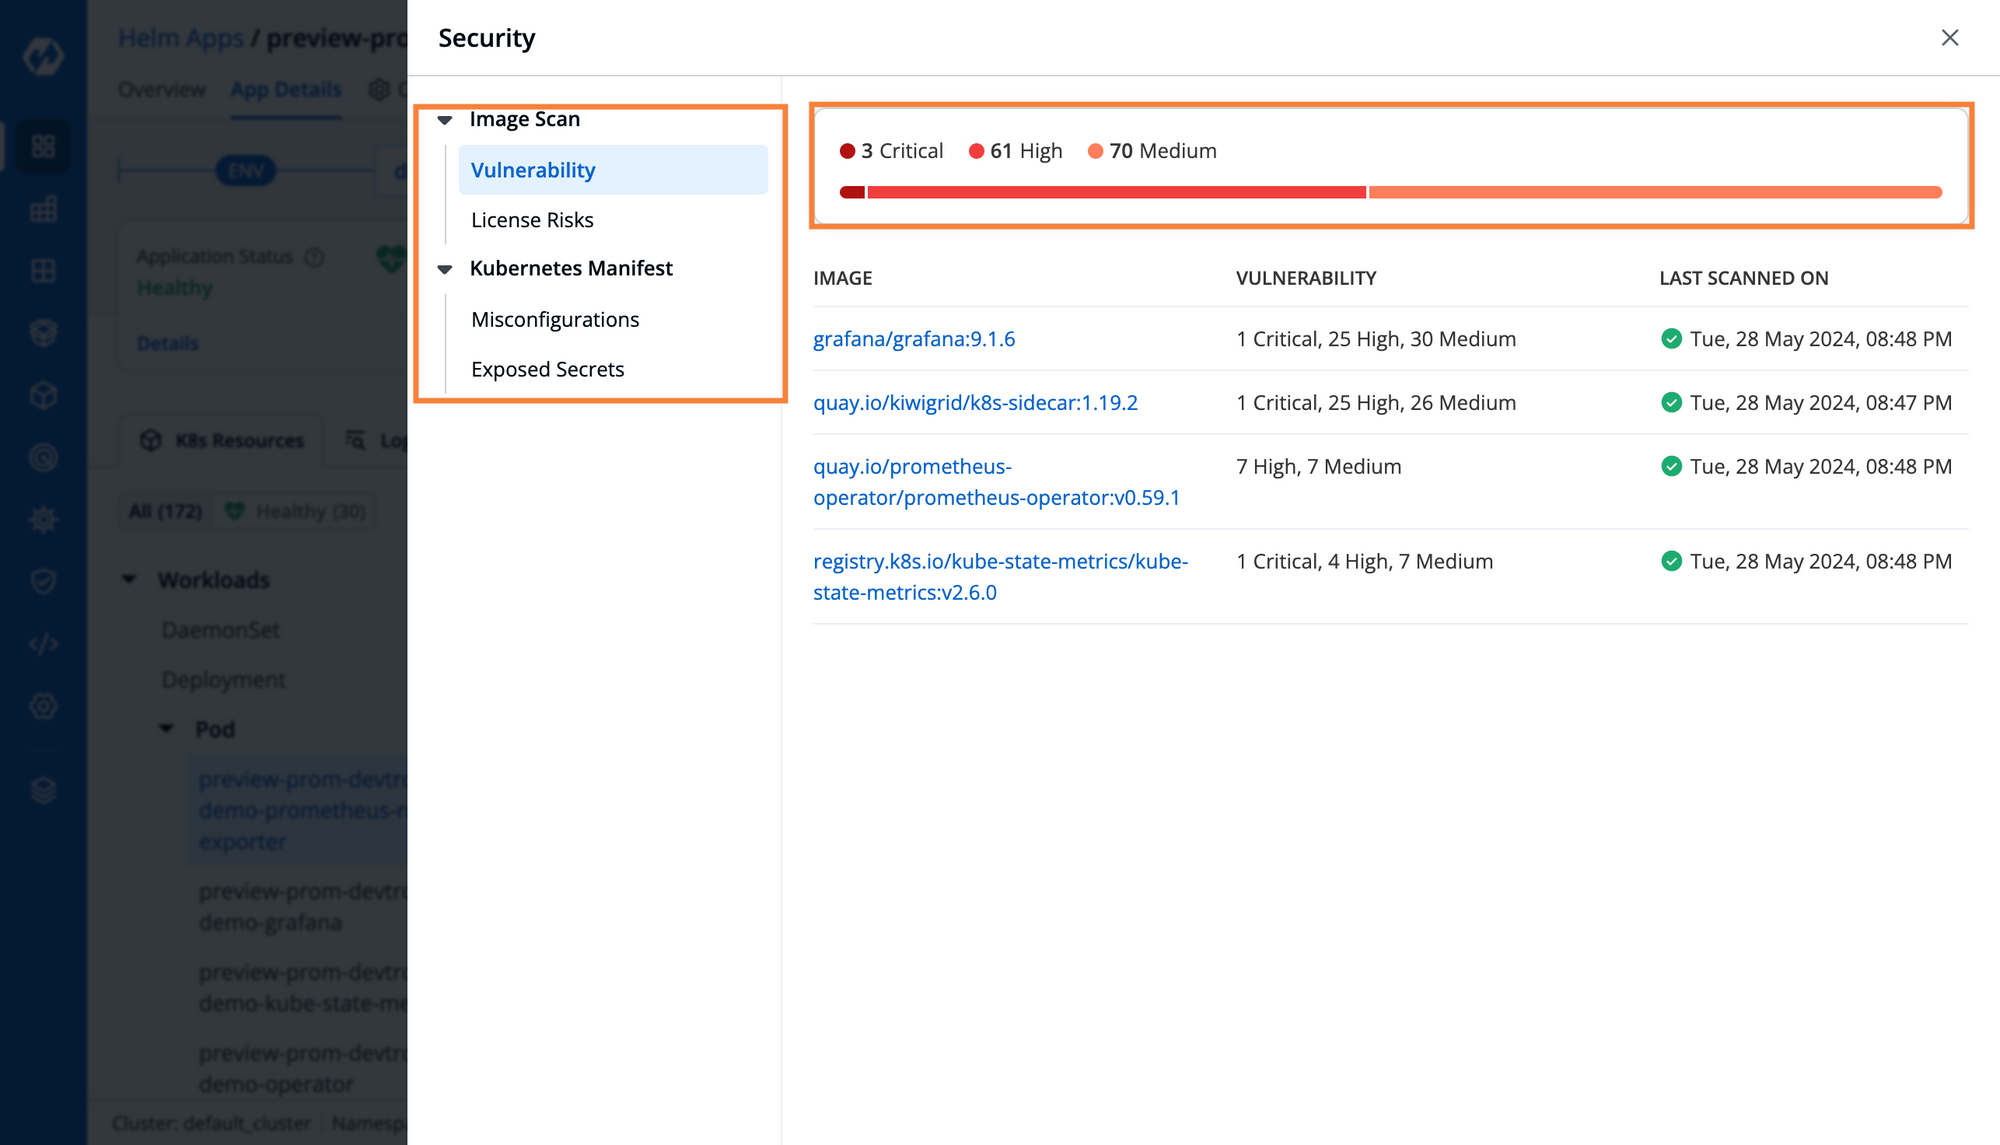
Within all your applications, you want to make sure that you run some security scans before deploying them to production. Unfortunately, the Helm CLI does not provide any kind of security scanning for the charts you deploy. You will need to install another tool such as Trivy or Clair to scan your helm resources.
Within Devtron, we've created an easy way to scan your helm resources from the dashboard itself. All you have to do is press one button, and you will get the results for the applications. Devtron also runs these security scans automatically when you deploy any charts. This makes it much easier for you to get security details of your applications, and take the necessary actions.
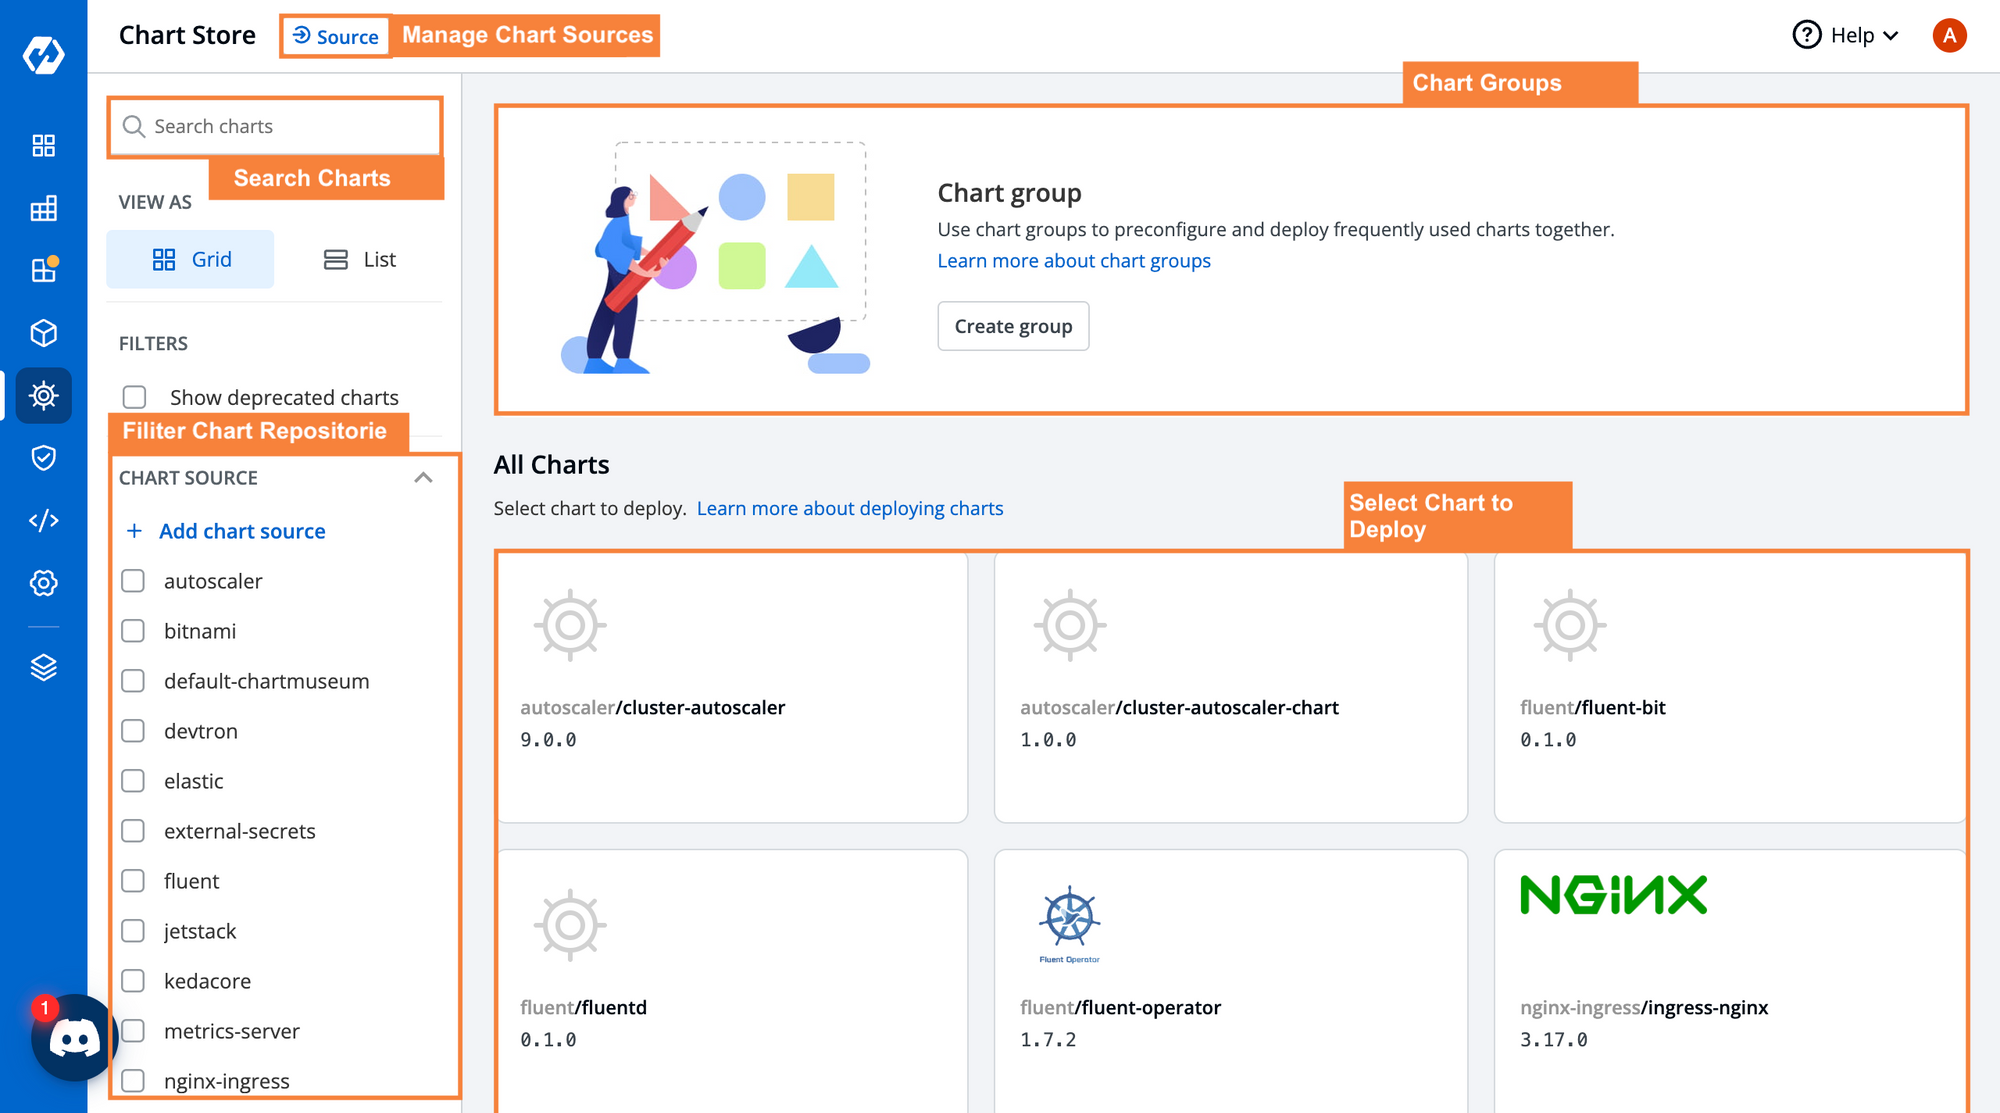
Chart Group
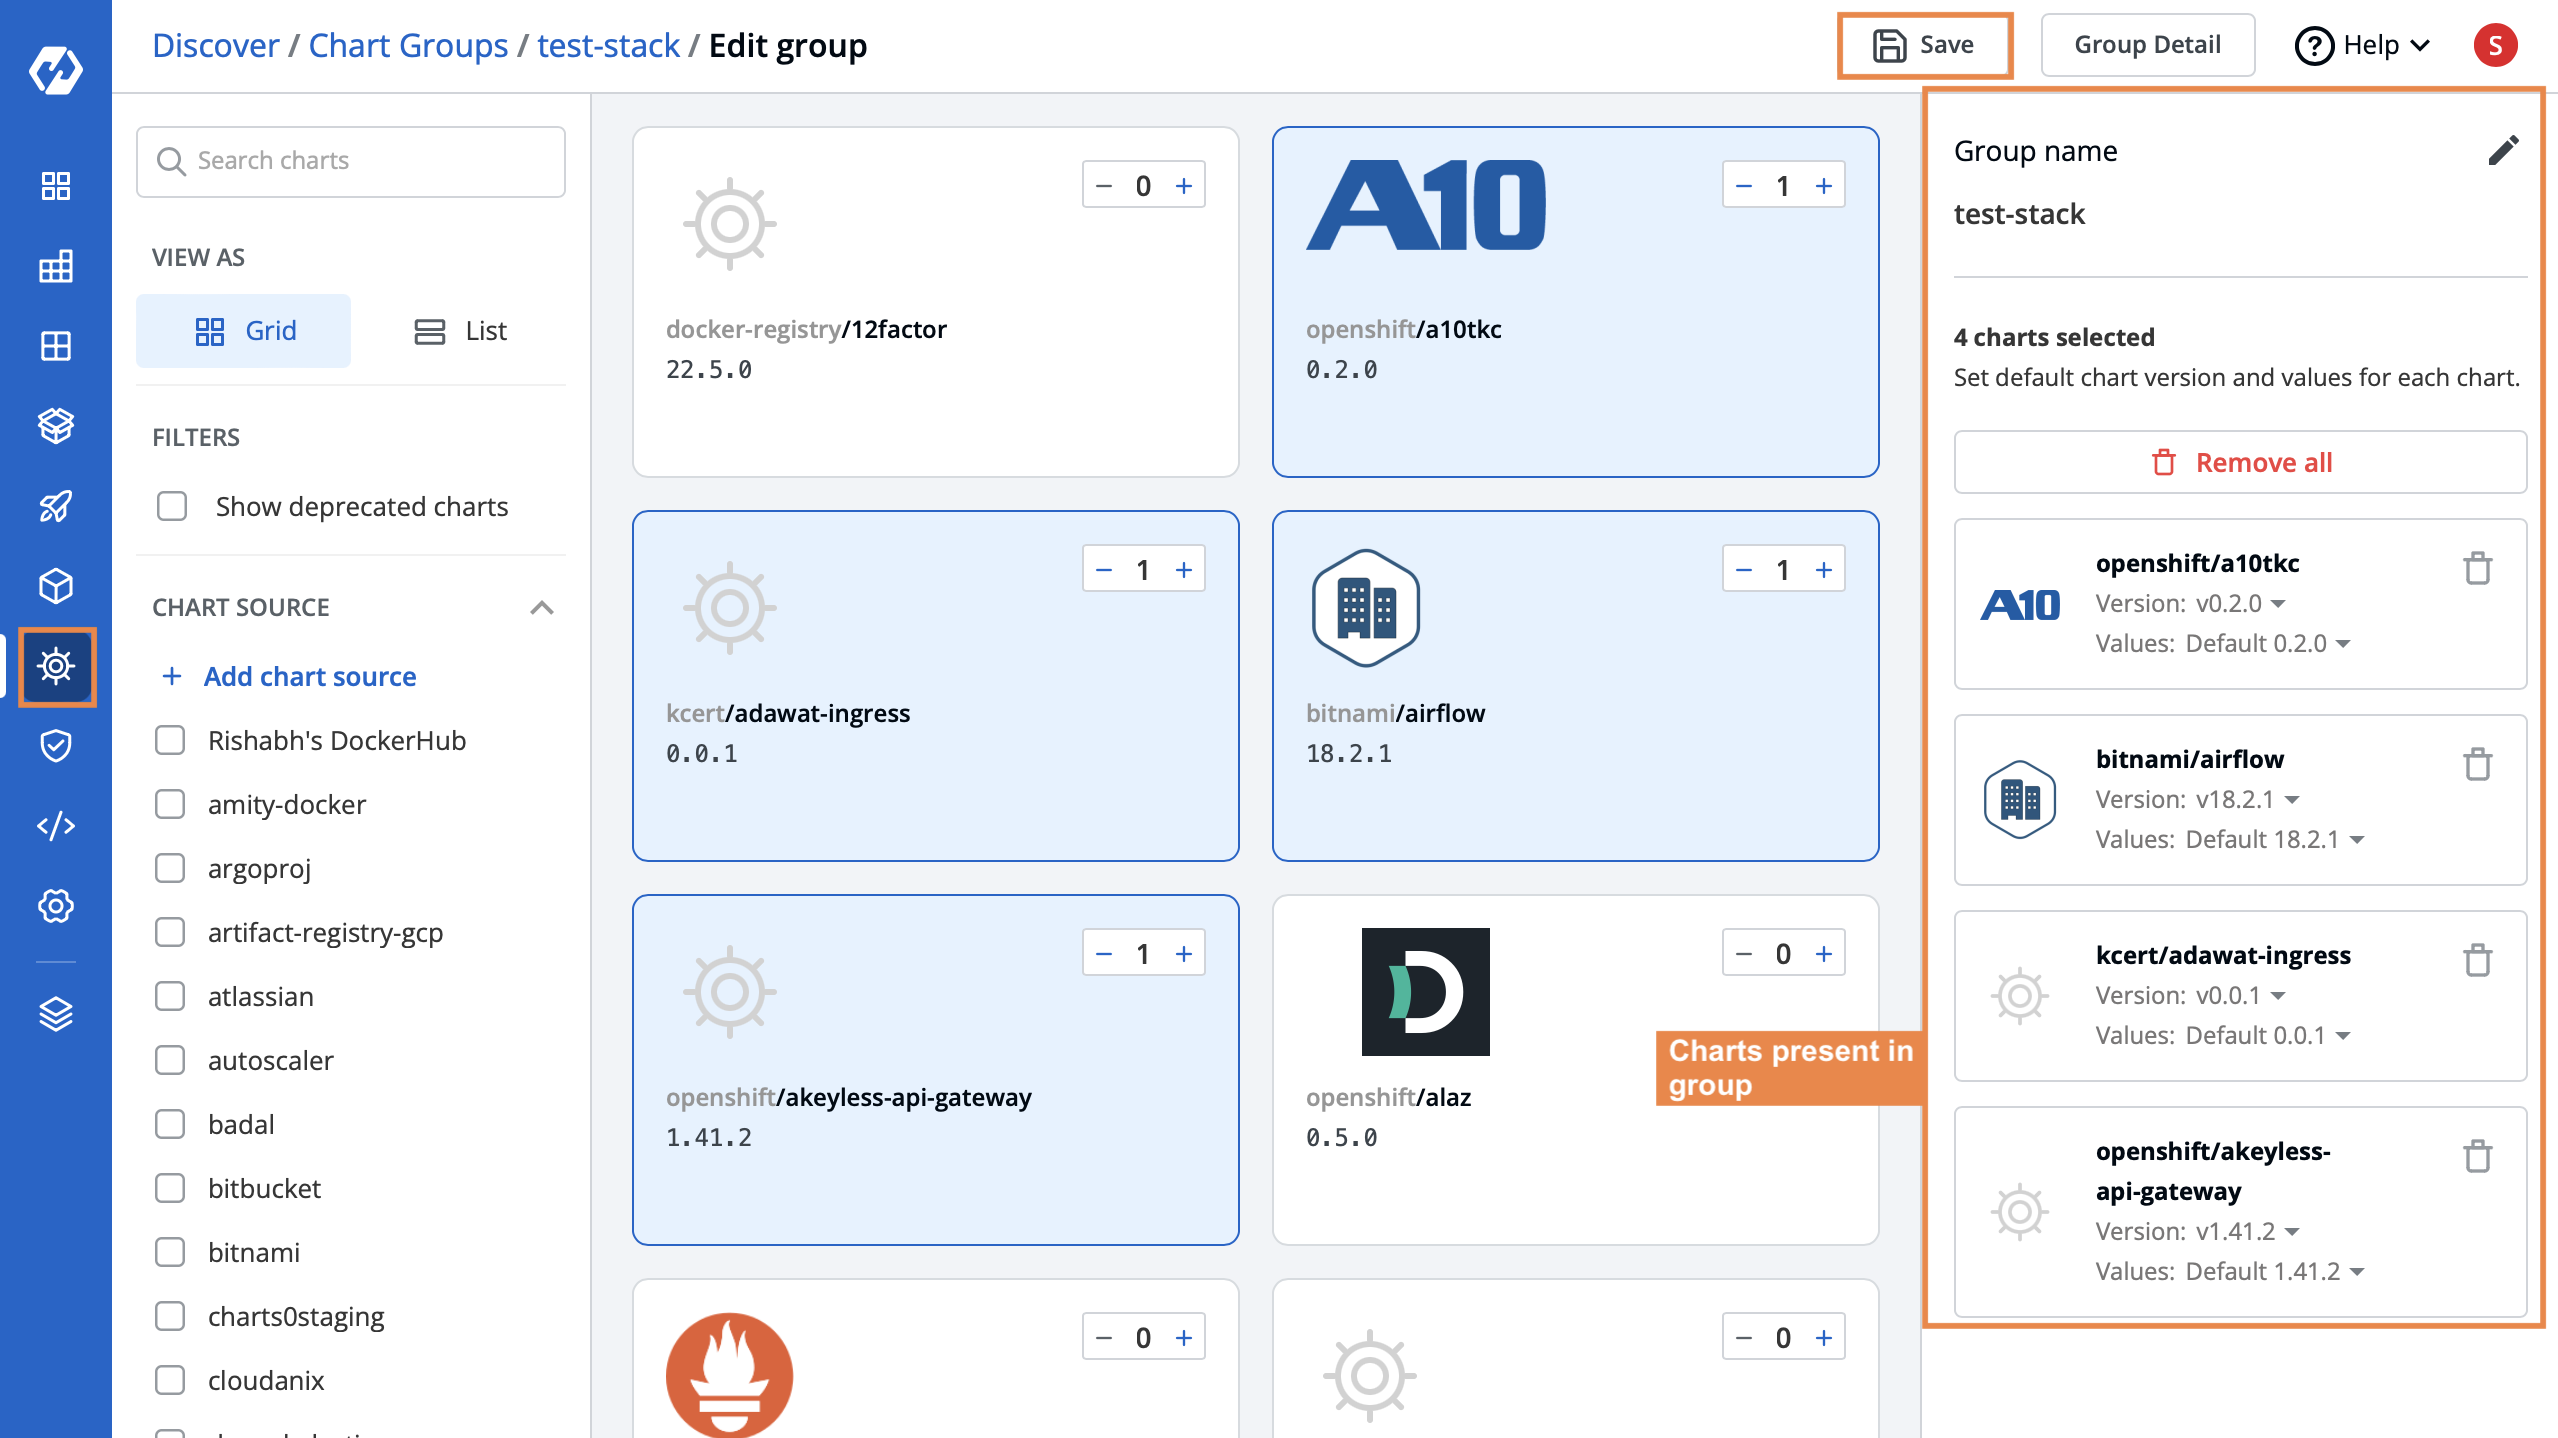
When deploying an application to your cluster, there might be many different helm charts that you will need to install. Often, all these different charts are spread across different helm repositories. For example, you may want to install some infrastructure components such as Istio, NGINX, Keda, etc within your cluster. To do this, you'd need to find and add each chart repository and run multiple helm install commands to get those applications in your cluster.
Within Devtron, you get the option to create groups of multiple helm charts. This makes it much easier to deploy a particular stack within your cluster. For example, you could make a chart group for your monitoring stack that may consist of Prometheus, Grafana, Loki, Jaeger, Kibana, etc. Instead of having to install each one of these individually, Devtron lets you group these charts, and deploy them with a single click. This makes it much easier and faster to deploy applications on your Kubernetes clusters.
Conclusion
The adoption of Kubernetes is increasing, and so is the usage of Helm. To ensure business agility with minimal errors in deploying Kubernetes with better management and debugging capabilities, community users can adopt the Helm Dashboard in Devtron. Go ahead and install Devtron and play around with the dashboard
As part of our commitment to open source, we will strive to improve this dashboard further. We are always looking to learn about what problems we can solve for our community. If you have suggestions or feature requests, submit them on Github.
FAQ
What are the main limitations of using Helm CLI for Kubernetes application management?
No real-time monitoring or health checks for deployments
Lack of easy resource grouping for debugging
No built-in access to chart README files
Poor multi-cluster visibility and management
No native support for security scans, access control, or workload hibernation
How does Devtron’s Helm Dashboard improve Kubernetes application management?
Provides real-time workload health and monitoring
Groups resources by type (e.g., Networking, Storage) for easier debugging
Displays chart README next to value overrides for quick reference
Enables multi-cluster and multi-environment management from a single UI
Offers built-in security scanning, access controls, and workload hibernation
Can I manage multiple Helm charts and stacks efficiently using Devtron?
Yes, Devtron allows grouping multiple Helm charts into a Chart Group
Deploy complete stacks (e.g., monitoring tools like Prometheus, Grafana) with one click
Saves time and effort compared to installing charts one-by-one via Helm CLI
Does Devtron offer built-in security and access controls for Helm deployments?
Yes, Devtron includes automatic security scans before/after deployment
Fine-grained RBAC to manage user access at project, environment, or app level
Easy user and group permission setup through UI without writing YAMLs