One of the most painful challenges associated with Kubernetes is configuring, deploying and managing applications. While Kubernetes was designed to make it easier and more efficient to scale your applications, that involved breaking down apps into smaller components, each of which is its own self-contained application. This made it difficult to manage the apps, as there were just too many.
Thankfully, we have a solution to this problem, in the form of the Helm Package Manager. Helm greatly simplifies Kubernetes application management by providing a uniform software packaging method that supports version control.
Helm simplifies Kubernetes rollouts, but debugging a broken release is difficult. Devtron eliminates the guesswork in debugging, and your work becomes significantly easier. With Devtron, you can quickly diagnose issues and repair them in a timely way.
Although, with any kind of tech, it’s inevitable that something will go wrong sometime or the other. When that happens, you want to make sure that you have a robust and proven way of debugging the Helm applications. Whether you’re preparing yourself for the unavoidable situation, or you’re trying to debug a problem right now, this blog is going to add value for you.
Challenges with Helm Debugging
While Helm has a huge number of advantages for deploying and managing applications, it has it’s own set of shortcomings. If you’re interested in knowing some of the biggest challenges with Helm, we’ve written an entire blog where we discuss the pain points of Helm in detail. Debugging with Helm is difficult, and two main challenges are associated with debugging in Helm
- Lack of visibility: When you deploy a Helm application, you do not get any insights into the actual state of the resources deployed by Helm. You can run a
helm statusto get the state of the deployment, but even if something has gone wrong within the deployment, or if some resources are missing, it shows the status asdeployed. This can make it difficult to know when something has gone wrong. It’s even more difficult to pinpoint exactly what’s gone wrong, and what needs to be fixed. - Increasing application complexity: Applications have gotten more and more complex. Especially with Kubernetes where we have 100s of microservices that are all dependent on each other. Helm has made it very easy to deploy these complex applications. However, when it comes time to troubleshoot, the story changes drastically. Once you’ve deployed the chart, you don’t know if any resources are missing, or have not been deployed. For example, if some CRDs have gotten deleted, you have no way of knowing that.
There are not many tools in the market that provide a complete and comprehensive solution for observing, managing, and debugging Helm deployments in real-time. One of the leading industry tools that enables not just Helm, but Kubernetes management, and can prime you for successful debugging is Devtron.
Devtron is a lightweight dashboard for Kubernetes deployments, packed with full-fledged debugging features enabled with resource grouping for easier debugging for the development and Infra team.
To Install Devtron in your cluster please have a look at their installation documentation.
[Note: The only prerequisite for Devtron installation is to have a k8s cluster]
To take a look at how you can proceed towards debugging a Helm-based application, let’s do the whole process from creating a Helm app to seeing all the things that can and will go wrong and how to go about fixing them.
Deploying a Helm application
Before we go ahead and take a look at how to debug a Helm application, let’s first go ahead and deploy an application. We will be using the kube-promethus-stack helm chart. The kube-promethus-stack installs the Prometheus monitoring stack for us which includes Prometheus, Grafana and an alertmanager. To learn more about the stack, check out the official GitHub repository.
We will be using the Devtron dashboard to deploy, and debug the charts. So if you haven’t installed Devtron yet, head over to the official documentations so you can follow along with this guide.
Simplify Helm debugging and logging with Devtron
- Enhanced Visibility: Devtron replaces Helm's lack of visiblity with real-time visibility of deployed resources, which simplifies debugging.
- Intuitive Resource Groupings: Devtron's dashboard organizes resources intelligently such that debugging is simple for the infrastructure and the development teams.
- End-to-End Management: Besides debugging, Devtron provides a unified interface for managing Helm apps within clusters with ease.
Enjoy seamless Helm debugging and logging with Devtron.
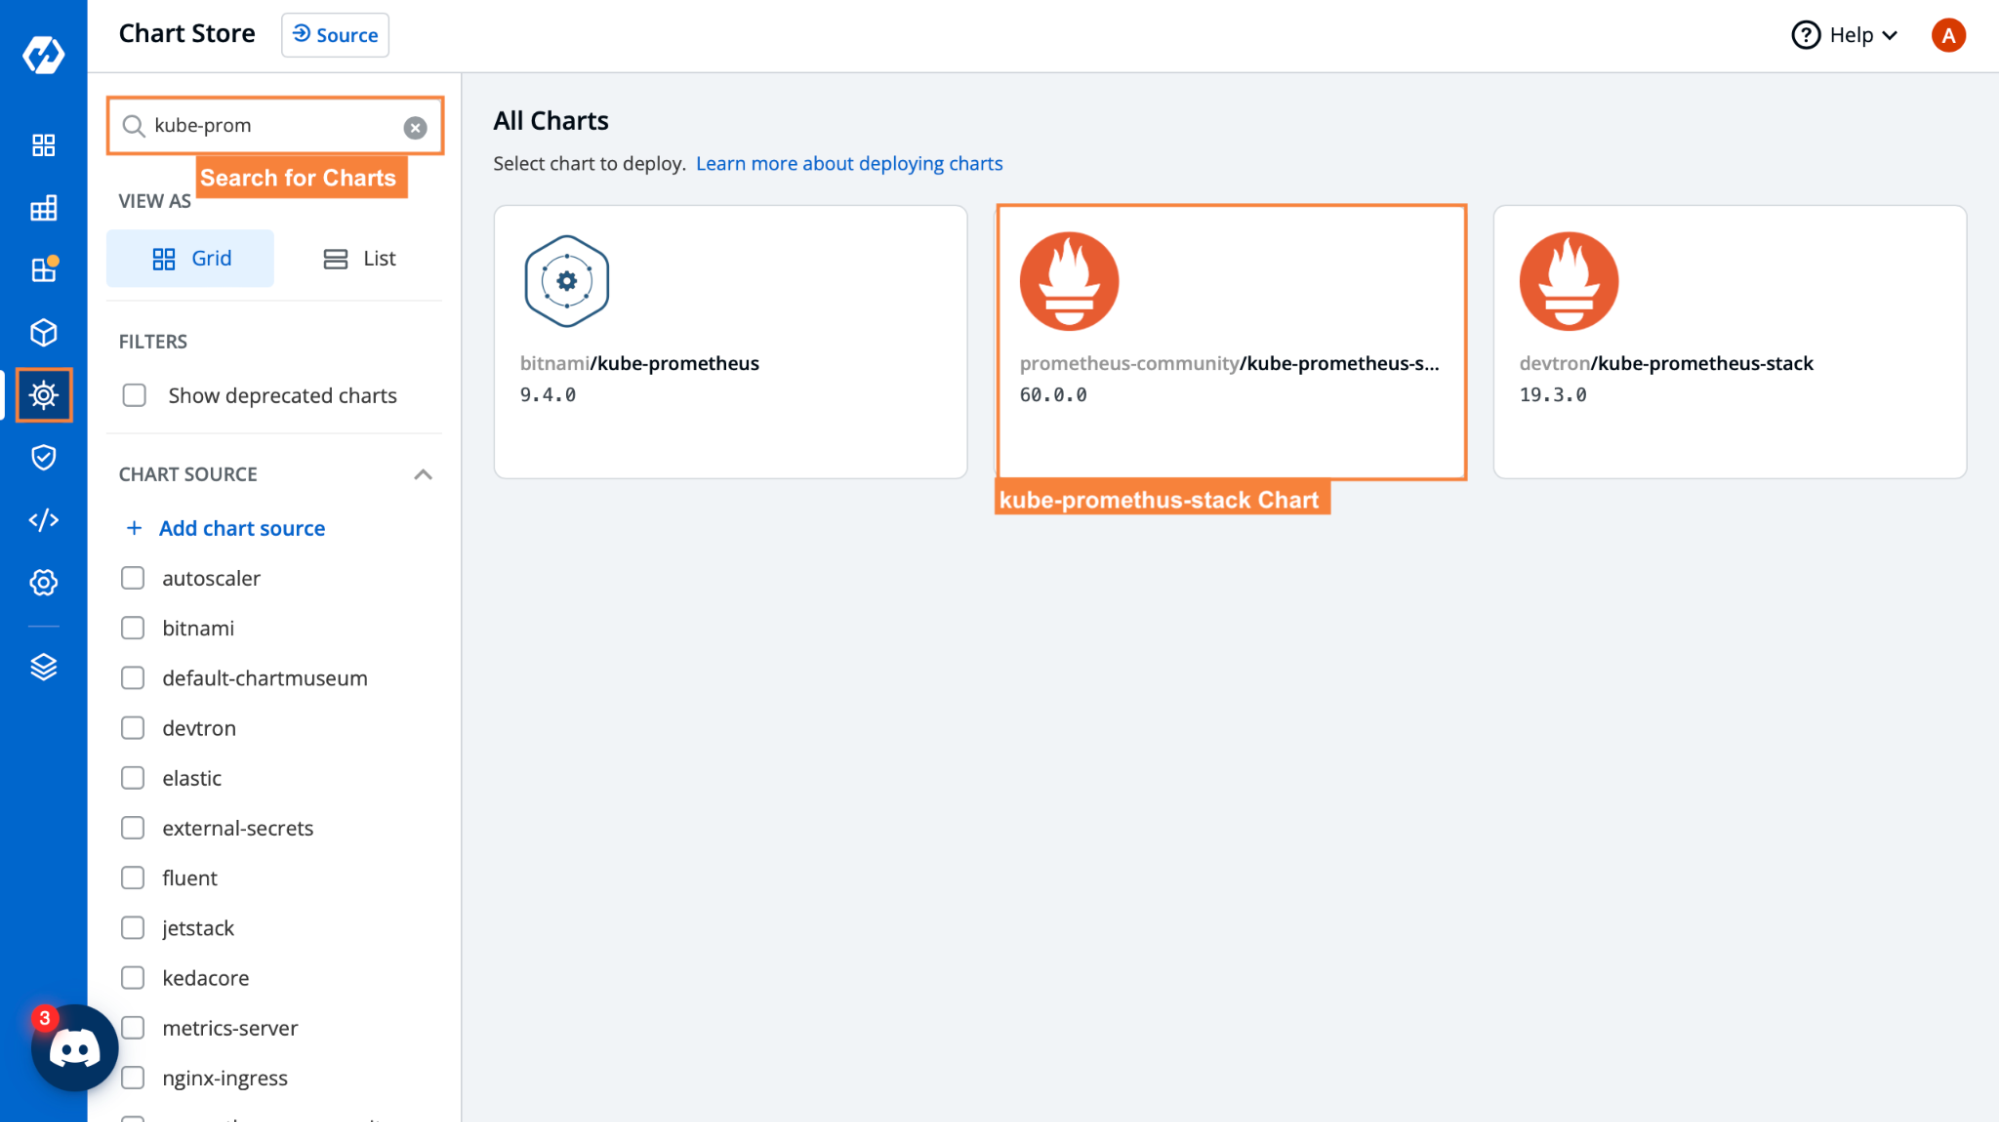
Get Started with Devtron →From the charts tab, search for the kube-prometheus-stack chart. Then, you want to click on the chart from the prometheus-community and click on Configure & Deploy.
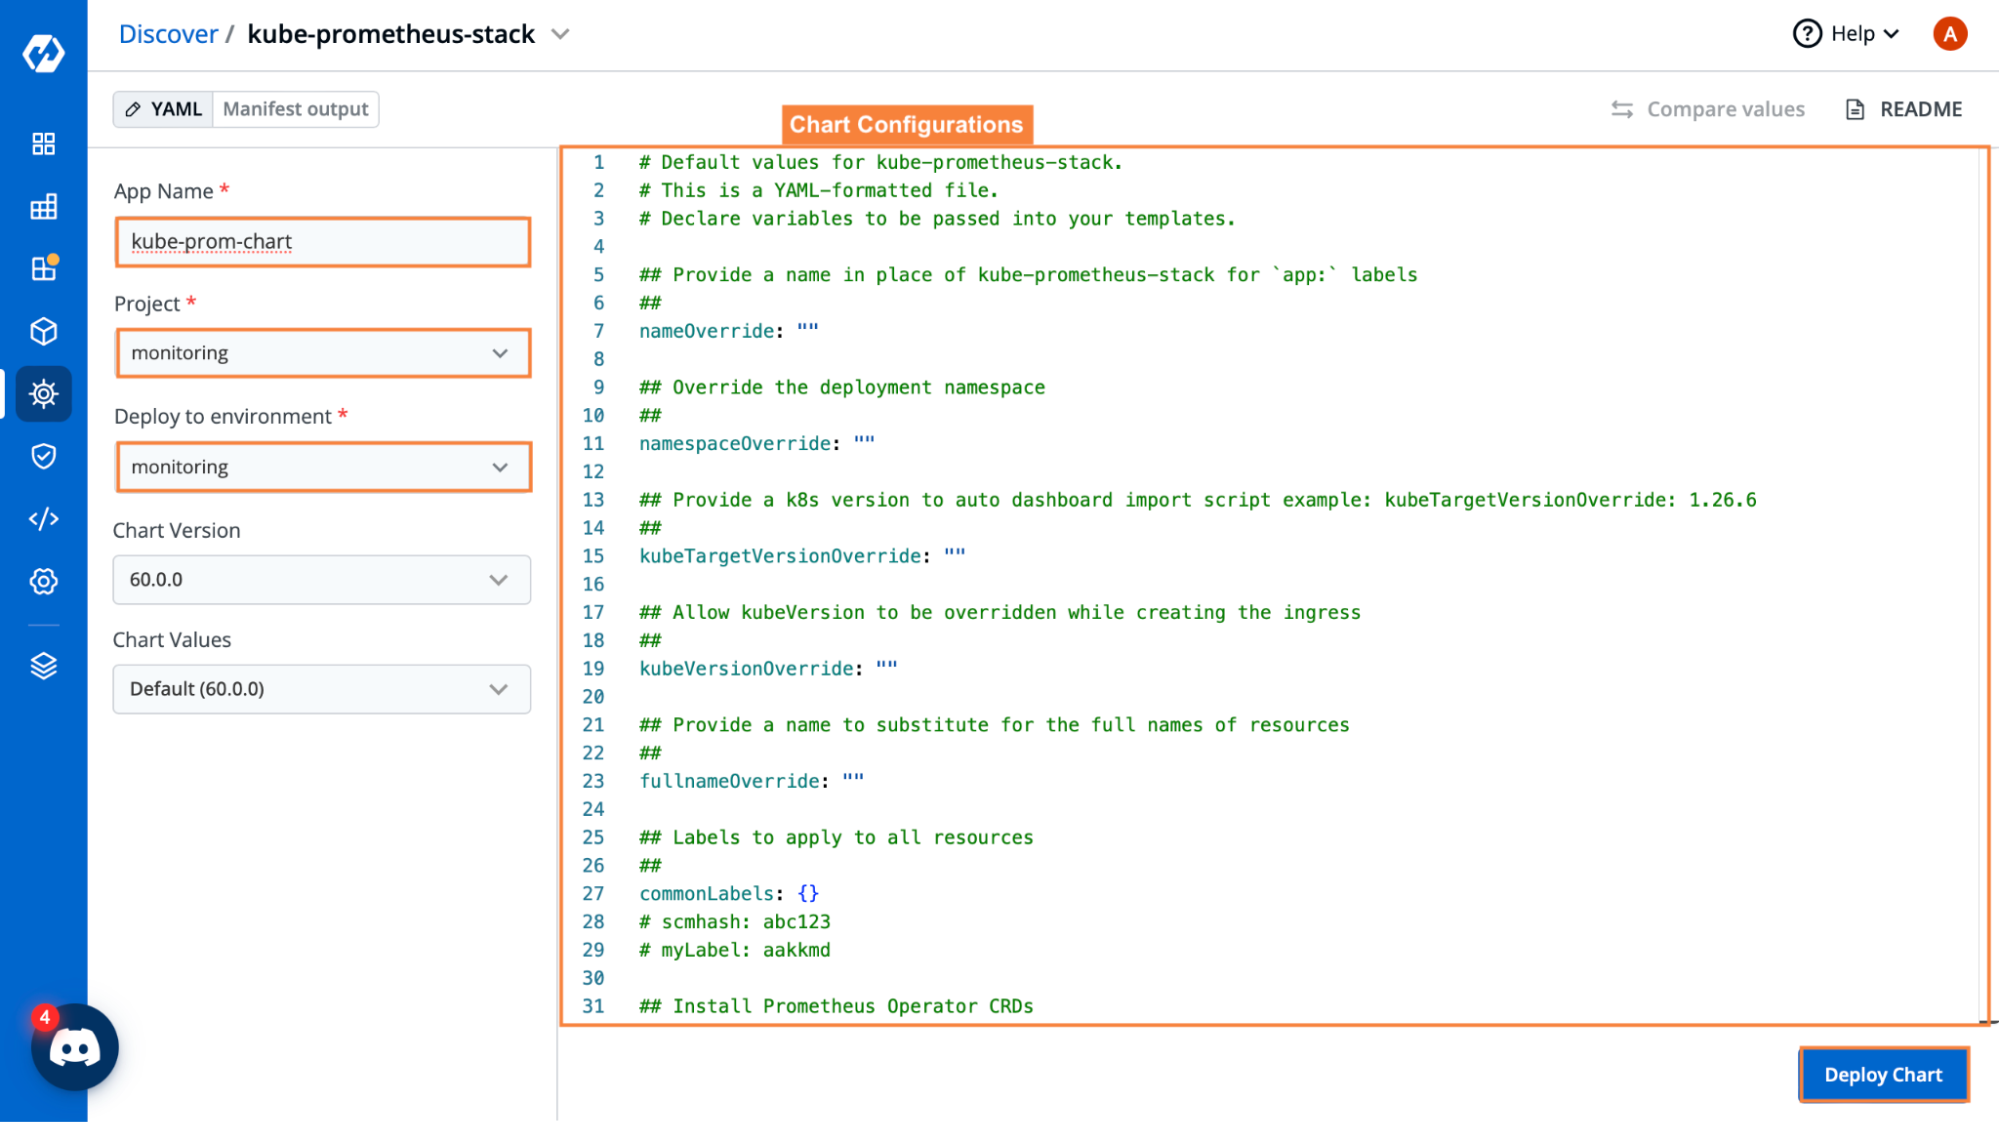
Next, we will go ahead and configure the chart. As you can see in the picture below, we can see the YAML file for configuring the charts. We can also select the application name and the environment we want to deploy the chart to.
Once you’ve finished configuring the details, go ahead and click on Deploy to deploy the chart.
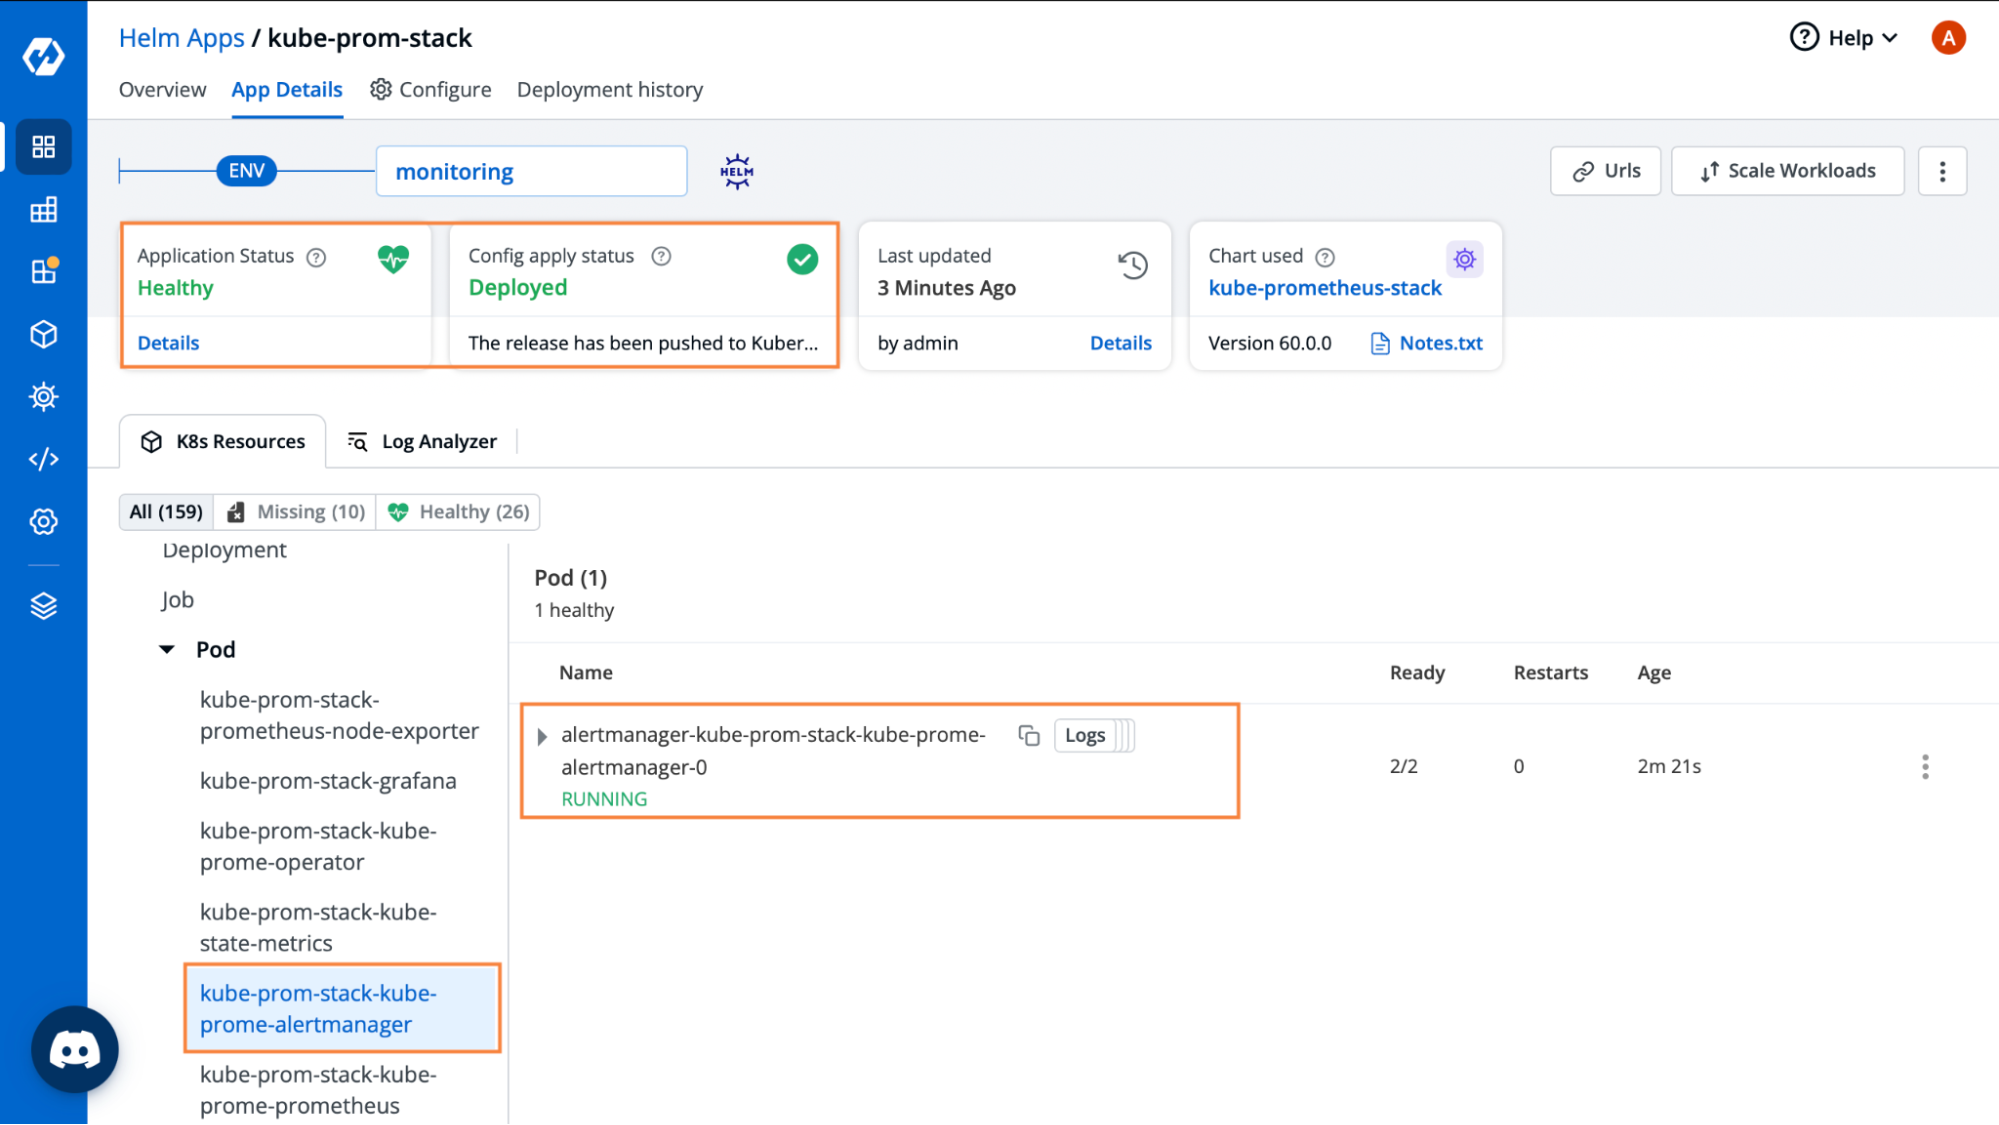
After deploying the application, we can see after a few minutes that the application status shows up as healthy.
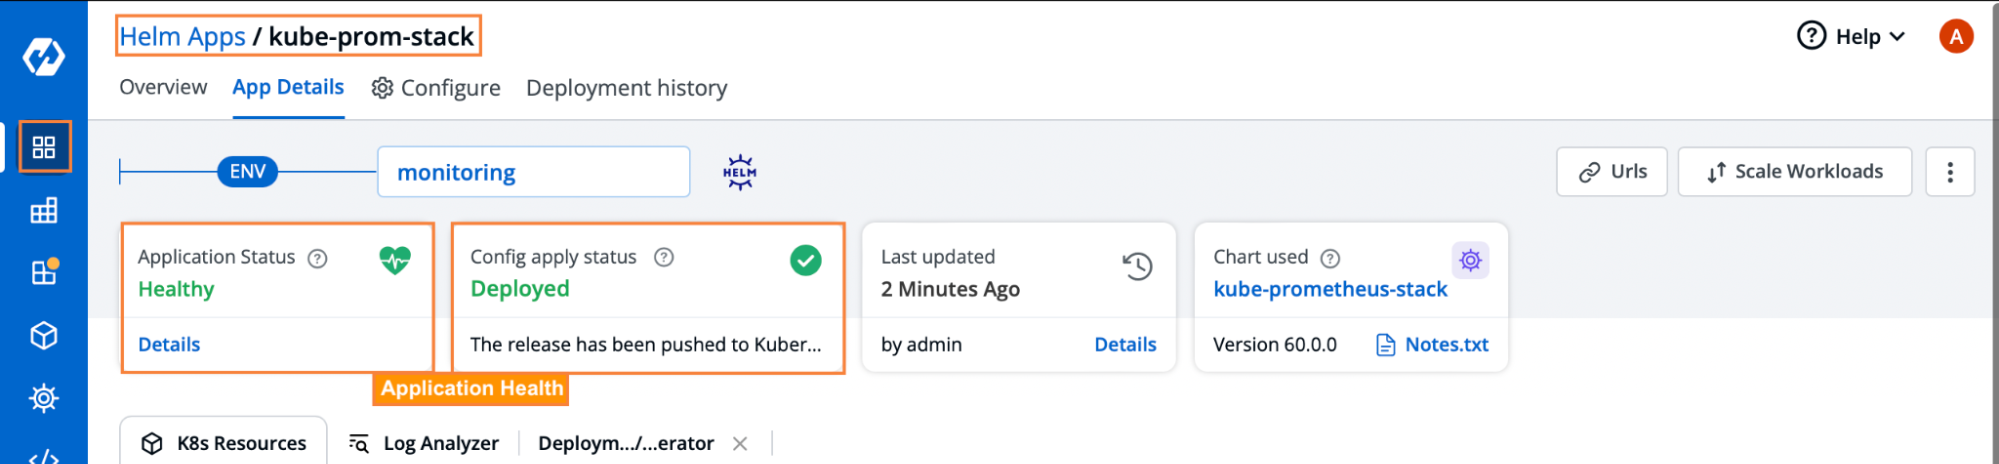
Now let’s assume that something goes wrong with the application and we need to analyse the logs to try and figure out what’s the problem. Luckily, we have a easy way to view and analyze the logs of pods and containers.
Devtron provides 4 Application states which are as follows:
Progressing: When the application status shows as progressing, it means that some pods are still getting created. Wait for some time, and the status should change to either Healthy or Degraded based on the state of the resources
Healthy: When all the pods, containers and application resources have been created successfully, the application status shows up as Healthy.
Degraded: During deployment or after running the application for a while, the application might go into a degraded state. This means that the pods have some kind of error or have gone into a CrashLoopBackOff state.
Missing: When you have the Missing application status, it means that there are some critical resources required for running the application that have not been applied. This can happen for many different reasons. For example, someone deletes the existing Custom Resources which are a requirement for the application.
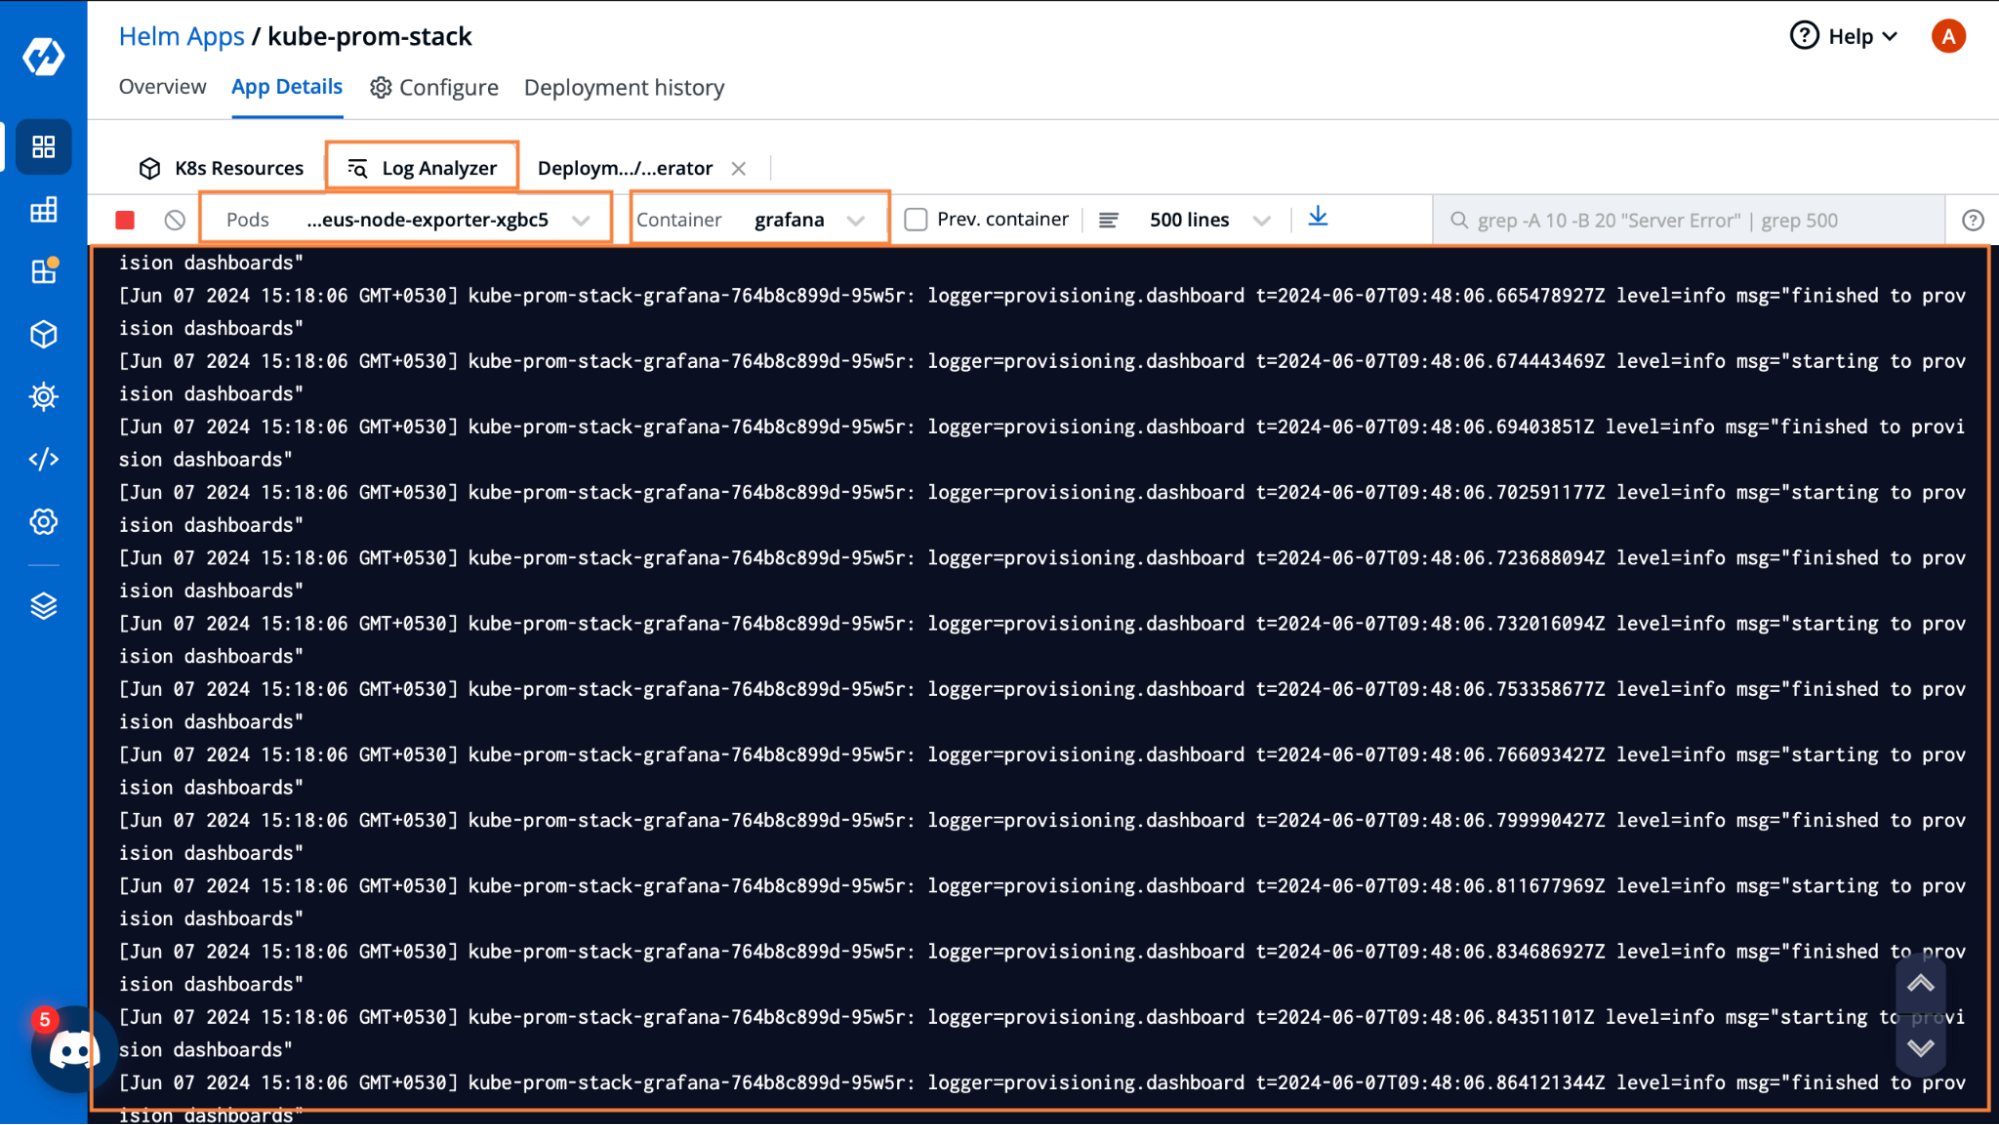
Within the App Details tab in Devtron, we have the Log Analyzer view. In this page, we can see all the application logs within the pods and containers. You can also select individual pods or containers that you want to check the logs for.
Since this application is in a healthy state, let’s try and do some mischief so that the application becomes degraded and we can take a look at the ways Devtron will let us debug the application.
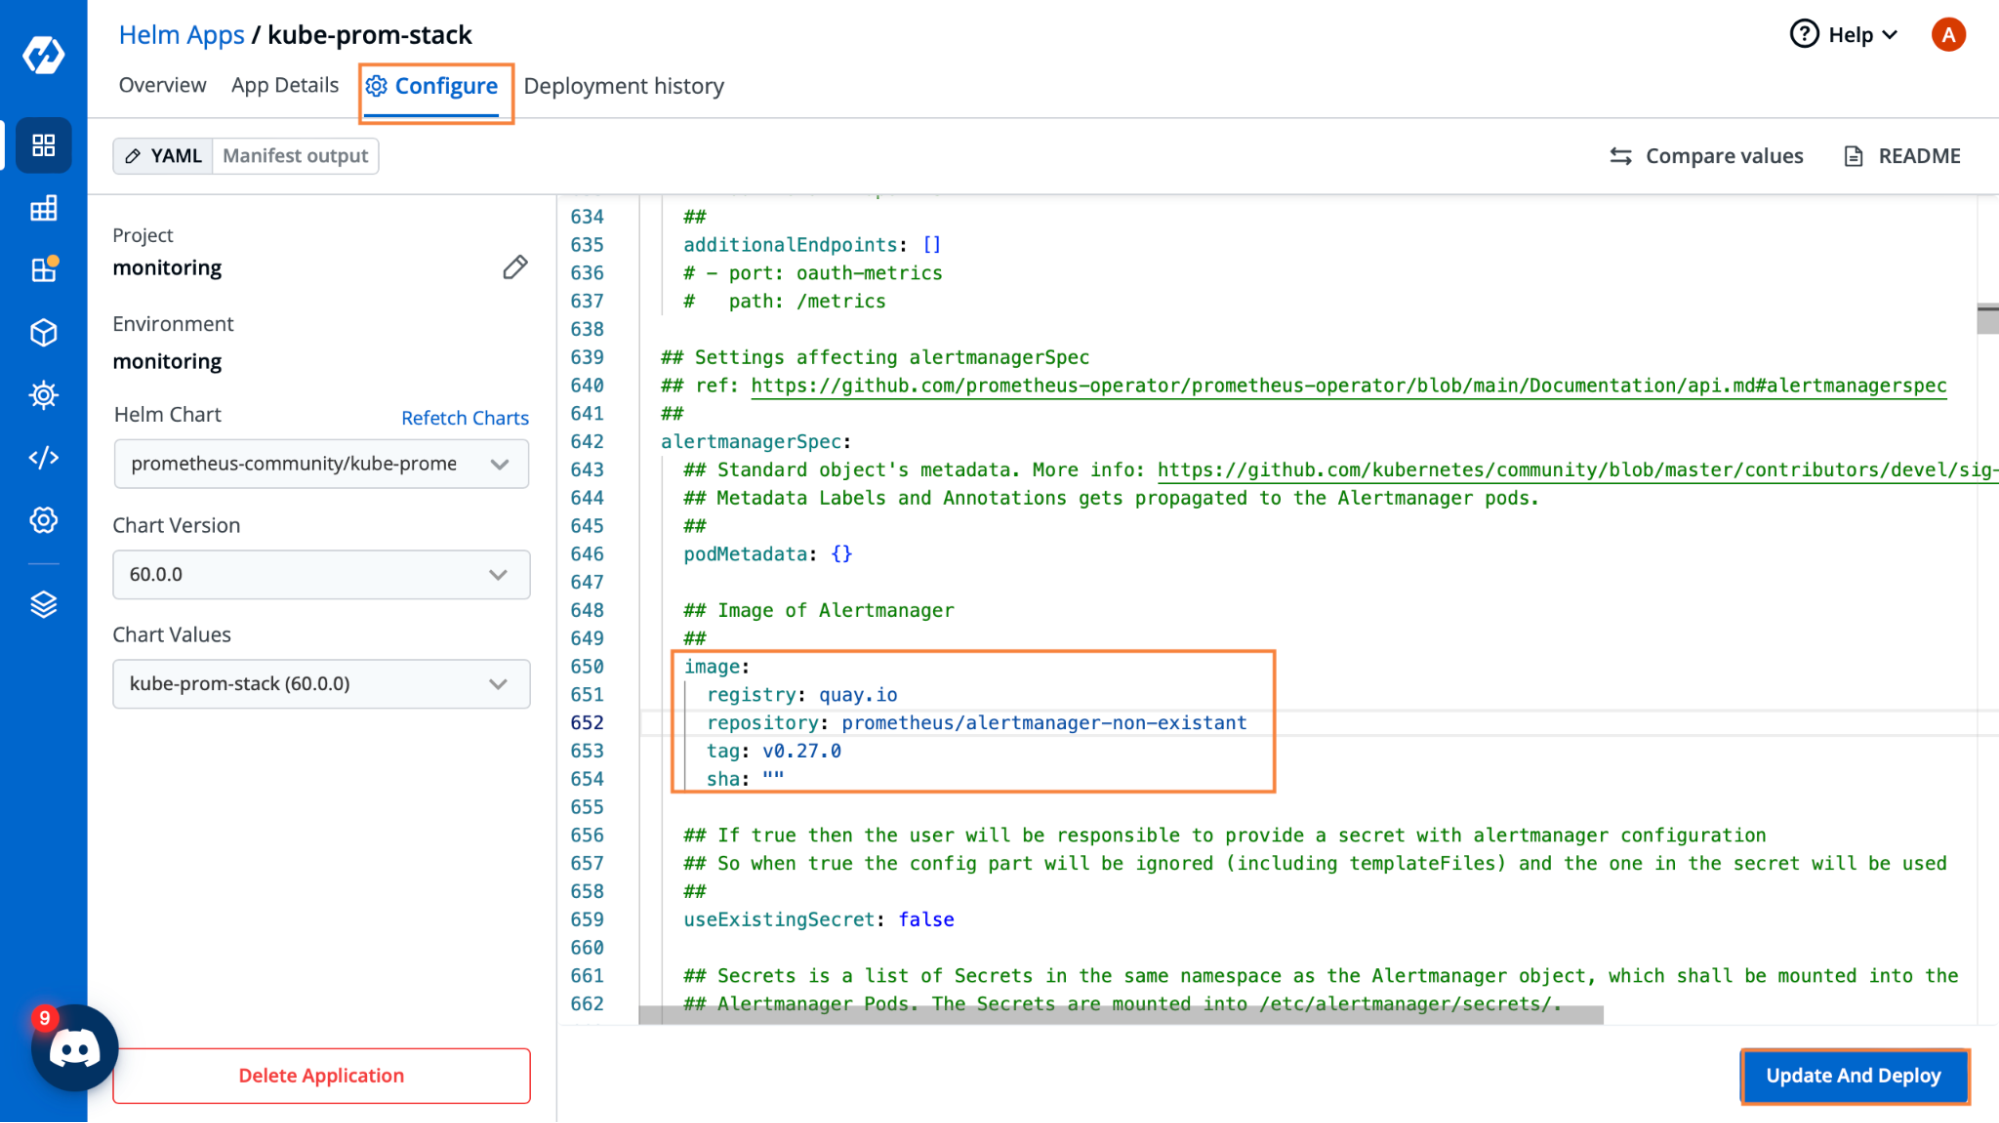
We are going to change the image of the alertmanger, to something that doesn’t exist. By doing this, the pods for this deployment will go into a CrashLoopBackoff as they cannot find the required image, and hence, our application will go into a degraded state.
Head over to the configure tab, and edit the image. Here, I’ve changed the image repositorty name to one that does not exist. Once you’ve made the changes, go ahead and click on Update and Deploy
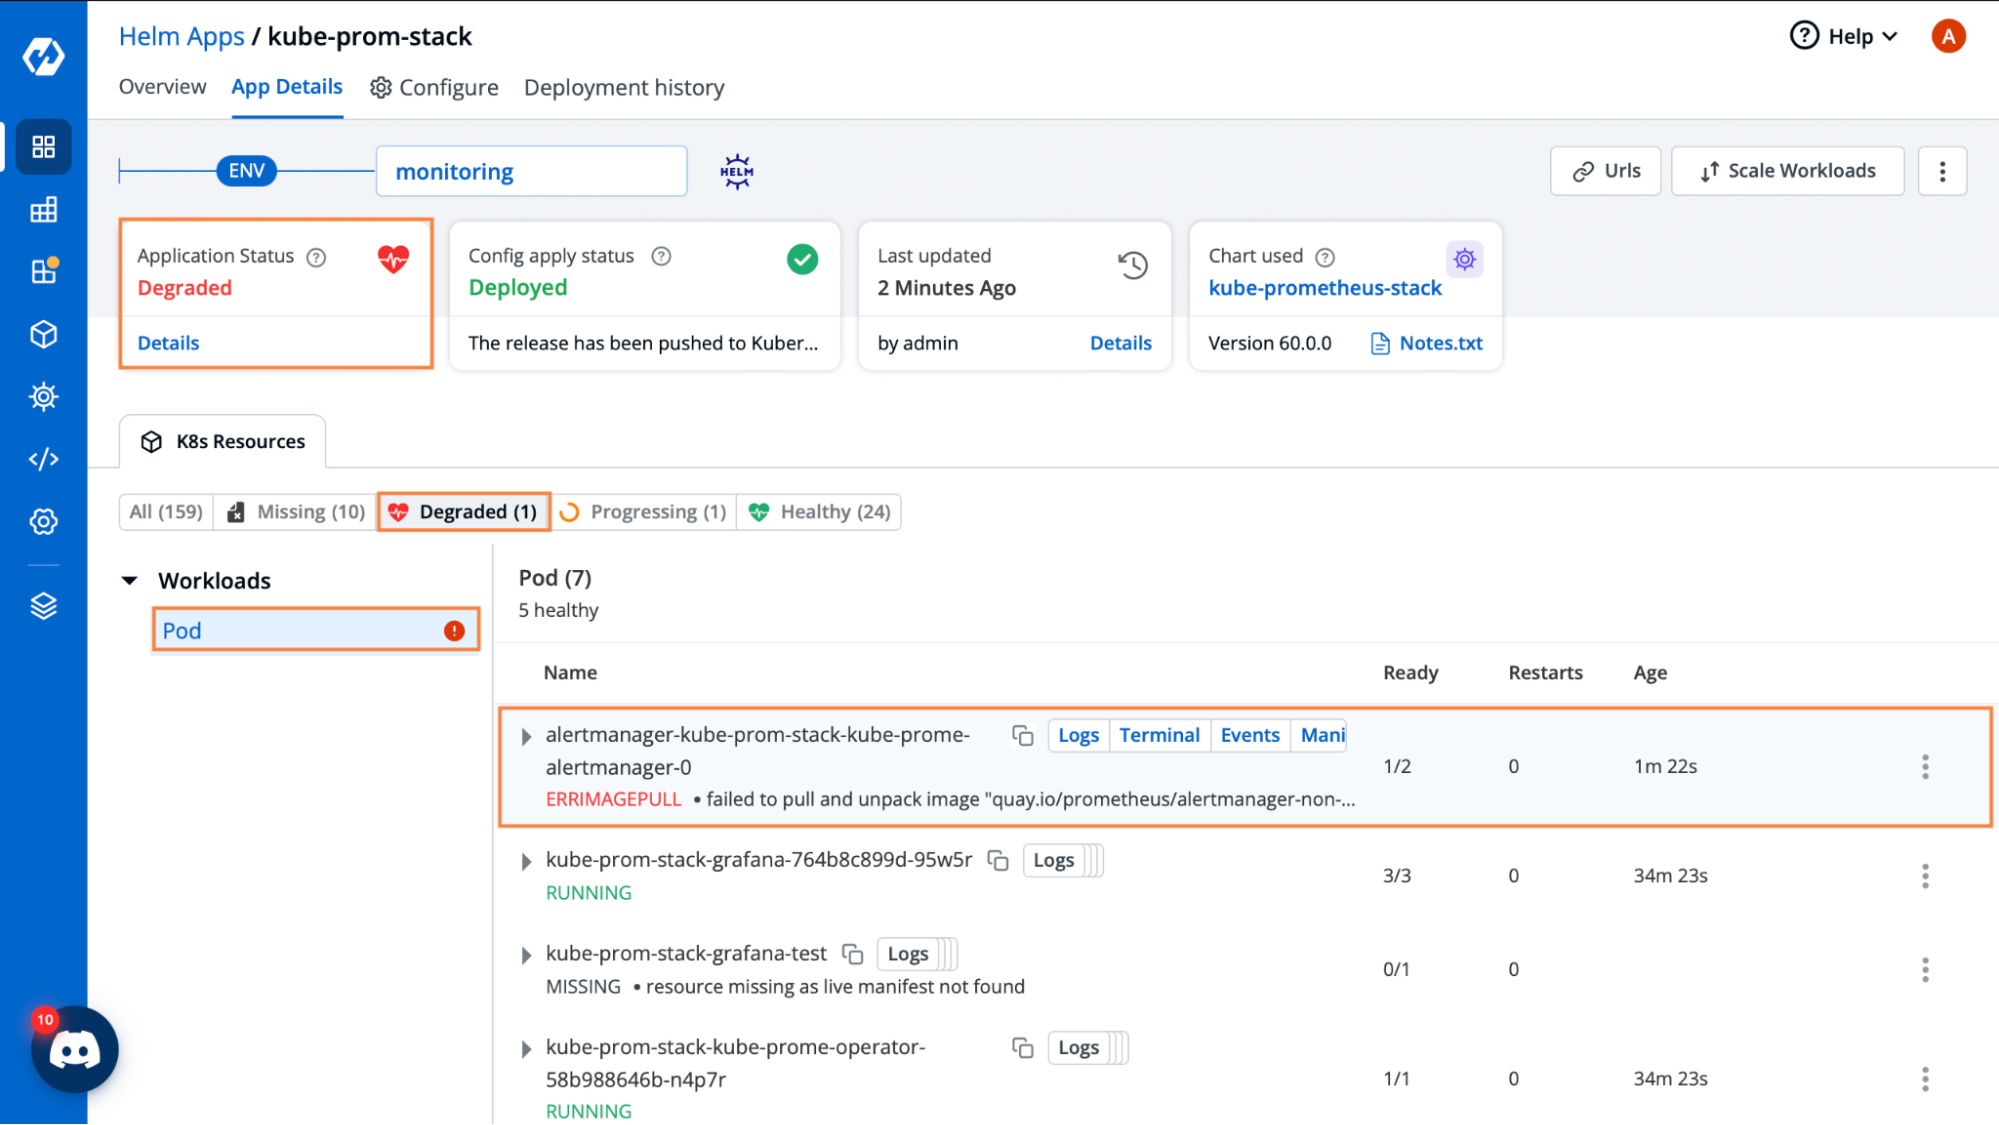
Now you can see that the application has gone into a degraded state. And Devtron is showing us exactly which resource is in a degraded state.
Here, Devtron is also showing us the reason why the pod is degraded. It shows that there is a Image pull error, which is correct since we provided a image that does not exist.
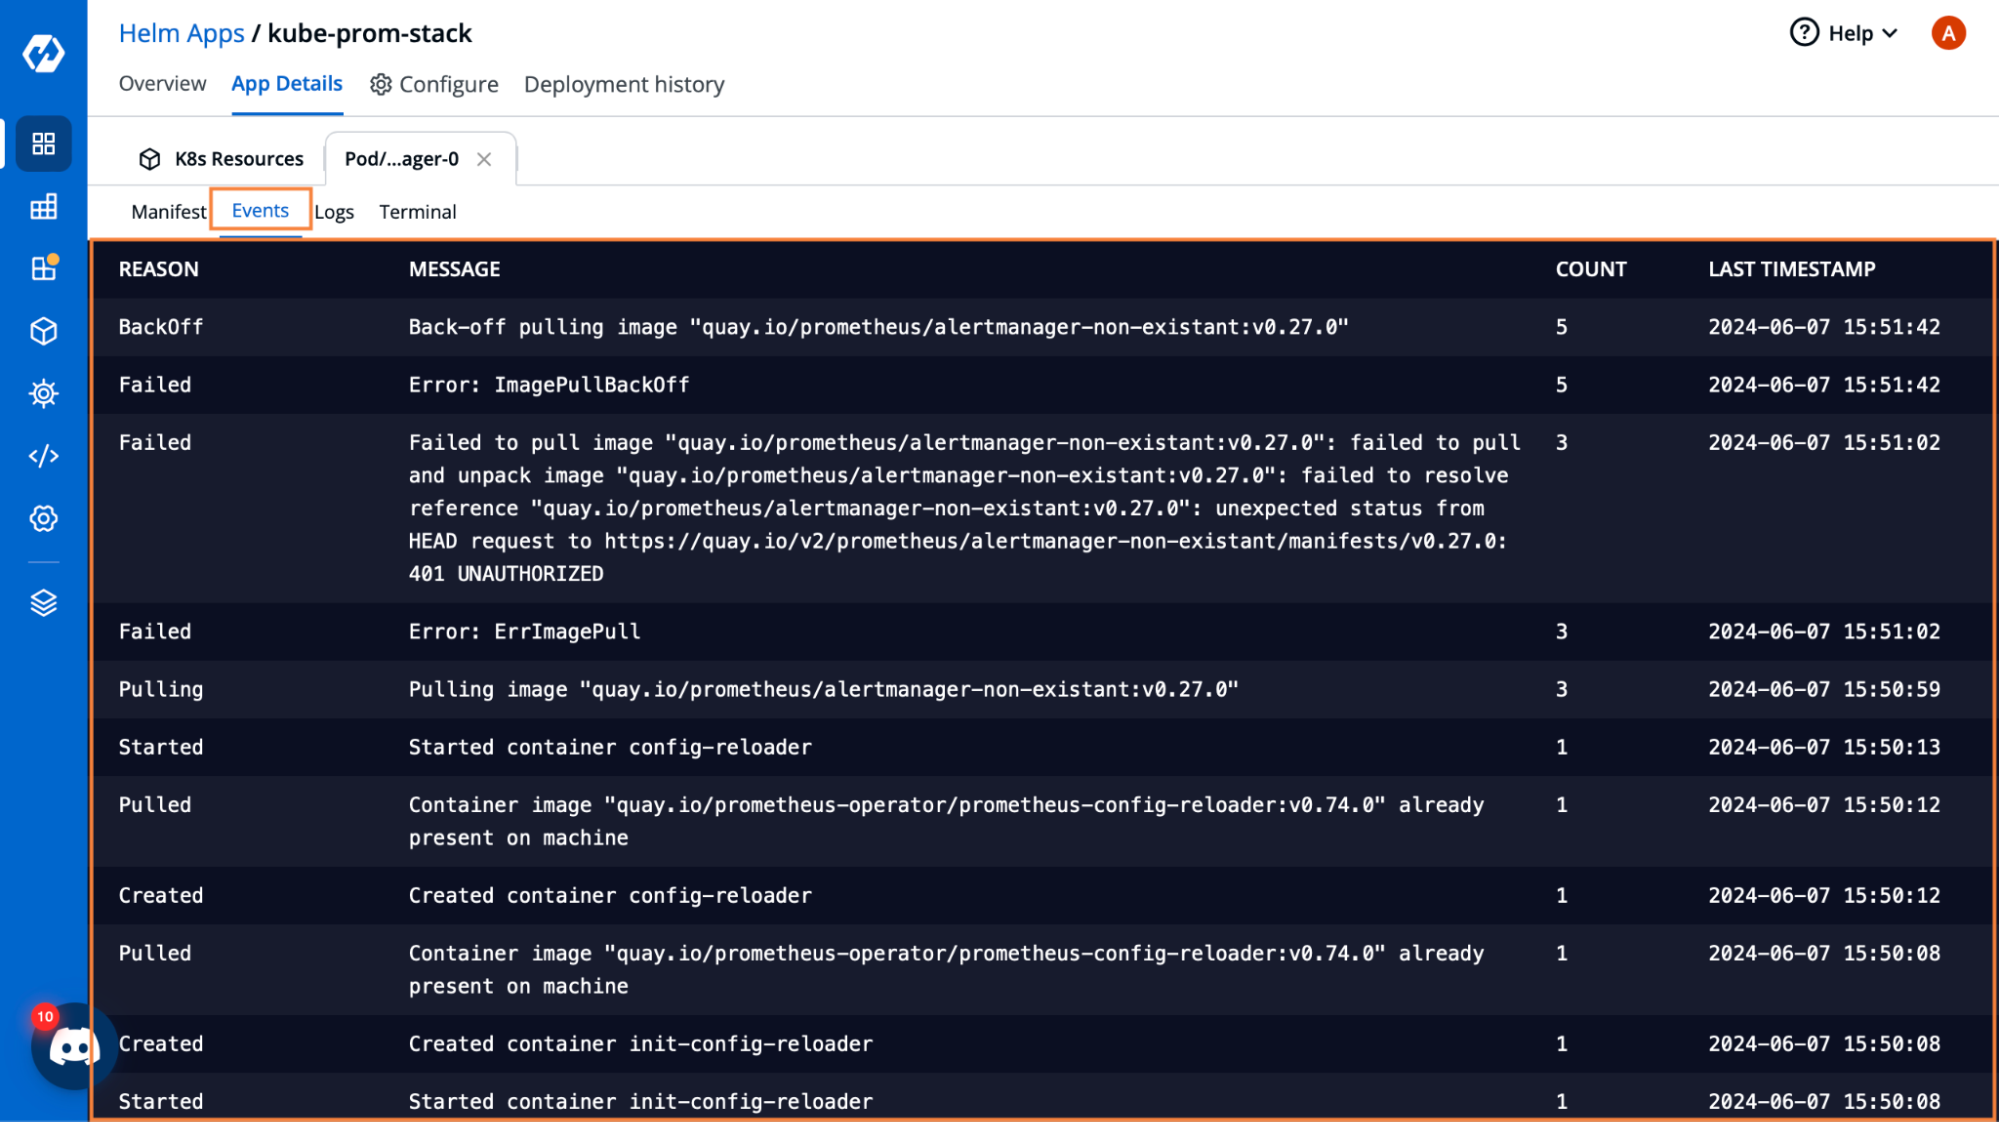
If we want more information about what’s going on with the pod, we can go into the Events and use that information to debug the application
Now let’s head back into the Configure Tab, and change the image back to the correct one. So we go ahead and change the prometheus/alertmanger-non-existant image to the proper prometheus/alertmanger and we deploy the app once again.
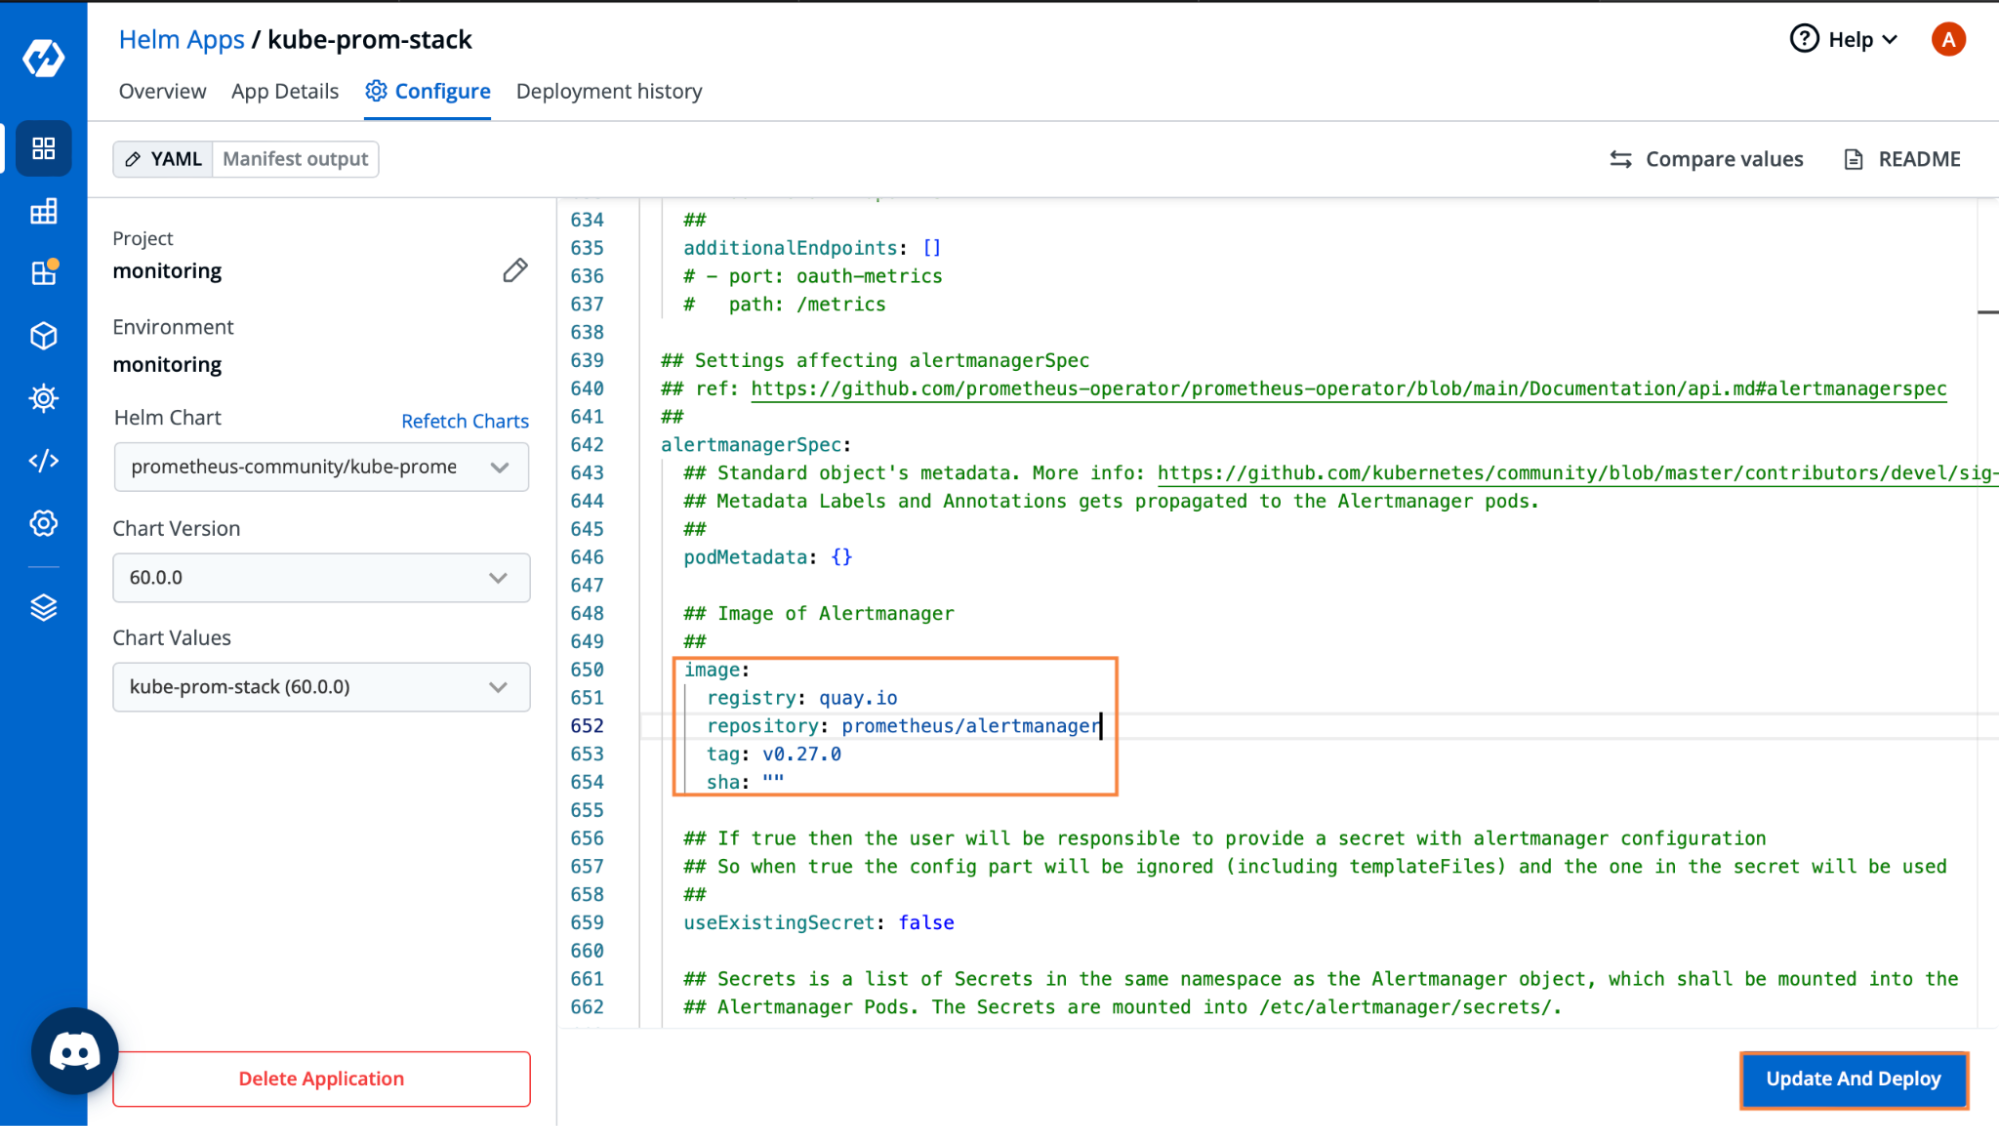
Now the app should return into a healthy state.
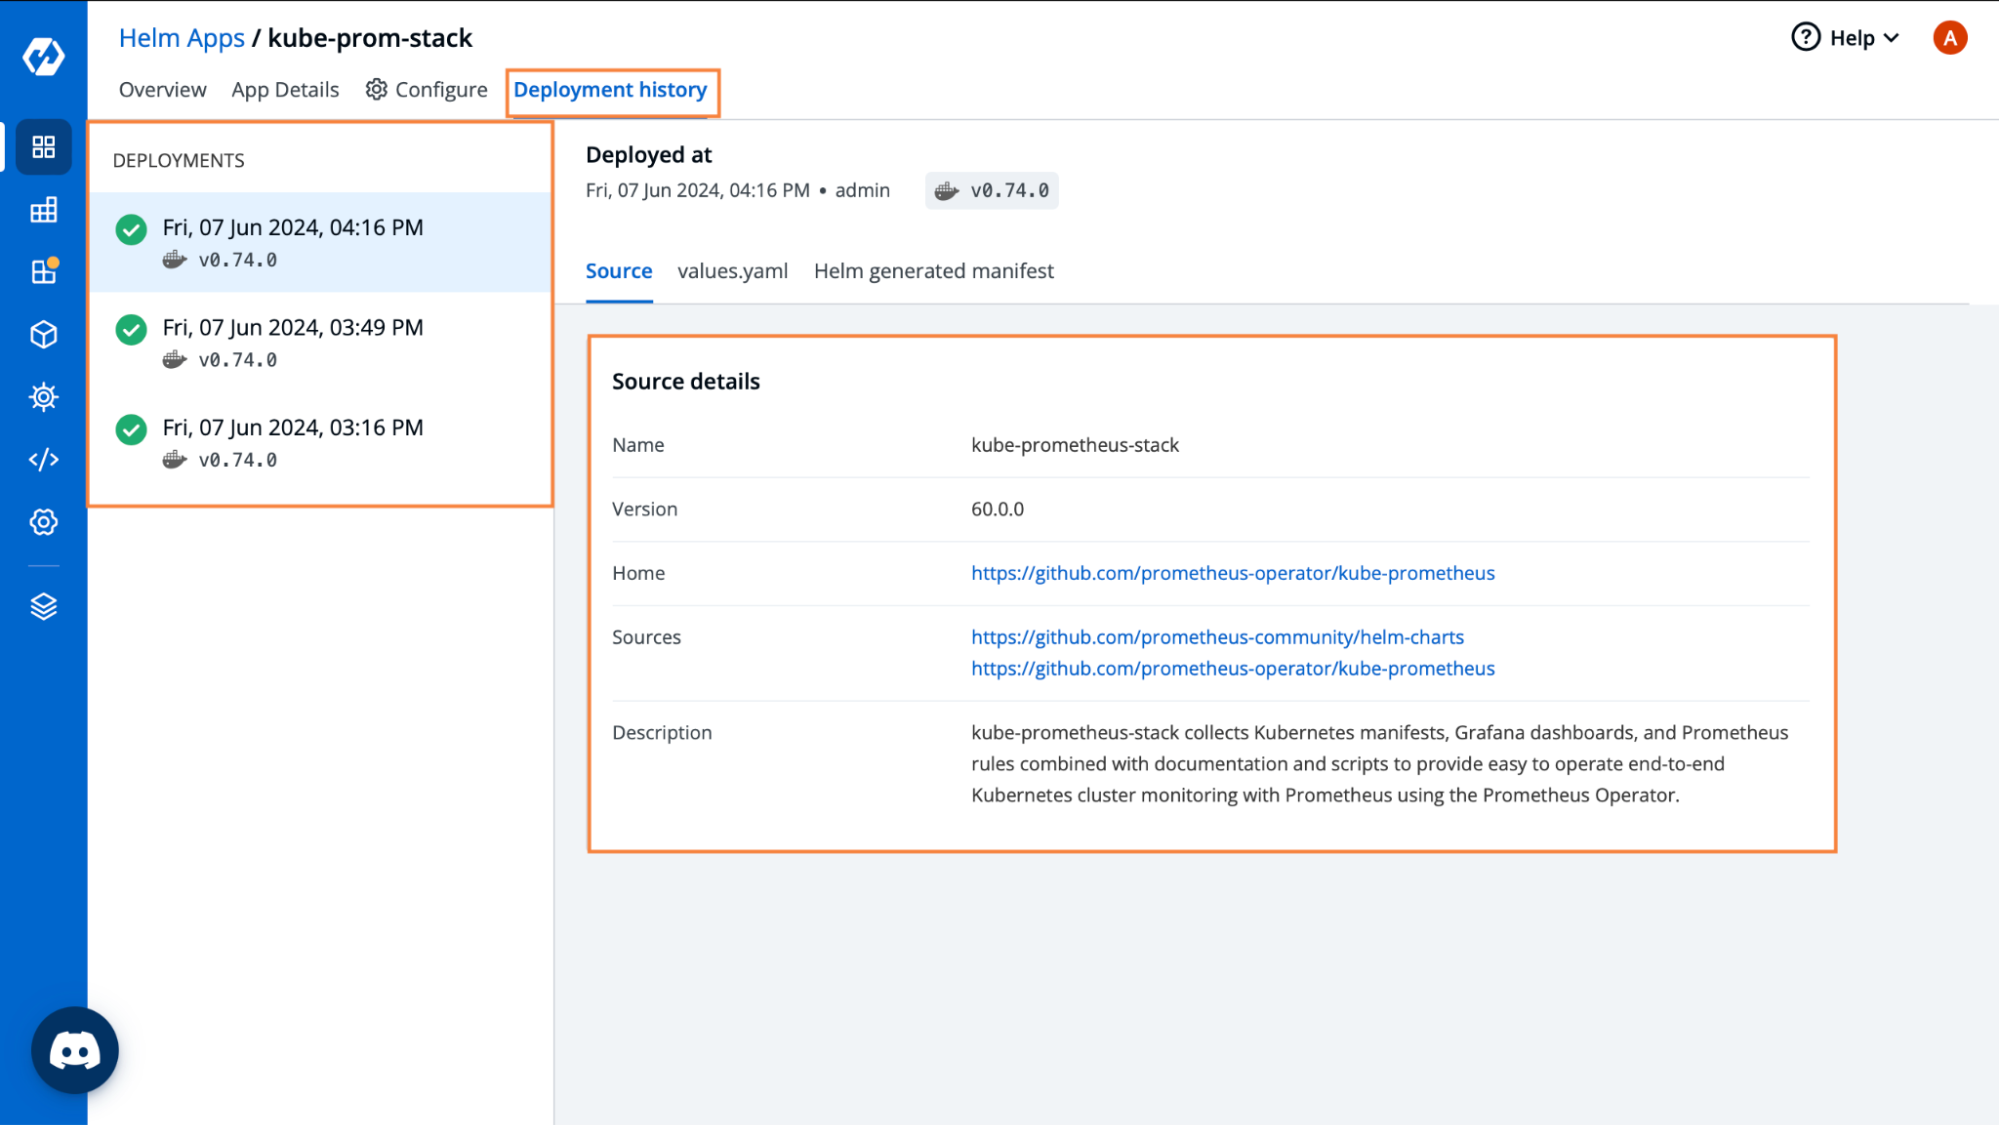
If we have had multiple deployments, and we want to see the status of all those deployments, we can do that from the Deployment History tab as well. This helps us in rolling back to a previous deployment as well, in case the latest one has had errors.
Conclusion
Within this blog, we saw some of the common issues with debugging applications that are deployed through Helm. Debugging applications through the Helm CLI is quite difficult as it does not provide a live status of all the deployed resources. Moreover, if there are missing resources, we would never know about them.
With Devtron, we can get proper insights into the status of all the Helm deployments within the cluster. It also helps in easy debugging and troubleshooting of applications with ease. It provides the application logs, as well as the live state of all the resources which makes it a breeze to find and debug the root cause of the problem.
For more information on all the different Helm capabilities that Devtron provides, please check out the official documentation.
FAQ
Why is debugging Helm applications difficult in Kubernetes?
Helm lacks real-time visibility into deployed resources. Even if critical components are missing or failing, helm status may still show the app as "deployed," making it hard to detect and troubleshoot issues accurately.
How does Devtron improve Helm debugging and application visibility?
Devtron provides live resource statuses, smart grouping of Helm workloads, and real-time logs and events for each pod. This allows developers and SREs to identify issues like missing CRDs or failed pods instantly and debug faster.
Can Devtron help with Helm deployment history and rollback?
Yes, Devtron tracks all Helm deployments and allows you to view past deployment statuses. You can roll back to a previous stable release directly from the UI if a newer deployment causes issues.
How can I view and analyze Helm pod logs in real time?
With Devtron, you can access real-time logs for individual pods and containers directly from the dashboard. The built-in Log Analyzer allows you to filter logs, view events, and quickly identify issues—something not possible with Helm CLI alone.