

Cloud cost visibility usually feels solved until the cluster count crosses double digits.
At ten namespaces, a spreadsheet and a monthly billing export are enough. At a hundred, across a handful of clusters and two or three cloud providers, that same process quietly stops working. Spend still gets reported. It just stops being useful. Finance sees a number. Engineering sees a different number. Nobody can say with confidence which team, namespace, or workload actually drove last month's bill up by 20%.
This is the gap between having a cost dashboard and having cost visibility. The first tells you what you spent. The second tells you where it went, why it changed, and what to do about it , down to the namespace and deployment. Most teams have the first. Very few have the second, and the difference shows up exactly when it matters most: during a spike, a budget review, or an audit nobody saw coming.
This blog covers why that gap opens up as Kubernetes environments scale, and then walks through, practically, how to close it using Devtron's Cost Visibility module, what to enable, what to look at first, and how to turn a dashboard into something your team actually acts on.
Why Visibility Breaks Down as Kubernetes Scales
Ownership stops being obvious. A namespace-per-team model works cleanly until services start sharing infrastructure , a common ingress controller, a shared database, a logging stack that every team's pods write to. None of that infrastructure belongs to one team, but all of it shows up on every team's node. Static tags can't keep up with that kind of shared, shifting ownership.
Clusters multiply faster than context does. Production, staging, dev, per-region clusters, sometimes a cluster per customer for regulated workloads , the number of clusters grows well past the number of people who can hold their state in their head. A cost anomaly in one cluster and an identical pattern in another look like two disconnected line items instead of the same systemic issue, because nobody has a single view across all of them.
Reports describe the invoice, not the deployment. A billing export tells you the spend went up. It doesn't tell you a canary release tripled replica count, or that an HPA config change scaled a namespace to production-grade capacity by accident. By the time a monthly report flags the anomaly, the deployment that caused it is old news.
None of these are new problems , they're the same recurring ones we've written about in The Hidden Cost of Kubernetes and Cost Optimization Strategies in Kubernetes. What changes at scale isn't the type of waste , it's whether anyone can actually see it in time to act.
What Cost Visibility Actually Needs to Show
The problems covered in previous blogs revolve around allocation drift, cluster fragmentation, and cost data arriving disconnected from deployments all coming down to one thing: a dashboard that shows a number isn't the same as a system that shows the answer.
Useful Kubernetes cost visibility has to answer three specific questions, each solved by a different capability and measured against different parameters.
1. Where did the cost go? - Attribution that survives shared infrastructure
The problem: account-level or cluster-level totals can't explain shared ingress controllers, multi-tenant nodes, or platform components no single team owns. A number without a path back to a workload is unusable the moment ownership isn't obvious.
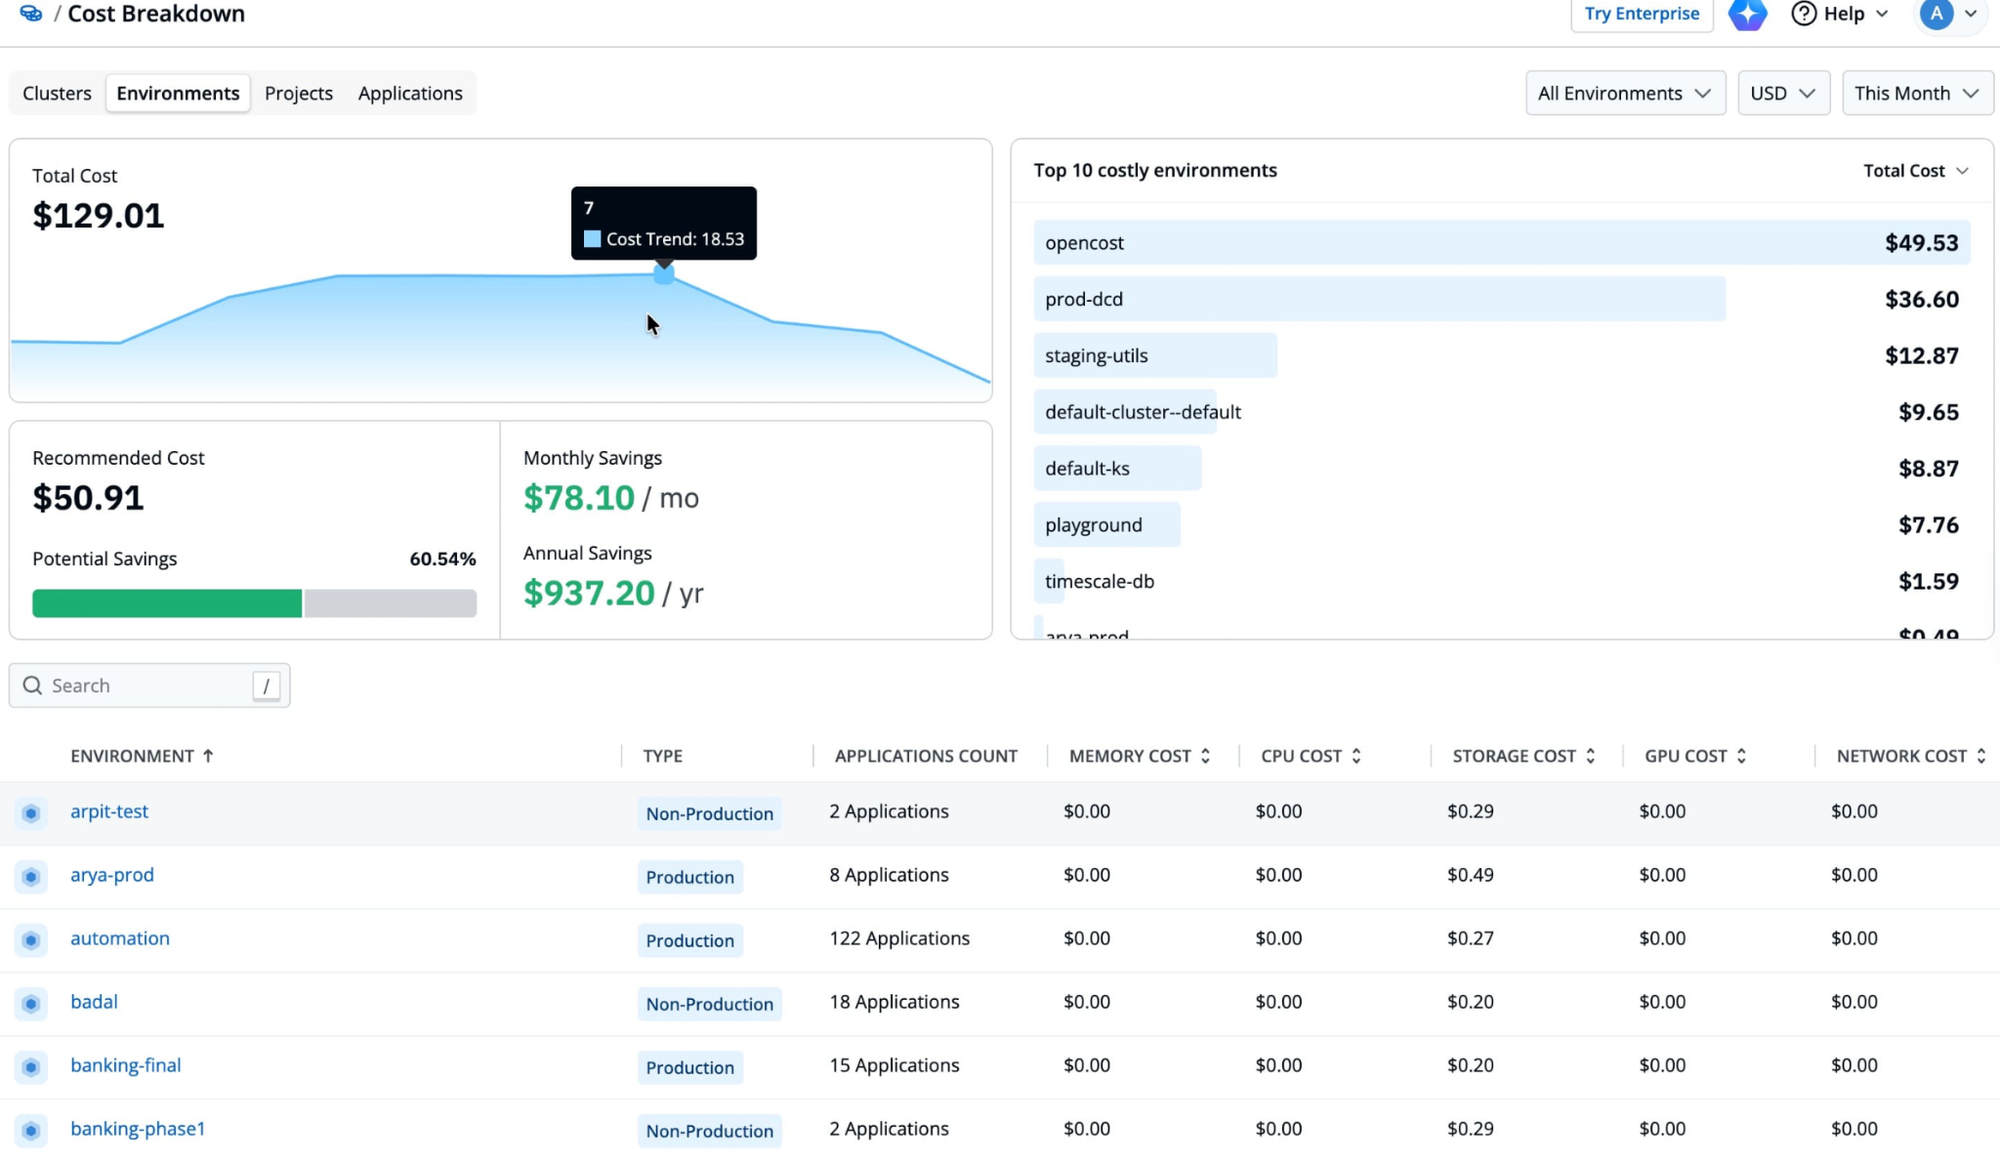
How it's solved: cost has to be traceable through a full hierarchy, not stopped at the top, cloud account down to cluster, namespace, application, and finally the individual deployment. This is exactly how Devtron's Cost Breakdown module works - pick a category (Cluster, Application, Environment, Project), see its Total Cost and Top 10 costliest resources, then click into any one of them to go a level deeper top costly namespaces, then applications, then deployments until the number lands on something a single team can act on.
Parameters tracked at each layer: Total Cost, Recommended Cost, Potential Savings, and Estimated Cost Reduction (%) all computed independently at every level of the hierarchy, not just once at the top. Check below :
2. What resource is driving it?
“ Breaking total cost apart by CPU, memory, GPU, and storage ”
The problem: a workload can look expensive as a single number while the actual waste sits in one resource type. Flagging "this app costs $2,000/month" doesn't tell anyone what to fix; flagging "this app requests 4 GiB of memory and uses 1 GiB" does.
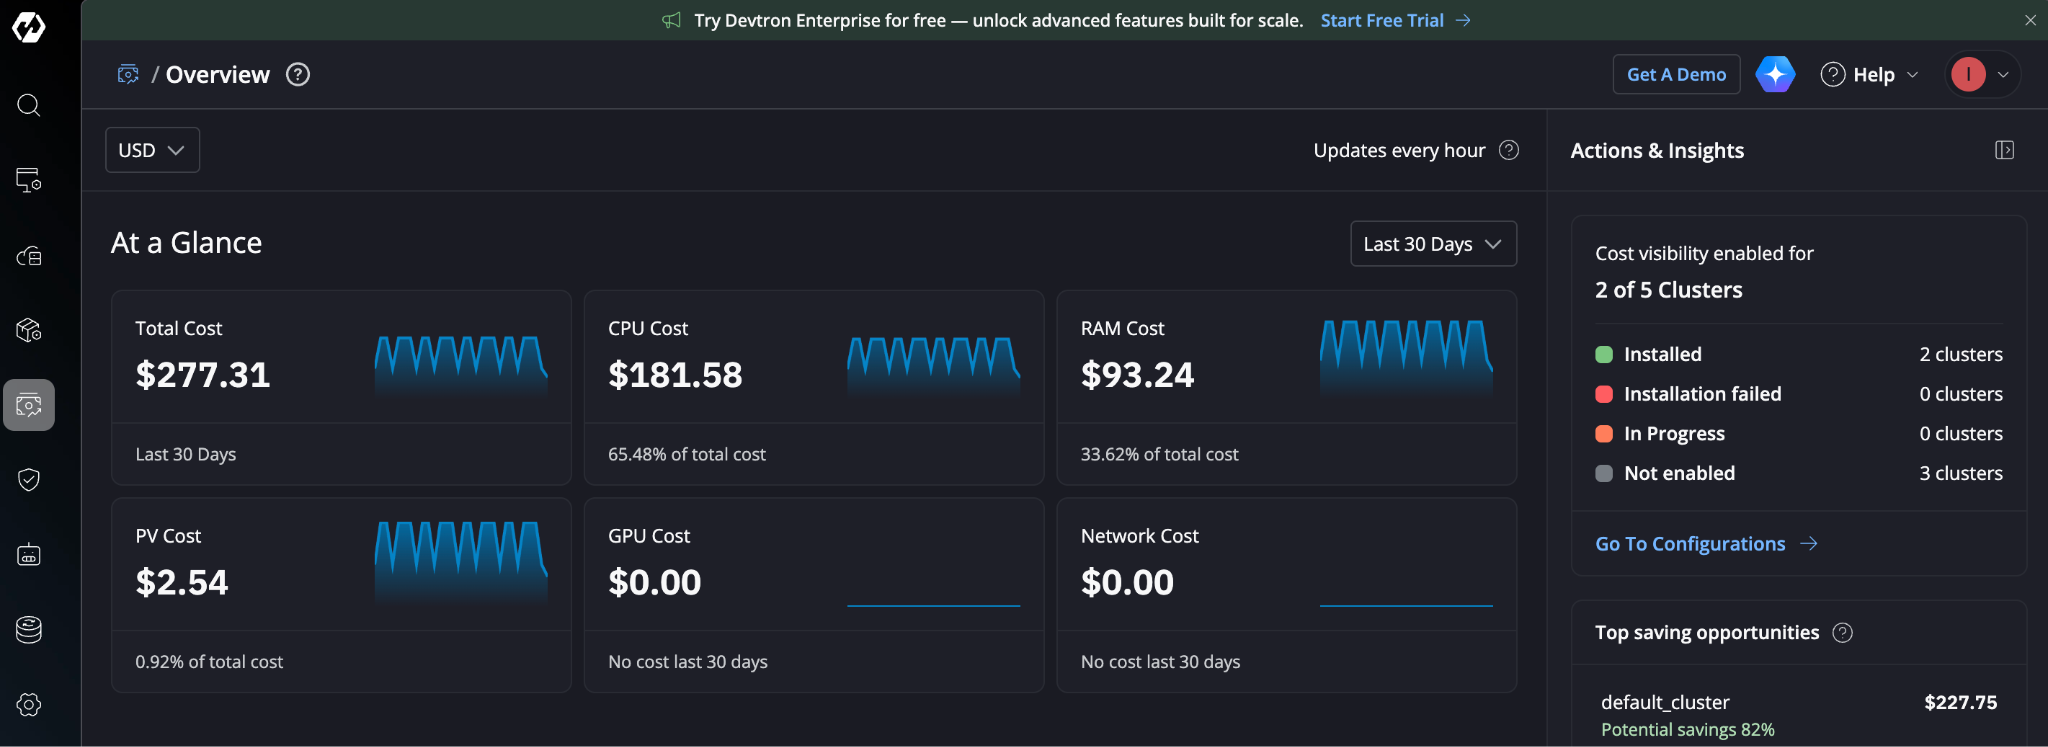
How it's solved: every cost view in Devtron is broken into four separate cost components — CPU, RAM, Storage (PV), and GPU and each with its own trend graph and its own Recommended Cost calculated from actual Prometheus-collected usage, not allocated capacity. That separation is what turns "how much does this cost" into "what are we reserving, what are we using, and what's the gap costing."
Parameters tracked: requested vs. actual usage, and Potential Savings, calculated independently per resource type so a workload can be right-sized on CPU while still flagged as wasteful on memory. Check the parameters below :
3. What changed?
Tying cost movement to a deployment event, not just a date
The problem: a billing export shows that spend moved. It never shows why a replica count change, a new deployment, an HPA reconfiguration, or storage growth all look identical from the invoice alone. Without that context, fixing the spike is guesswork.
How it's solved: because Devtron already owns the cluster state and deployment history, a spend spike surfaced through Track Performance or Actions & Insights can be cross-referenced against the same time window in your deployment history , instead of cost living in a separate tool that has no idea a release even happened.
Parameters tracked: cost trend over a selected time range (24h / 7d / 30d / 90d), correlated against deployment timestamps, resource request diffs, and scaling events for the same window.
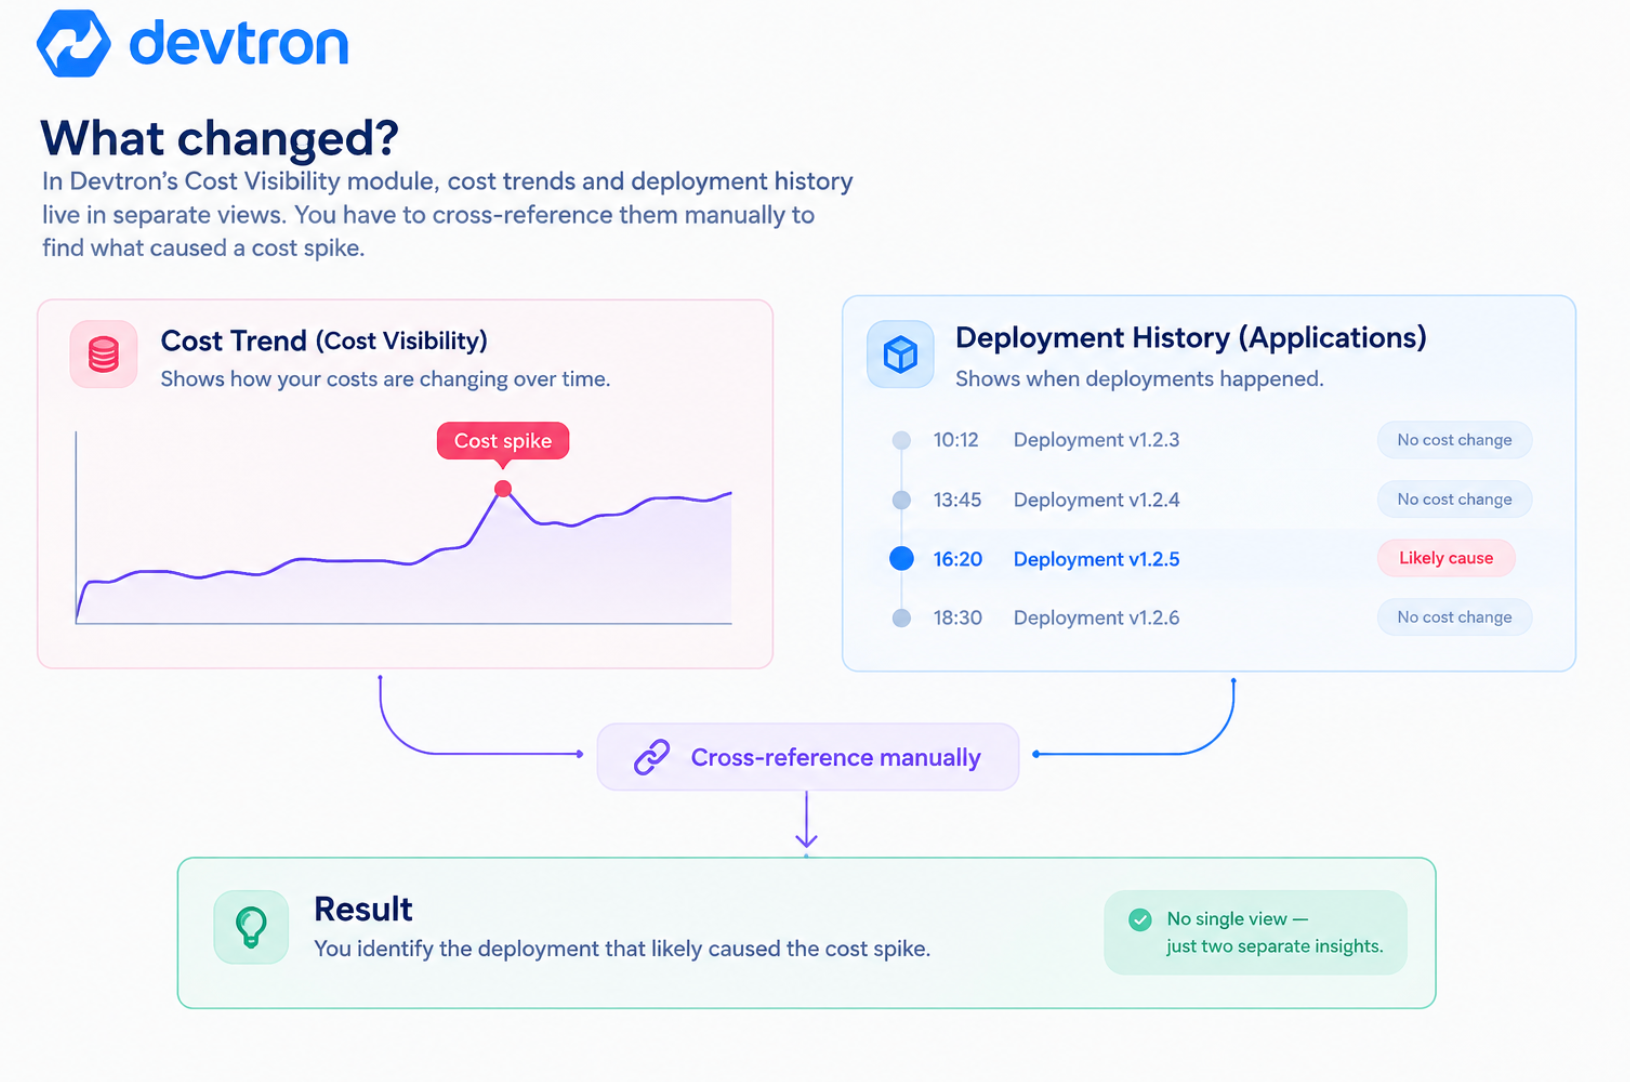
Put together, here's a summary table given below for a simple diagnostic loop for any Kubernetes cost increase and how each one maps to what Devtron actually tracks.
Knowing what needs to be visible is only the first step , the next challenge is turning that visibility into a practical process for identifying and fixing the underlying cost problem.
What Fixing This Actually Requires
Three things have to be true for cost visibility to survive scale:
- Cost has to be usage-based, not tag-based - Tags drift. Actual CPU, memory, storage, and GPU consumption doesn't.
- Cost has to be attributable at every layer - cluster, namespace, application, deployment , not just at the top line.
- Cost has to live next to the infrastructure it describes, so a spike can be traced to a specific resource, not just a specific dollar amount.
Attribution depth only works if the hierarchy is modeled, not just divided. Splitting a cluster's total cost evenly across its namespaces is arithmetic, not attribution, it produces a number for every namespace but doesn't reflect what any of them actually consumed. Real attribution means each layer cluster, namespace, application, deployment is calculated independently from its own usage data, so the numbers still add up correctly even when infrastructure is shared unevenly across teams.
Proximity to infrastructure only works if the cost engine and the deployment platform are the same system. Bolting a FinOps dashboard onto a separate CD tool means cost data and deploy history live in different places and have to be reconciled by a person, after the fact. There's no shortcut around that except not separating them in the first place.
Why This Works Better Inside the Delivery Platform
Most cost visibility tools sit outside the systems that actually generate the cost. They pull billing exports, reconcile them against tags or labels, and surface a dashboard often after the spend has already occurred. That lag is structural, not a bug - a tool that only sees the invoice has no way to know that a deployment happened three hours ago or that a configuration change altered resource consumption.
A delivery platform already has the context behind those costs. It knows what was deployed, where it was deployed, which application and environment it belongs to, what resources were requested, and how workloads have changed over time. Bringing cost visibility into that context means teams can investigate a cost increase alongside the deployments, configurations, and infrastructure responsible for it, rather than stitching together information from separate systems.
This connection matters because many cost problems begin as workload or infrastructure changes and only become visible later on the bill. For example:
- Replica growth - a workload scales from 10 to 30 replicas.
- Resource over-provisioning - requests are significantly higher than actual usage.
- Configuration changes - an HPA or resource setting changes how workloads scale.
- New deployments - additional workloads increase the infrastructure footprint.
- Idle environments - development or staging resources continue running without meaningful usage.
The goal isn't to replace cloud billing systems or turn a delivery platform into a financial reporting tool. It's to make the cost part of the same operational workflow used to build, deploy, and manage workloads.
A practical walkthrough for setting up Cost visibility with Devtron helps to connect this approach with Kubernetes by connecting cost data with the clusters, applications, environments, and deployments managed through the platform helping teams move from seeing what they spent to understanding why it changed and what they can do about it.
Turning Visibility Into a Habit
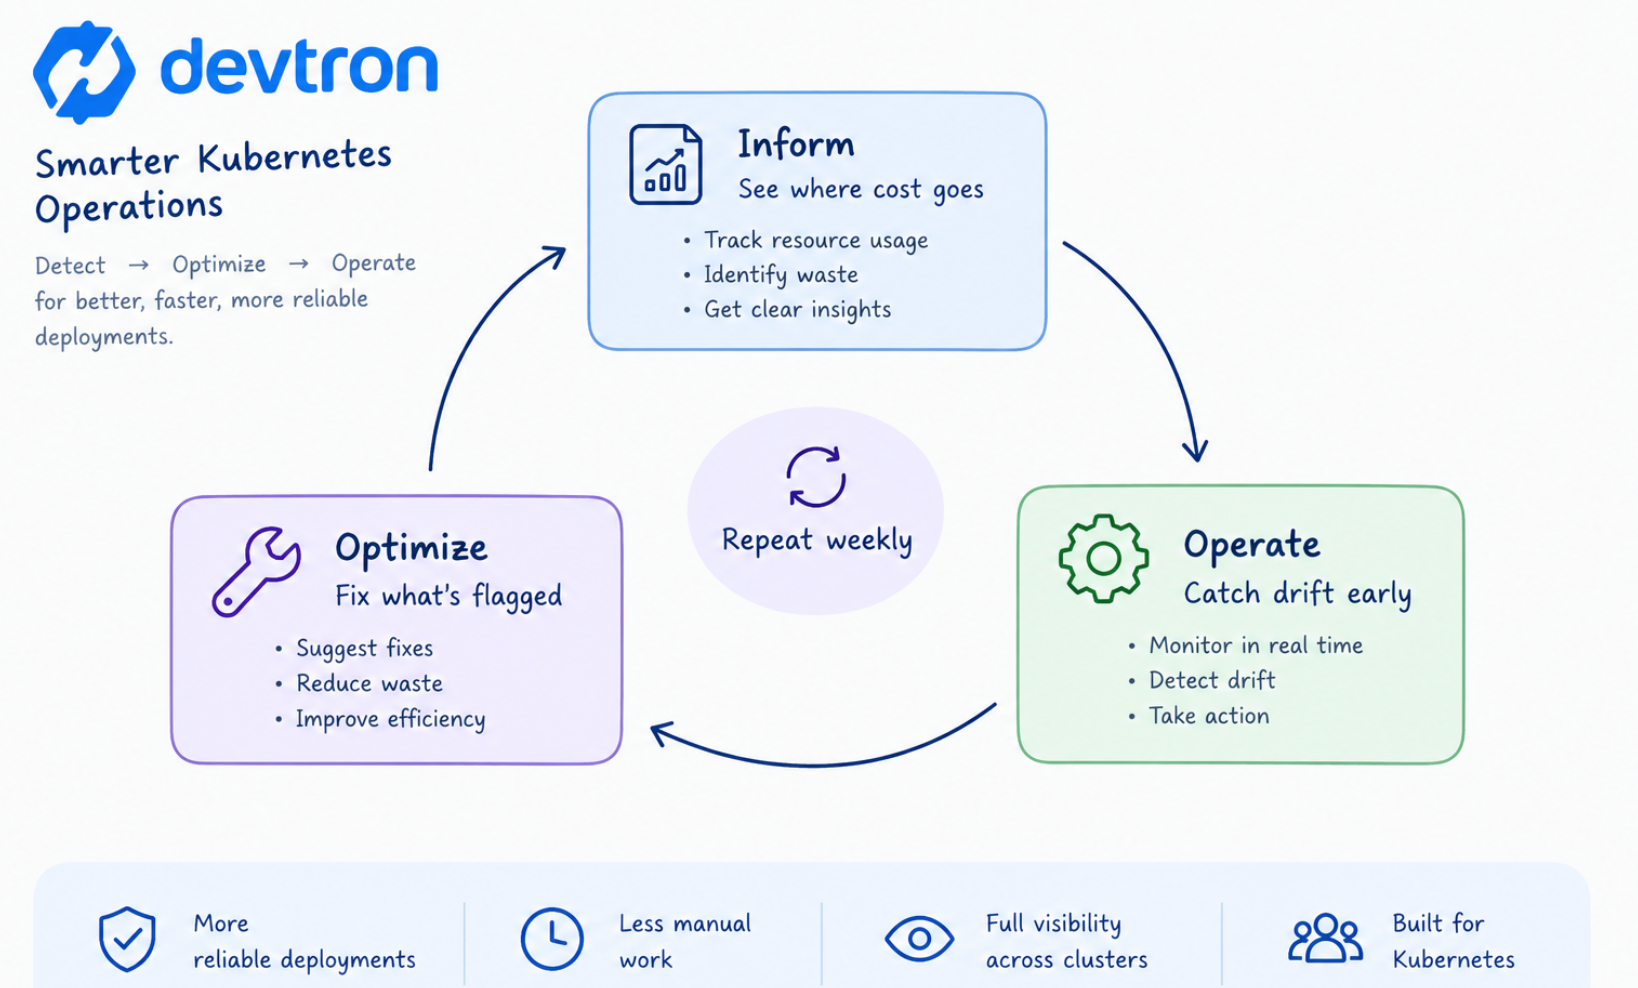
The Inform | Optimize | Operate Loop
Everything covered so far - attribution, resource-level breakdown, deployment context, platform-native speed solves the visibility half of the problem. It doesn't automatically solve the habit half. A team can have perfect cost data and still let it go stale if nobody has a repeatable process for acting on it.
The FinOps Foundation's widely adopted model for this is a three-phase loop: Inform, Optimize, and Operate, which brings cost attribution, governance, and accountability into the delivery workflow so that every deployment carries a cost signal and every team owns their spend. Mapped onto what's already in the Cost Visibility module:
- Inform - is the Overview and Cost Breakdown work already described usage-based attribution down to the deployment, refreshed hourly, so everyone is looking at the same numbers instead of arguing about whose spreadsheet is right.
- Optimize - is acting on Potential Savings and the Recommended Cost figures adjusting requests/limits on the specific workloads flagged, rather than an org-wide guess. Kubernetes FinOps teams typically wait 60–90 days after rightsizing before making longer-term capacity commitments, so those commitments reflect actual need rather than inflated requests.
- Operate - a standing cadence either weekly, ideally or where someone actually opens Actions & Insights, checks the top saving opportunities, and confirms last week's fixes actually moved the Potential Savings number down. This is also where budgets and alerts belong, so a namespace trending toward a limit gets flagged before it crosses one, not after.
Conclusion
A useful cost visibility process turns a cost increase into an investigation: identify where the cost changed, trace it to the workload, determine which resource is driving it, understand whether the change was intentional, and then take the appropriate action
If you're currently relying on monthly billing exports or a general-purpose cloud cost tool that stops at the cluster level, this is a reasonable next step to actually try rather than read about:
- Explore the docs: Devtron Cost Visibility documentation walks through configuration, overview, and cost breakdown in detail..
- Try it yourself: Start free with Devtron plan including the full FinOps and Cost Visibility module on your connected clusters.
Cost visibility that only exists at month-end isn't visibility, it's a postmortem. The teams that actually control Kubernetes spend are the ones who can trace a dollar back to a deployment in minutes, not weeks.