In this blog we are going to discuss about the 4 major challenges with Helm and also how we can deal with these challenges. But before coming directly to the challenges, let's talk a bit about helm and helm charts in short.
What is Helm and Helm Chart?
Helm is a command line utility for managing Kubernetes applications. It is a package manager which makes it easier to deploy applications on Kubernetes. As you already know, your application has multiple Kubernetes resources. To deploy them, you would need to apply multiple manifest files for the pods, services, configmaps, storage, etc.
A Helm Chart is a collection of all these manifest files that describe a related set of Kubernetes resources. With a single chart, you can run an application with bare minimum configs to something very complex. For example, a complete full-stack web app, or a monitoring stack consisting of 10+ different tools, each with your unique configuration methods inside the Kubernetes cluster. Helm charts help you define, install, and upgrade even the most complex Kubernetes application with ease, and hence reduce a lot of the cognitive burden and save time as well.
Helm Charts simplifies Kubernetes application deployment, but once deployed the debugging a broken release is difficult. eliminates the guesswork in debugging, and your work becomes significantly easier. With Devtron, you can quickly diagnose issues and repair them in a timely way.
Challenges with Helm
No doubt that Helm is a very popular tool to manage deployments on Kubernetes. Helm helps us to install, and upgrade applications using a single command, i.e helm install <chart-repo>/<chart-name>. Without Helm, this would be done by creating and applying numerous Kubernetes yaml files. But still, certain challenges with Helm need to be addressed. Within this article, let’s look at the top 4 challenges with managing your applications using Helm.
No actual state of deployments
Helm introduces an abstraction layer between Kubernetes and the users. It does not observe the actual state of the resources it deploys into the cluster and results in unclear status of the deployments. Let’s try and understand this point with the help of an example.
Imagine you deploy a application using a Helm chart. You’ve added the helm repository, and used the correct helm install command, and the application has deployed successfully.. Now you go and check status of the deployment using helm status. This will show the application status as deployed . Everything is great till now. Now delete one of the resources that was created by helm. After doing this, your application will probably go in an unhealthy state, or be completely deleted since one of the essential resources such as a configmap or a secret has been deleted. Now, if you run a helm status again, it will still shows the status as deployed.
Even though we know that in reality something has gone wrong. Helm is not able to identify the live status of resources deployed. Once the application is deployed, helm's work is done. Now imagine something like this happens within your production environments. You’d spend hours trying to figure out what’s gone wrong. This would have been a much easier debugging process if you had some visibility into what Helm has deployed, and what’s the status of those particular resources.
Troubleshooting and debugging
Helm was designed to reduce the complexity associated with deploying Kubernetes applications. However, when we talk about troubleshooting and debugging the deployed application resources, this complexity still exists. If we look at how Helm works, it involved writing a bunch of different templates, which we call as Helm Charts. Here’s an example Helm chart.
apiVersion: apps/v1
kind: Deployment
metadata:
  name: {{ .Values.name }}
  namespace: {{ default .Release.Namespace .Values.namespace }}
  labels:
    app: {{ .Values.name }}
    version: {{ .Values.image.tag }}
    env: {{ .Values.env }}
spec:
  replicas: {{ .Values.replicaCount }}
  selector:
    matchLabels:
      app: {{ .Values.name }}
      env: {{ .Values.env }}
  template:
    metadata:
      labels:
        app: {{ .Values.name }}
        version: {{ .Values.image.tag }}
        env: {{ .Values.env }}
    spec:
      containers:
        - name: {{ .Chart.Name }}
          image: "khaosdoctor/zaqar:{{ .Values.image.tag }}"
          imagePullPolicy: {{ .Values.image.pullPolicy }}
          env:
            - name: SENDGRID_APIKEY
              value: {{ required "You must set a valid Sendgrid API key" .Values.environment.SENDGRID_APIKEY | quote }}
            - name: DEFAULT_FROM_ADDRESS
              value: {{ required "You must set a default from address" .Values.environment.DEFAULT_FROM_ADDRESS | quote }}
            - name: DEFAULT_FROM_NAME
              value: {{ required "You must set a default from name" .Values.environment.DEFAULT_FROM_NAME | quote }}
          ports:
            - name: http
              containerPort: 3000
              protocol: TCP
          resources:
            {{- toYaml .Values.resources | nindent 12 }}
As you can see, it looks very similar to a normal Kubernetes manifest file. The key difference is, that instead of hardcoding all the required values, we are passing in some placeholders as the manifest template. Now imagine you’re creating these kinds of files for about 50+ Kubernetes resources which are required for running your application. It’s going to make deployments a breeze. But when it comes to troubleshooting, it’s a different story. If you’ve ever debugged a simple Kubernetes application, you know how complicated it can get. Now imagine having to do this for an application with over 50 interlinked resources.
Moreover, you don’t have access to the raw YAML file. This makes it even more difficult to restart or reconfigure and reapply just that one particular Kubernetes resource
If you want to learn about all the challenges that come with debugging Helm applications, we’ve created an entire guide on troubleshooting and debugging for Helm apps.
No UI for Helm applications
As a SRE/DevOps, you might not feel that need to have a UI for managing your applications. A terminal is often your best friend for everything you need to do within your cluster. However, the story changes a lot when you work at scale. Imagine that you have 100+ charts deployed which have created even more Kubernetes resources. Viewing these resources, and seeing checking their configurations is extremely tedious. And even more so when the applications are spread out across multiple namespaces.
Managing these using a GUI is much easier than a CLI. Therefore, managing and monitoring Helm charts using the Helm CLI or even by using kubectl becomes a tedious task and also very confusing if you are new in the Kubernetes space. At each step of managing helm packages, you have to fire the helm commands which sometimes becomes a real mess. Just imagine, how convenient it would be to have a UI to manage all the helm charts you’ve already deployed using the Helm CLI. It’ll also make it easier to deploy new charts through the UI and get the live status of all those deployed applications.
No Grouping of Charts
One of the more complex challenges that we face in an actual production environment is having to deploy a lot of different helm charts, which each have their own distinct set of configurations. The Helm CLI doesn’t let you group multiple charts, and deploy it with a single command. You manually need to find and add every single helm repository, and then install the correct packages while making sure you’re passing in the correct configuration file for it.
Let’s try to understand this better with the help of an example. Imagine you have a e-commerce application ready for deployment. However, to run that app properly, there are multiple sub-components required. For installing those sub-components you’ll use Helm charts. So for example, these sub-components could include a PostgreSQL instance, a Kafka broker, and a monitoring stack including Prometheus, Grafana, Jaeger, and Kibana. Imagine having to configure and deploy these sub-components every time you want to deploy a new version of your e-commerce application.
Moreover, chances are that you’d want to reuse that monitoring stack with the same configurations for all your other applications. It would be very convenient if Helm allowed us to group all these resources with their specific configurations and we could deploy it using just a single click or a single command.
What's the solution?
Devtron! Devtron is a lightweight, open-source, easy-to-use web-based tool for developers as well as infrastructure teams. It helps you in solving all the challenges described above and many more use cases apart from these. All in all, it’s an extremely versatile tool that can be useful for all your Kubernetes-related pains. Let’s take a look at how Devtron solves all of the challenges that we’ve highlighted above.
(i) Shows live status of deployment
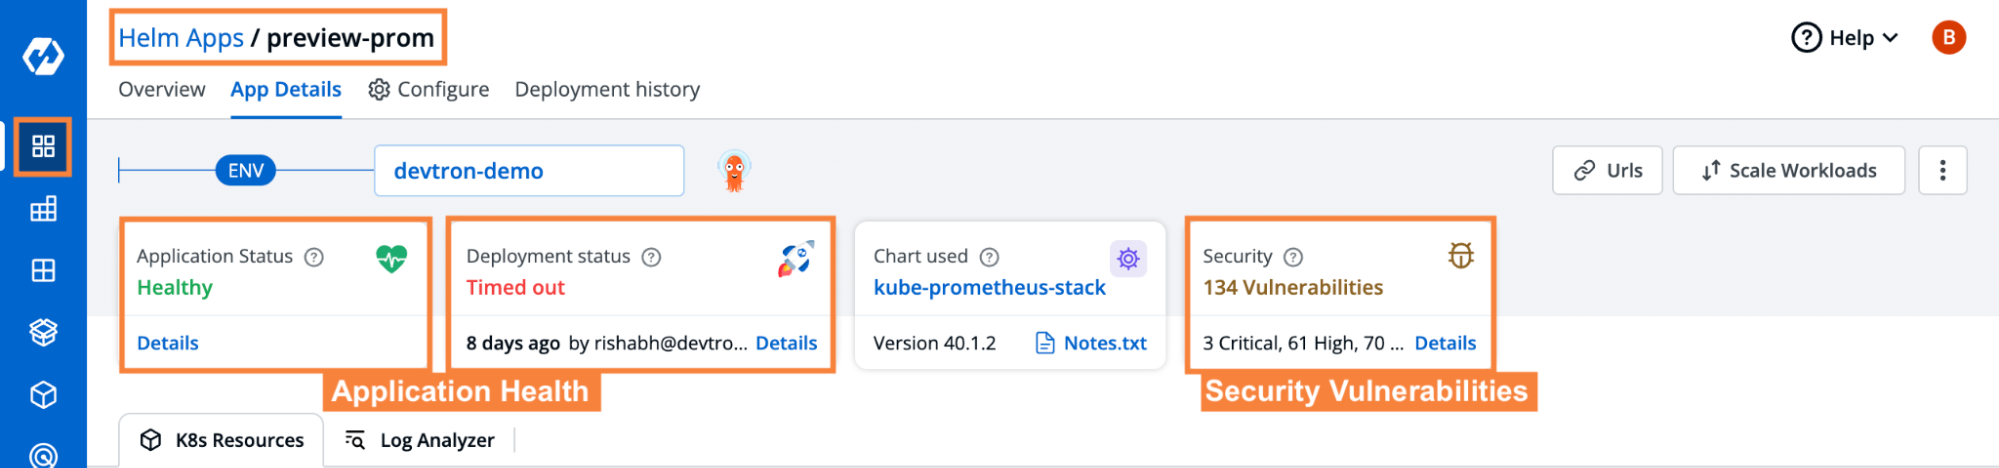
Devtron does everything that you cannot do using Helm CLI. As we discussed above Helm CLI doesn't show the actual state of the deployment. Even if the pods are not running, Helm CLI considers the deployment healthy. But this doesn't happen in the case of Devtron. It keeps on monitoring the state of all the resources in real time.
If everything is running fine then it shows the status as Healthy otherwise it shows degraded or Missing which means some of the required resources are failing or missing. Moreover, you can expand the status to check the reasons behind the status Degraded or Missing which can help you to troubleshoot the deployment.
(ii) Troubleshooting and debugging
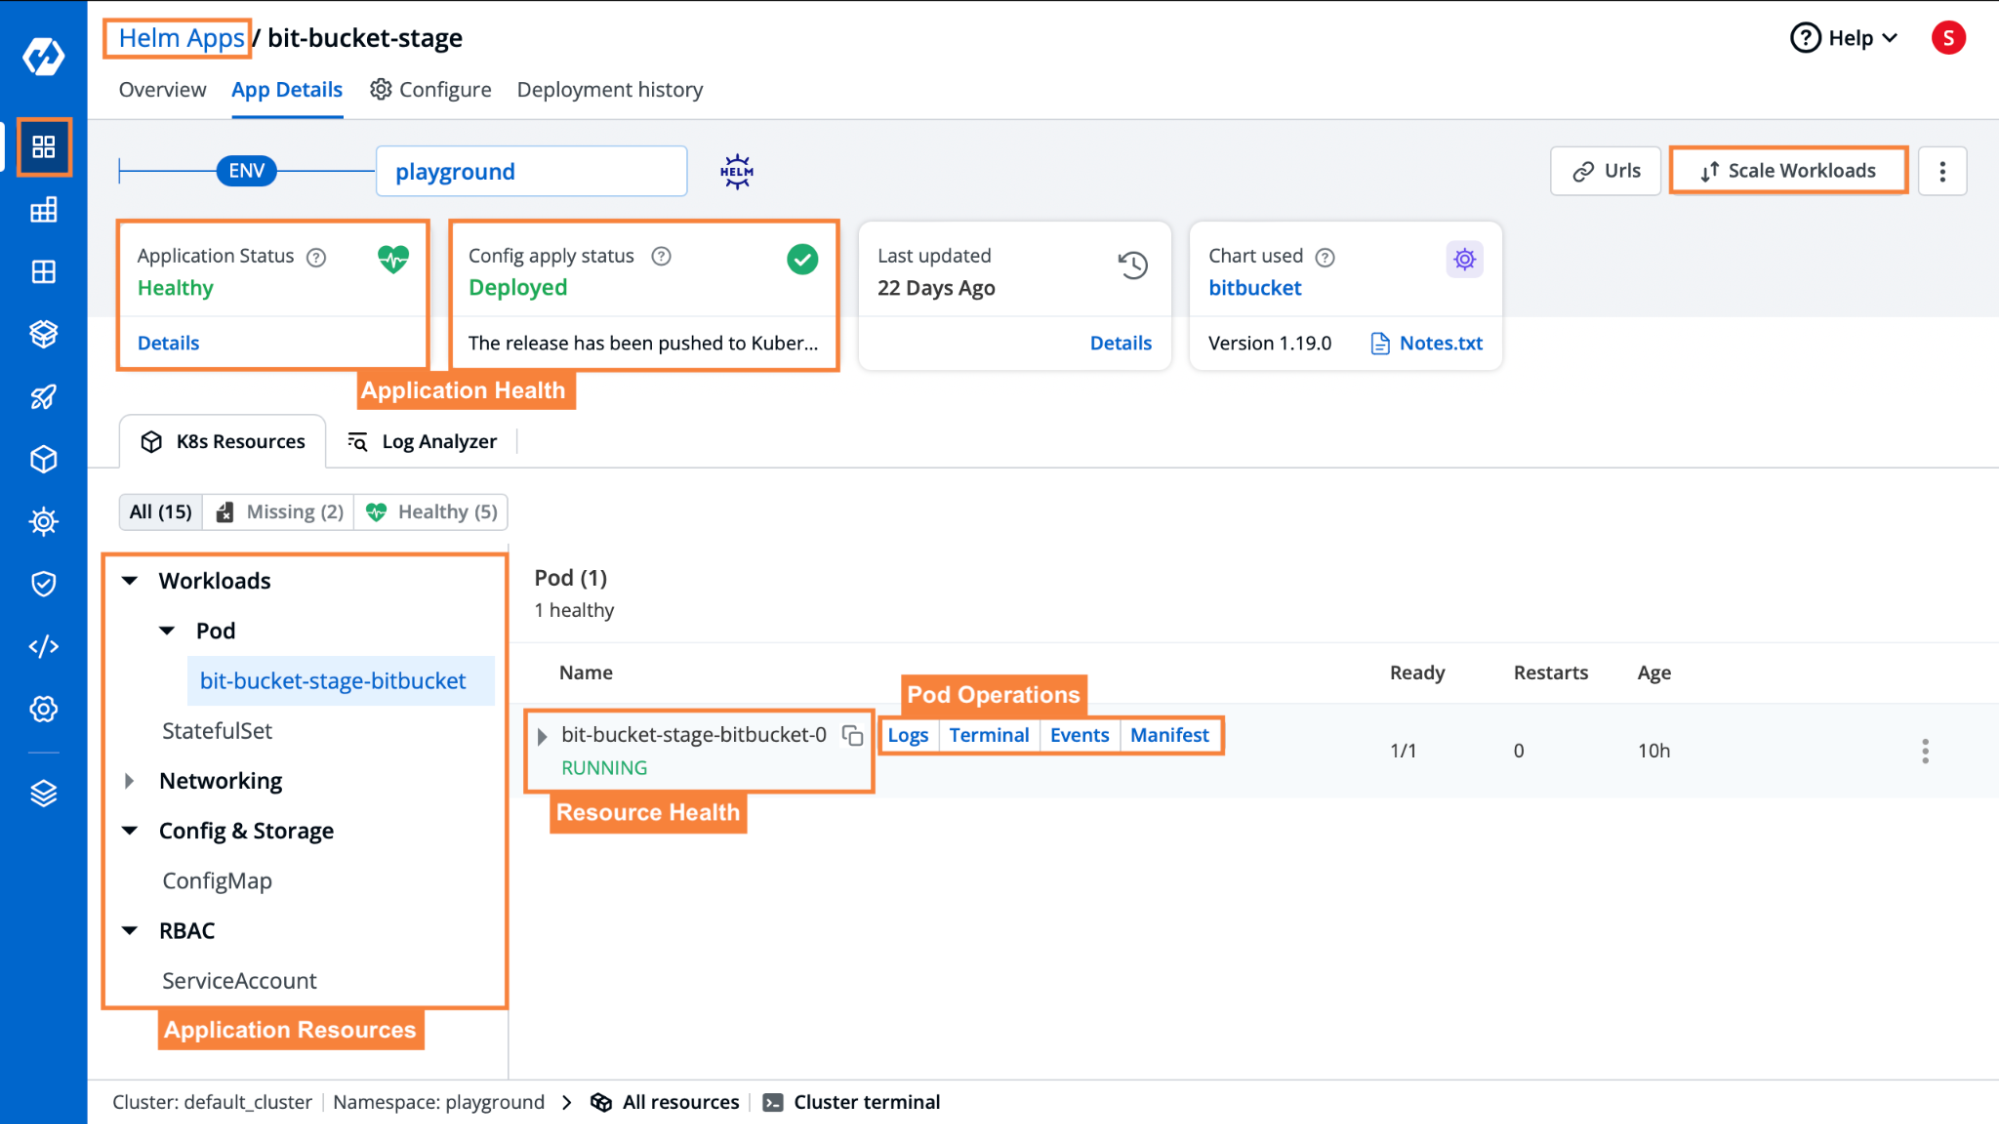
Devtron provides you with resources grouping of all the workloads deployed by the charts which makes it a lot easier for development and infra teams to troubleshoot & debug. As you can see in the image below, for all the workloads you get to look into its manifest, events, and logs as well and you can log in to the terminal too, and all these from the UI itself. This makes life much easier even if you have 1000s of charts deployed.
(iii) Provides UI to manage Helm applications
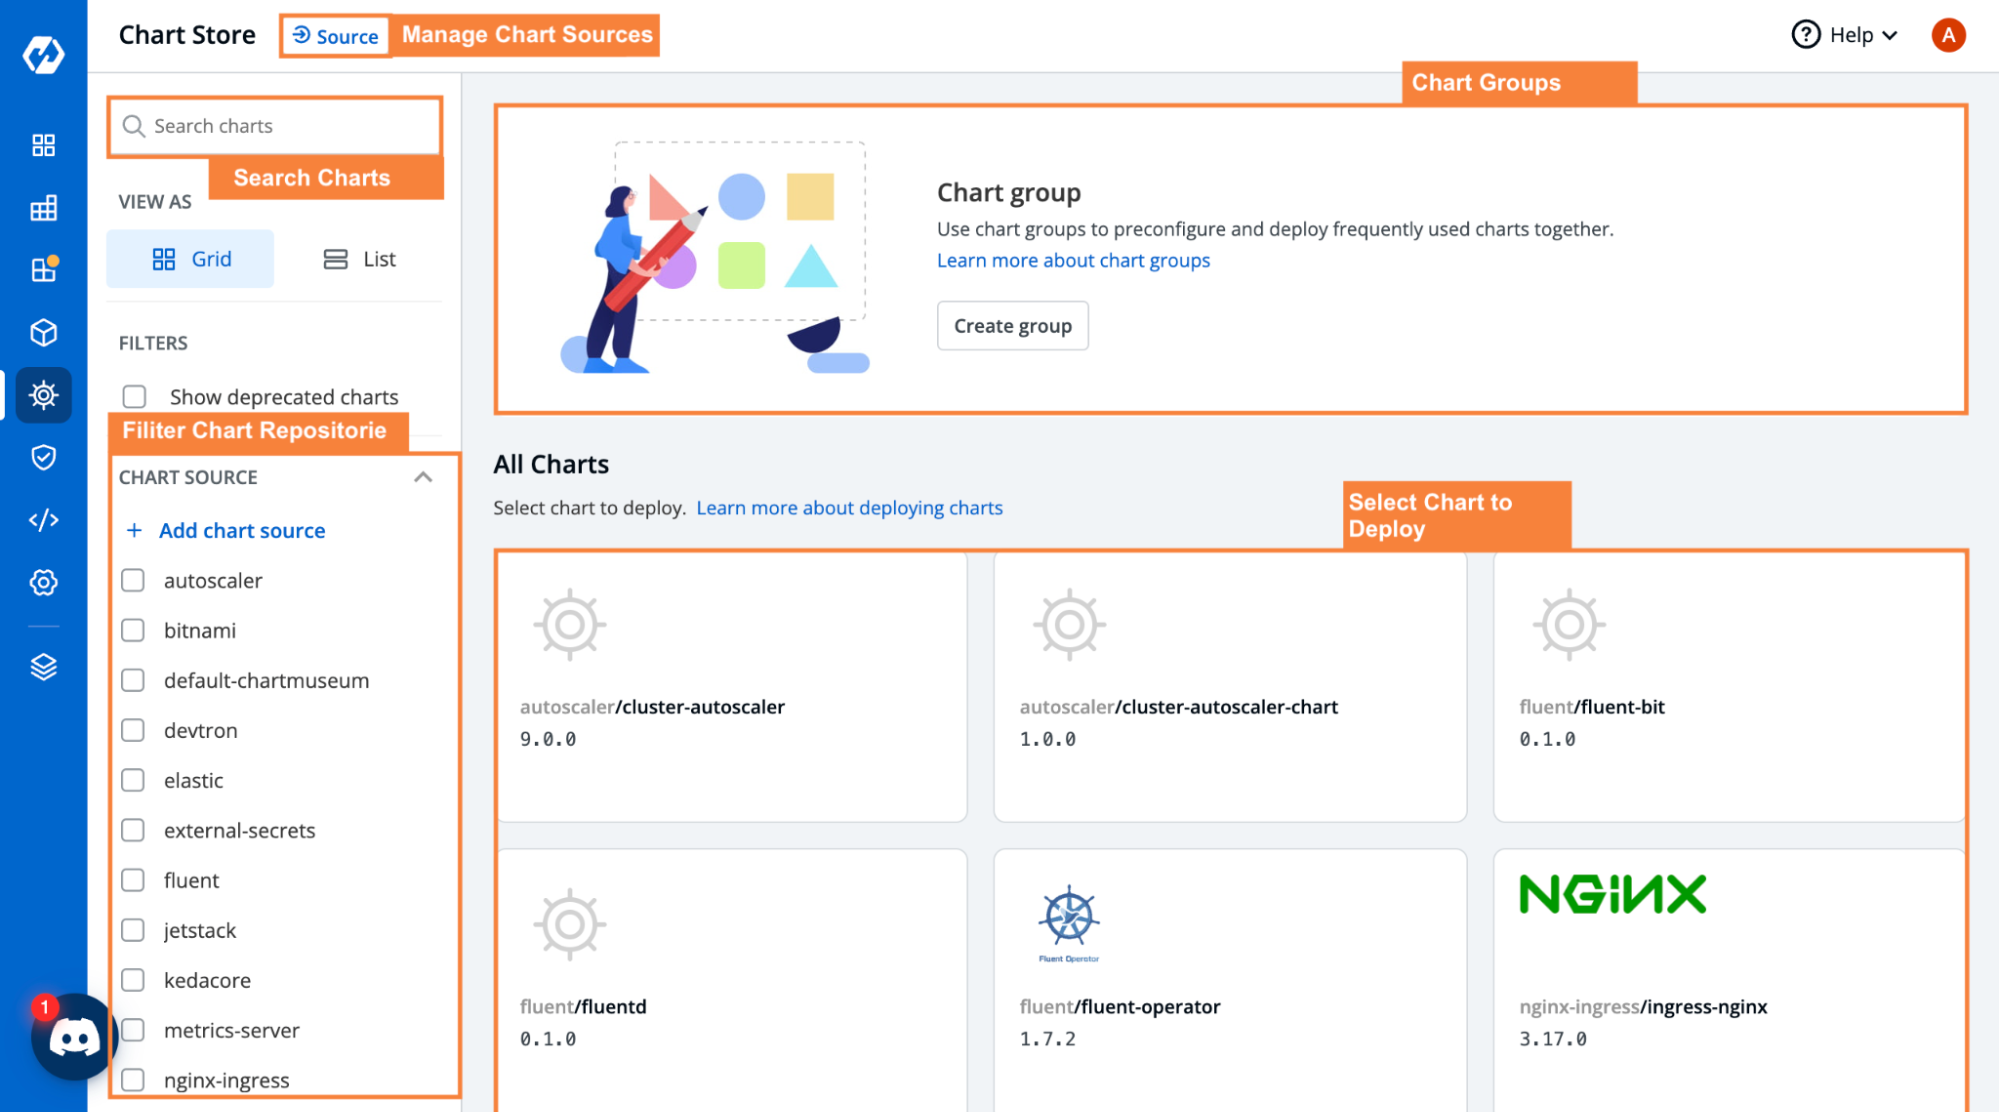
As we discussed above, Helm does not provide a user interface to manage the Helm applications but this is not in the case of Devtron. All the operations associated with the Helm applications that can be done by using the Helm CLI commands can be performed more conveniently with the Devtron dashboard. We can add a helm repository, can list all the charts present in the repository, and also can deploy the chart with a single click. To get all the charts, go-to charts store and you can see all the charts present as shown in the image below. Any existing helm chart repository can be added from Global Configurations > Chart Repositories > Add Repository. For more details please have a look at our documentation on Global Configurations.
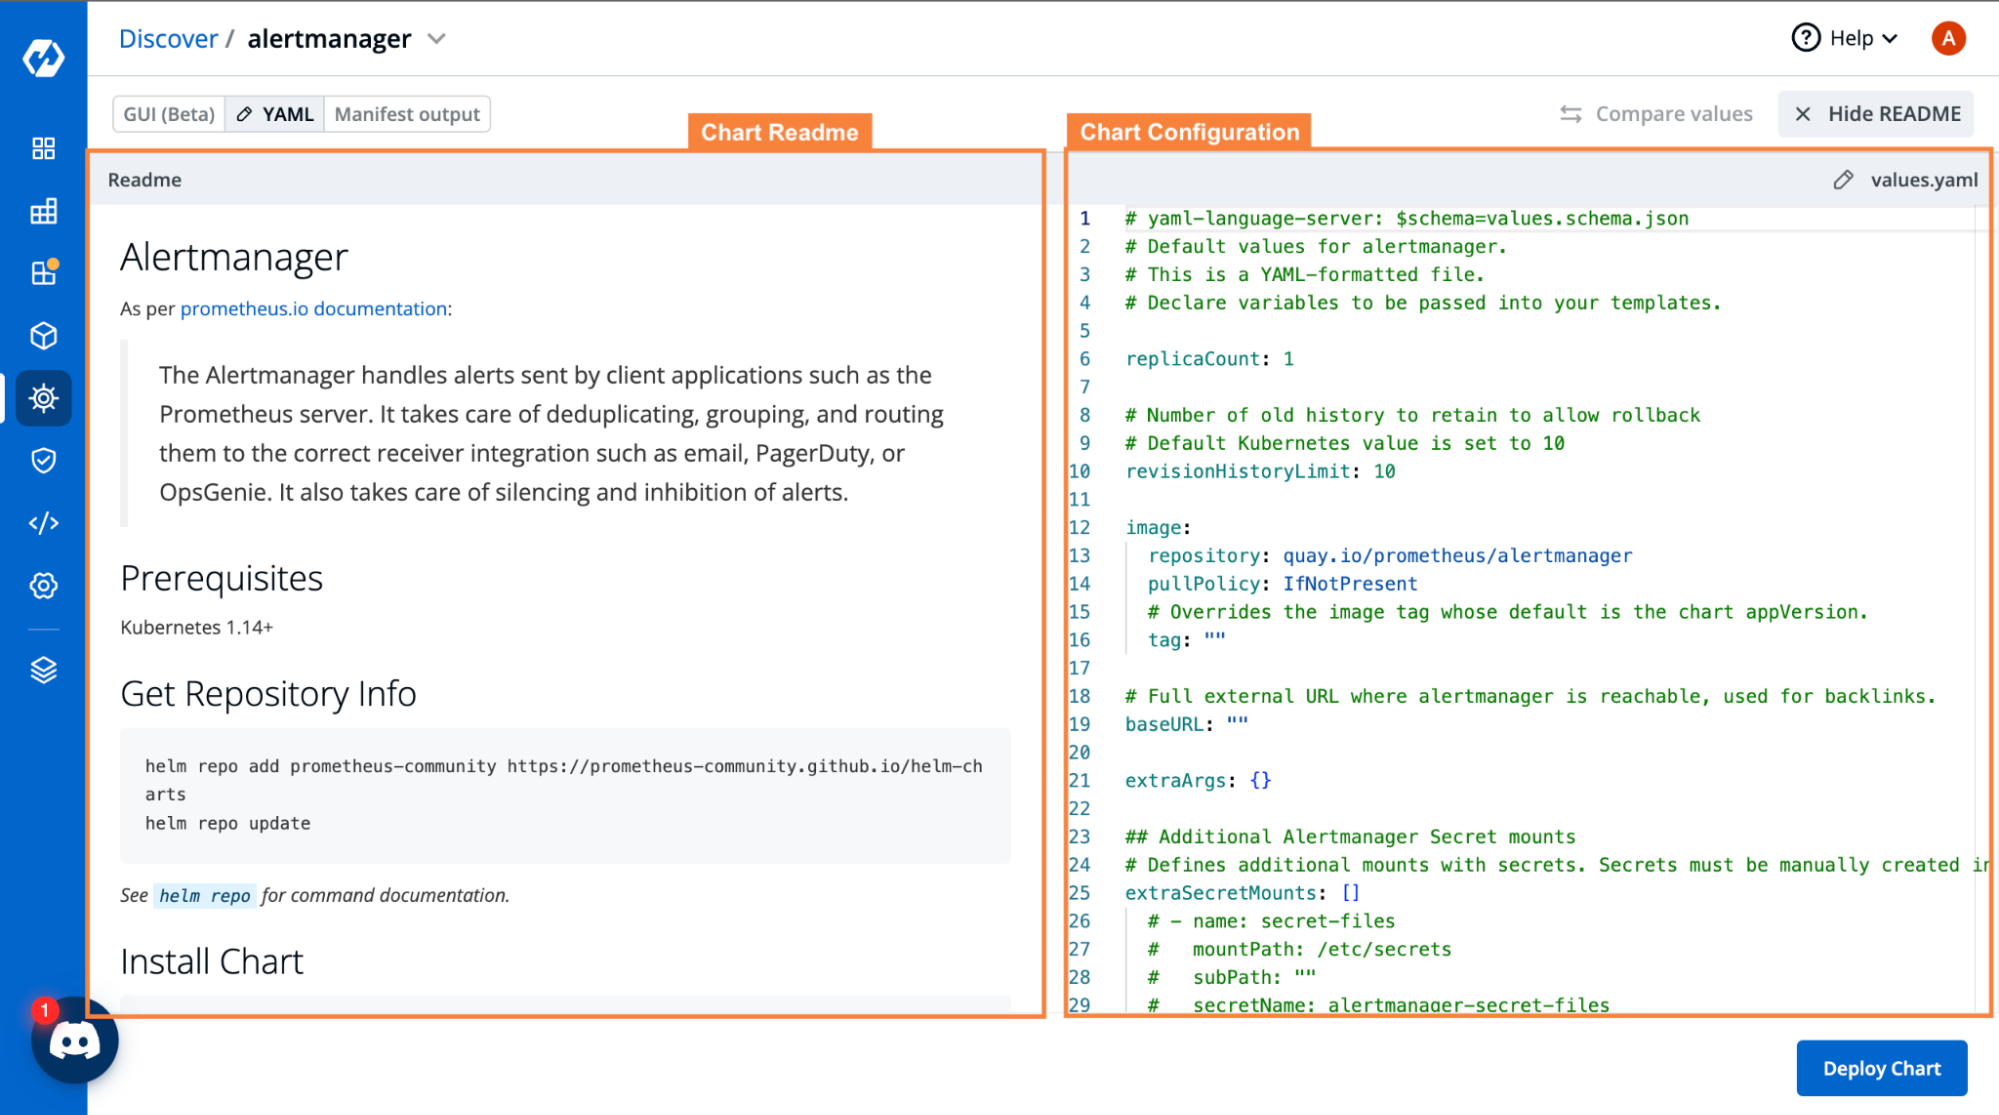
You can also easily deploy any chart if you want with just a few clicks. To deploy any chart, `Click on Chart` > `Click on Deploy`. It will open the chart's values.yaml file as you can see in the image below. Also, you can see the README of that chart side-by-side which helps you to see the parameters and its descriptions as you can see in the image below. After making necessary changes, click on Deploy Chart as seen in the image below.
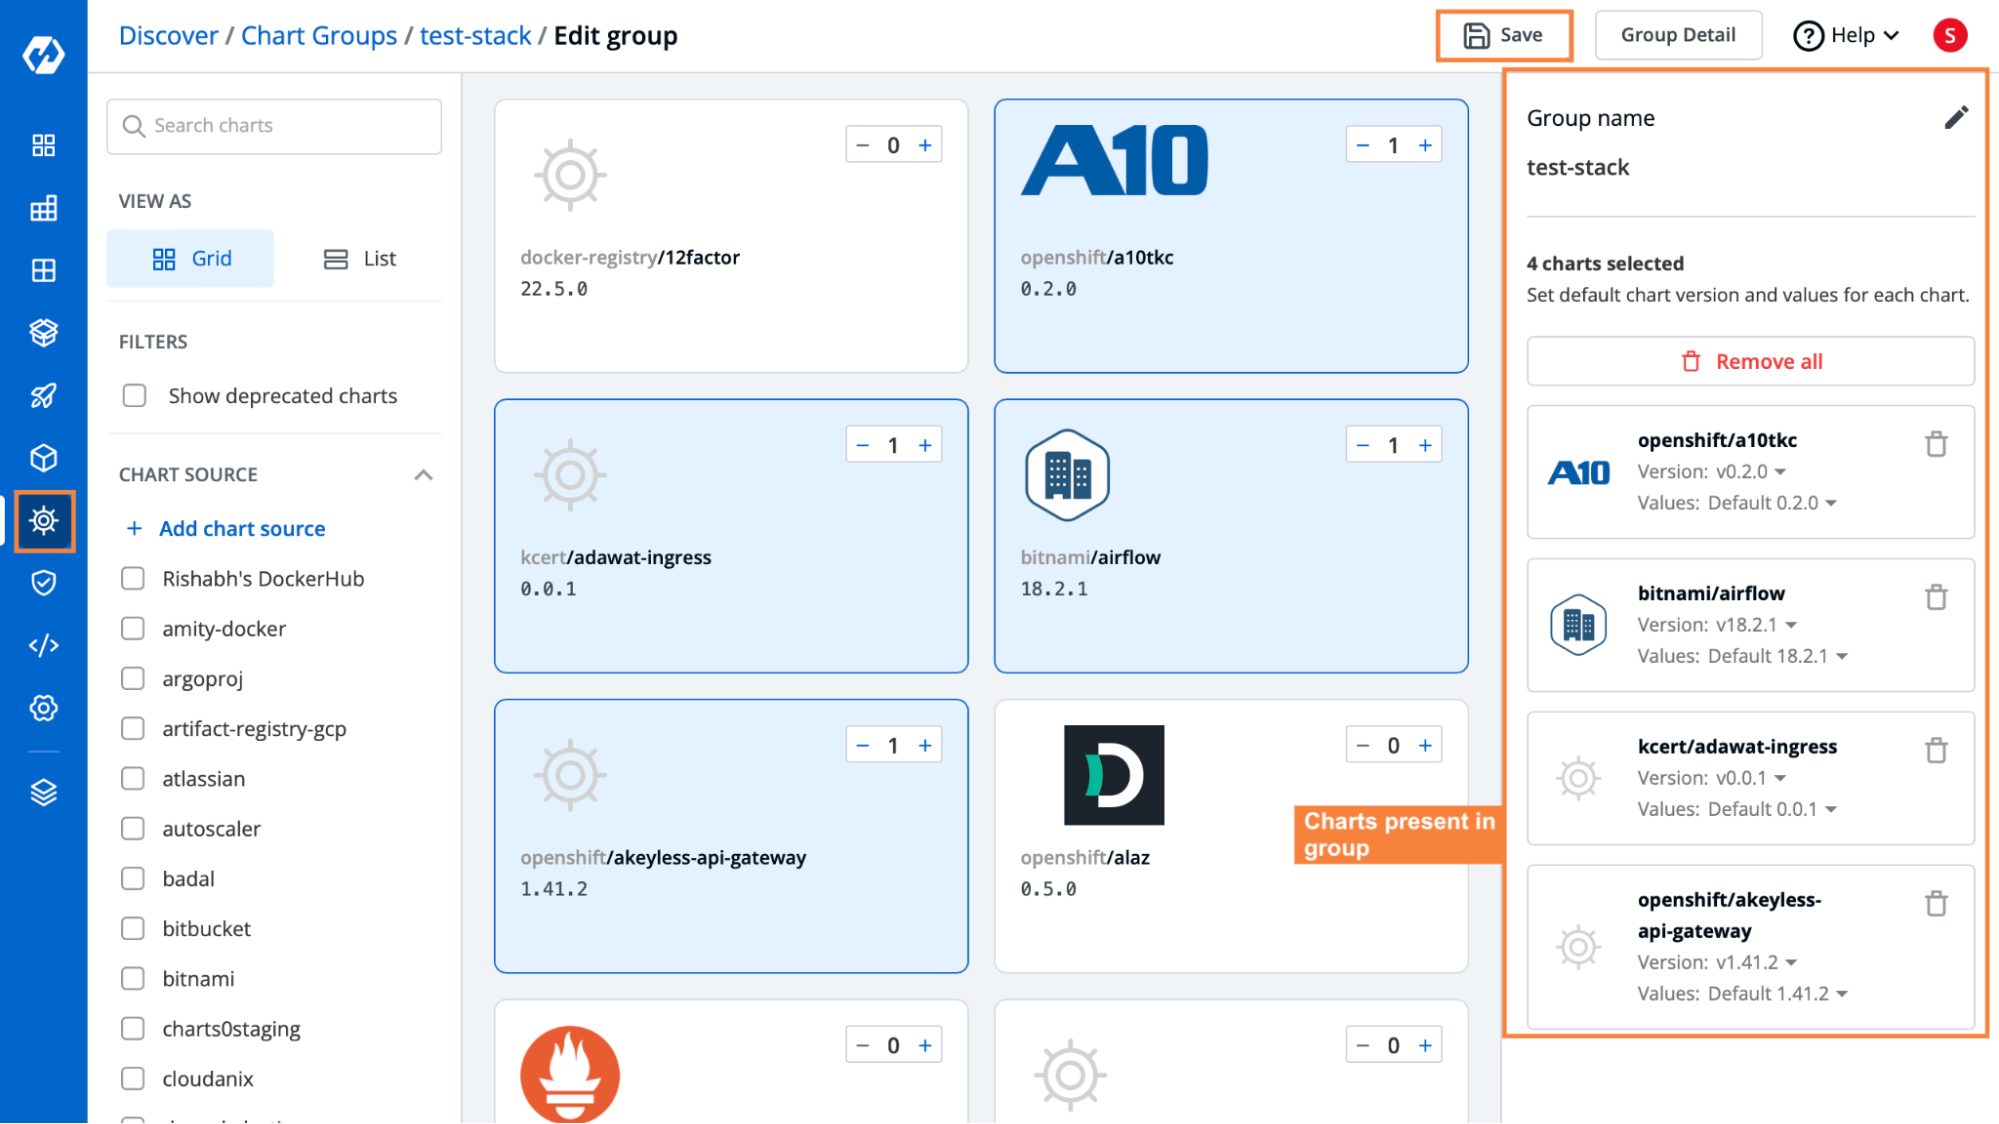
(iv) Allows Grouping of Multiple Charts
We discussed creating a group or charts in the above problems section. We also discussed some use cases where creating groups of charts can be useful. But now what’s the solution to that? From the above images, you may have already noticed that Devtron can create groups of charts.
This is the exact solution that we were talking about earlier. With these chart groups, you’re going to be able to deploy multiple charts with a single click. That makes it a lot more convenient and reduces the time required for finding and deploying charts from different repositories. Moreover, you’re not limited to how many groups you can create. Devtron lets you create as many chart groups as you need. So for example, you could have groups for infrastructure components, monitoring stacks, application-specific dependencies, networking stacks, etc.
Conclusion
Helm is a very useful tool, but it does have its own set of challenges and shortcomings. Some of the biggest problems with Helm include its shortcomings with monitoring the actual state of the deployed charts, the complexity of debugging and troubleshooting, visualizing and managing charts at scale, and creating resource groups to shorten the deployment time and reduce the effort required from SREs.
Using Devtron, you’ve obtained a solution for practically every single one of your Helm-related woes. Devtron provides a very intuitive interface for you to manage all Helm-related applications, and addresses the major challenges that we’ve discussed within this article. Even if you already have an existing Kubernetes setup with multiple different Helm applications, Devtron can still detect those Helm applications and provide all the capabilities that we have used above.
If you’re struggling with managing different Helm applications, we invite you to give Devtron a shot. We can guarantee that you won’t be disappointed. Also, you can join our community discord server and ask your queries if you have any.
For more details on how to add and deploy any existing helm chart using Devtron, please refer to this blog.
FAQ
What are the major limitations of Helm in Kubernetes application deployment?
Helm simplifies Kubernetes deployments, but it doesn’t monitor the actual state of deployed resources. If a critical resource is deleted, Helm may still show the release as “deployed,” leading to undetected failures. It also lacks built-in tools for debugging, troubleshooting, or visualizing deployed resources.
Why is debugging Helm deployments in Kubernetes difficult?
Debugging Helm applications is challenging because Helm templates abstract resource configurations and don’t expose raw YAML after deployment. You must manually inspect each resource using kubectl, making it time-consuming—especially when dealing with complex applications having 50+ interlinked components.
Does Helm provide a UI to manage deployed charts?
No, Helm does not provide a native UI. All operations—like listing, upgrading, or deleting charts—must be performed via CLI, which becomes overwhelming in large-scale environments. Managing multiple releases across namespaces can be tedious without a centralized dashboard.
How does Devtron solve common Helm challenges?
Devtron provides a web-based UI that displays live deployment statuses, enables one-click debugging, offers full visibility into manifests, events, and logs, and allows you to group and deploy multiple Helm charts at once. It transforms Helm from a CLI-only tool into a complete visual experience for DevOps teams.